FINA -5320 Managerial Finance
Project 2
Managerial Finance & Data Analysis
06/29/2022
2
Portfolio Management Analysis
Overview
The data analysis conducted aims at assessing a selected group of assets within a portfolio by
measuring their susceptibility to risk, historical performance, trends, and volatility, plus their
ability to perform in future. Therefore, the evaluation focuses on six stocks and one index that
serves as the systematic risk indicators, which are Amazon, Facebook (Meta), Tesla, Bestbuy,
Microsoft, Google (Alphabet) and, S&P 500 (the systematic risk indicator). The selection of these
assets is motivated by the various industries they operate in, while being part of the largest
companies in the stock market, especially in their respective sectors. With this stated, the analysis
will evaluate some of the idiosyncratic and systematic risks that suffice from the asset selection
and, how they can affect their performance (Chen et al., 2020). Subsequently, it will allow for a
better assessment on the correlation on stock performances over the varying time periods
considering the existing risks. Whereafter, a summary on the descriptive statistics will allow for a
ranking, while regression analysis is also vital in expressing the relationship that exists between
the assets and market (through the S&P 500). It would be worth noting that the data used is based
on a five-year timeline based on monthly prices to provide the rationale.
Idiosyncratic and Systematic Sources of risks
Firstly, idiosyncratic risks focus on the individual and distinctive issues that affect a company
either through operations and policies or industry specific factors. Therefore, based on the assets
selected, it would be worth noting the risks that affects the performances of the stock, especially
with regards to the way investor buy or sell of the particular stock. Amazon and Bestbuy operate
within the same industry of retail as the former focuses on online delivery, and the latter has both
3
physical stores and online systems. These companies are prone to identical risks such as bad
practices within their supply chain and work environment often influences the public’s perception
on the company’s. An excellent example is when Amazon was criticized for discouraging its
employees from unionizing and the public was in uproar. Other risks are such as defective products
since both companies often deal with consumer electronics and goods, which if not properly
checked can affect the market’s perception. It would be worth noting that both companies were
able to operate usually during the pandemic due to their existing online infrastructure.
The next company would Tesla, which is in the Automotive and Energy industry and has
been instrumental in pushing for electric vehicles, which prompted existing auto makers to pivot
towards renewable energy engines. This company would be prone to defective products, especially
with their battery performances, which is vital to their value proposition in the market. Other
factors are such defective software in the vehicles as they can hinder the safety of the driver.
Facebook (Meta) is the next asset, which operates in the social media and consumer advertising
sector as it owns several products under its wing such as WhatsApp, Instagram and, Facebook.
Some of the risks that affect the company’s performance mainly revolve around their privacy
issues and policies, especially after several queries into the way it handles customer data was
negatively received. The main risks unique to Facebook’s performance revolve around privacy,
data storage and, their regulation on dangerous content on the platform.
Microsoft and Google both operate within the same sector as they offer software services
in their respective segments and are equally large companies in the sector. The main risks
concentrated to these companies revolve around the security of their products since when they get
compromised, the ripple effect is large and felt across a global scale. Therefore, the companies’
main point of concern are usually the cyber security levels and standards of their products.
4
Systematic risks are those that are undiversifiable and affects the whole industry or sector the same
way, hence the selection of S&P 500, which consists of 500 of the largest caped companies in the
US. This aspect measures the way investors are trading and their overall reaction to economic
periods and/ or business cycle. For instance, when investors and the economy is booming
(expansion) people purchase more stocks, which makes the frequency to be high. Whereas, when
the economy is recessionary people sell off assets. Factors that affect these purchases are such
unemployment, inflation and high interests usually make investors sell off their assets and
purchase less.
Correlation in Performance between the Assets
Based on the selected assets, the first step would be to detrend their performances over the
last five years (monthly) and plot it to determine whether there were any similarities and
correlation between the assets in particular time periods. Therefore, the main aspects would be to
evaluate each asset individually and liken them together to denote the similar patterns over the
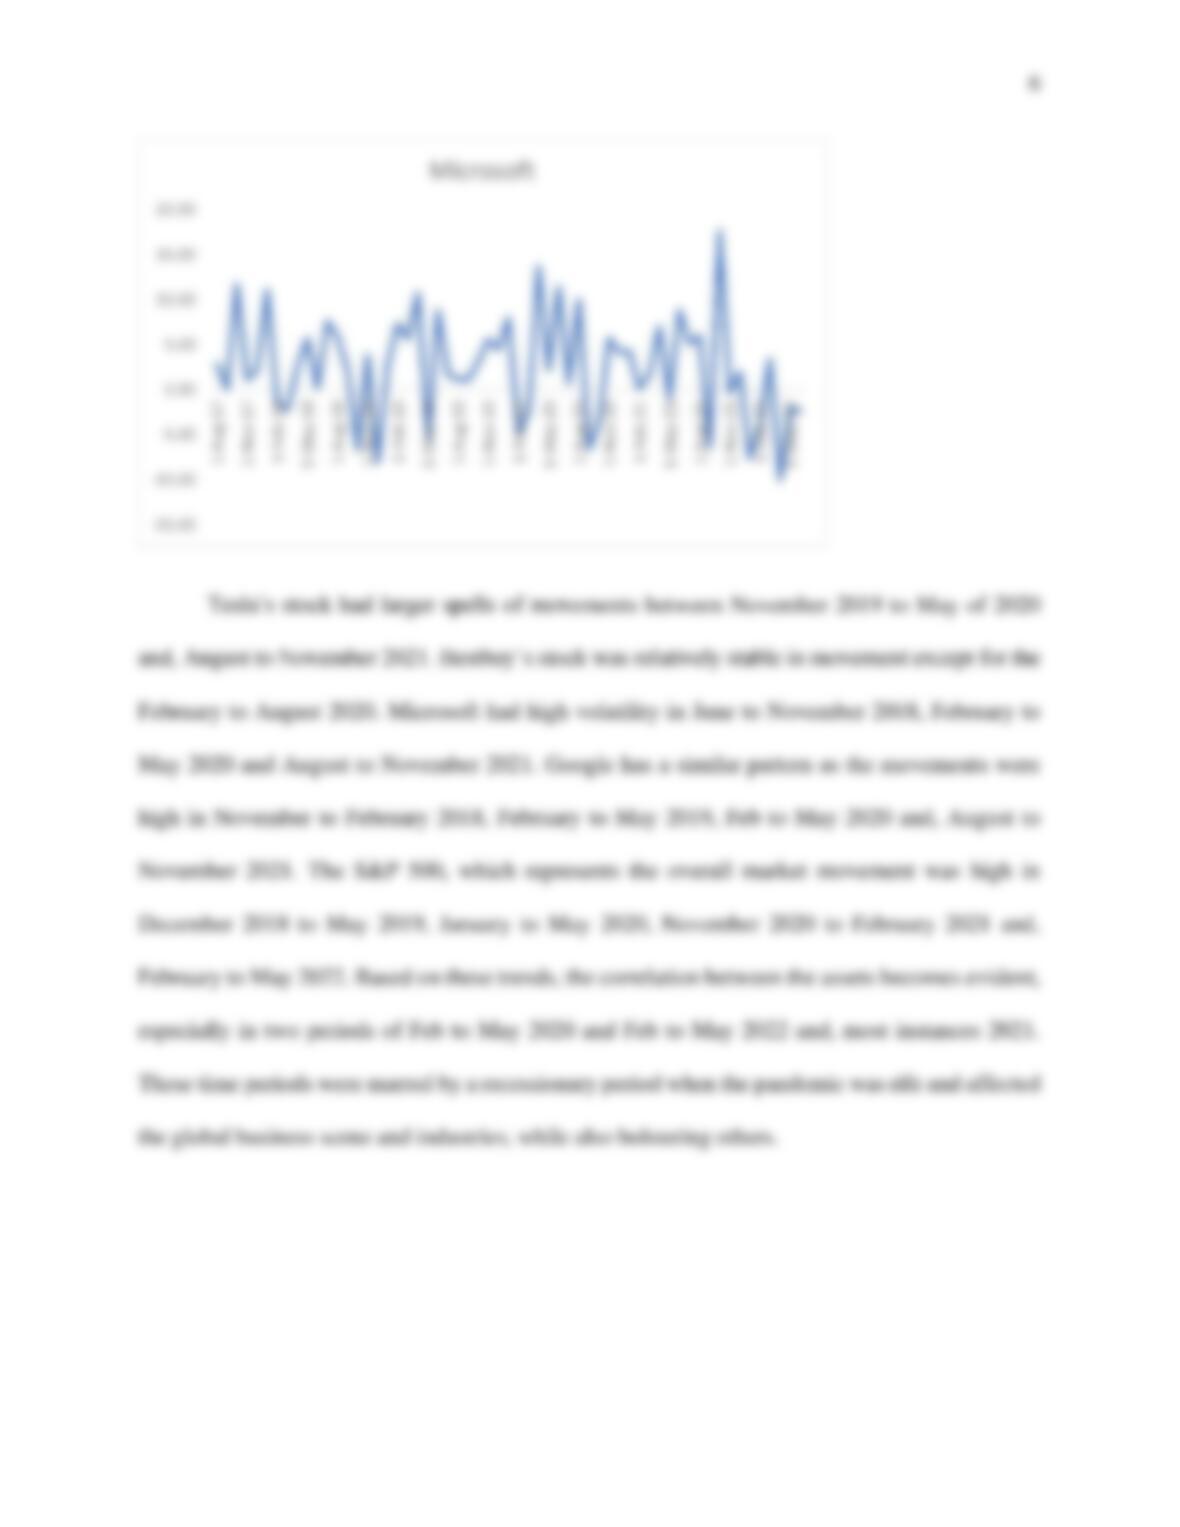
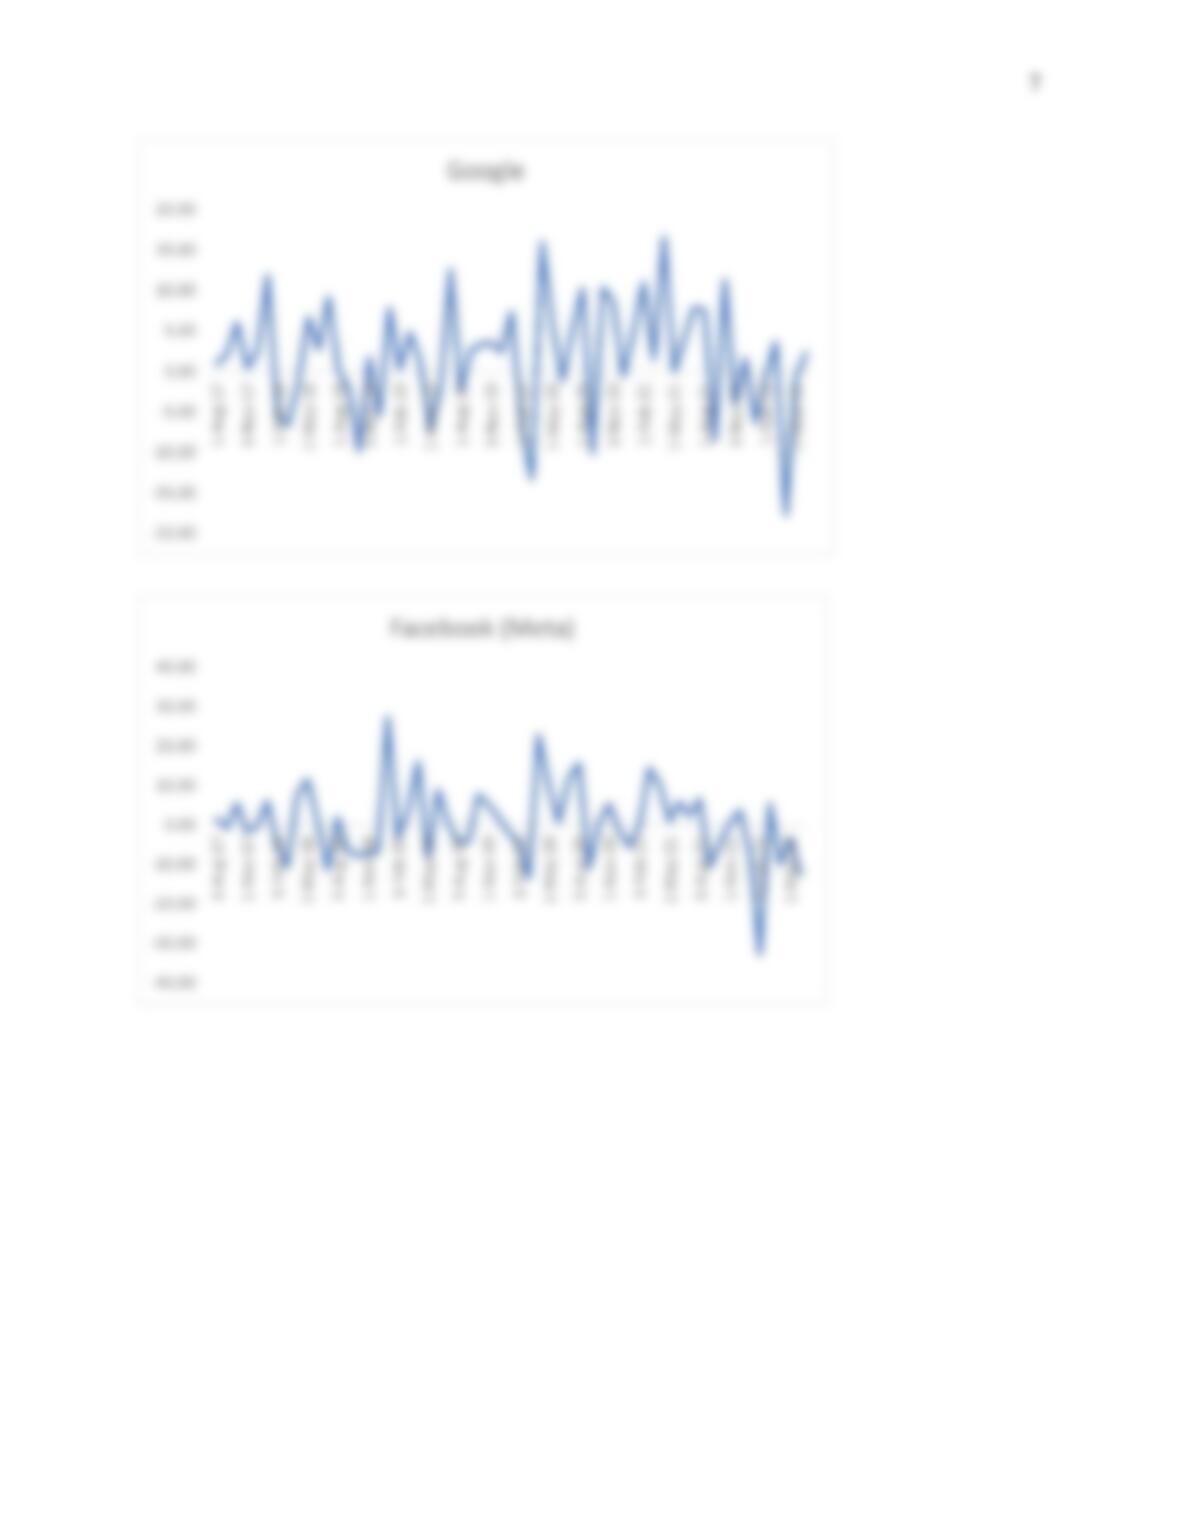
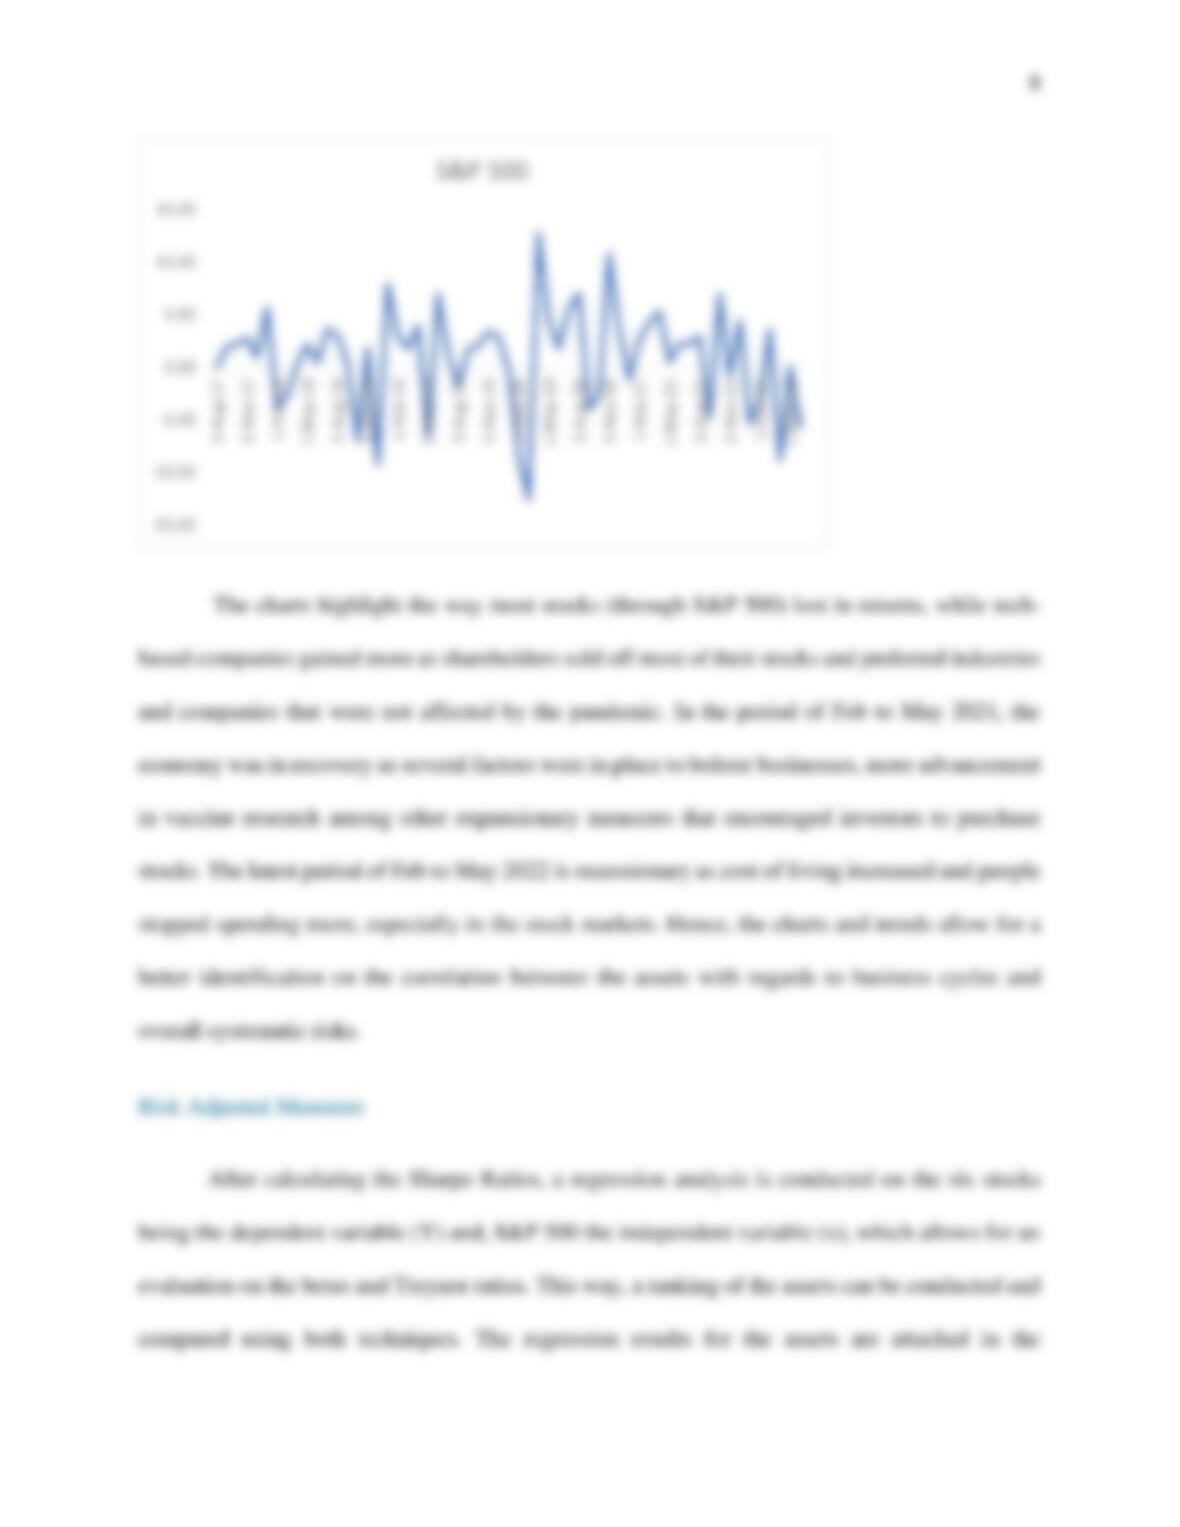
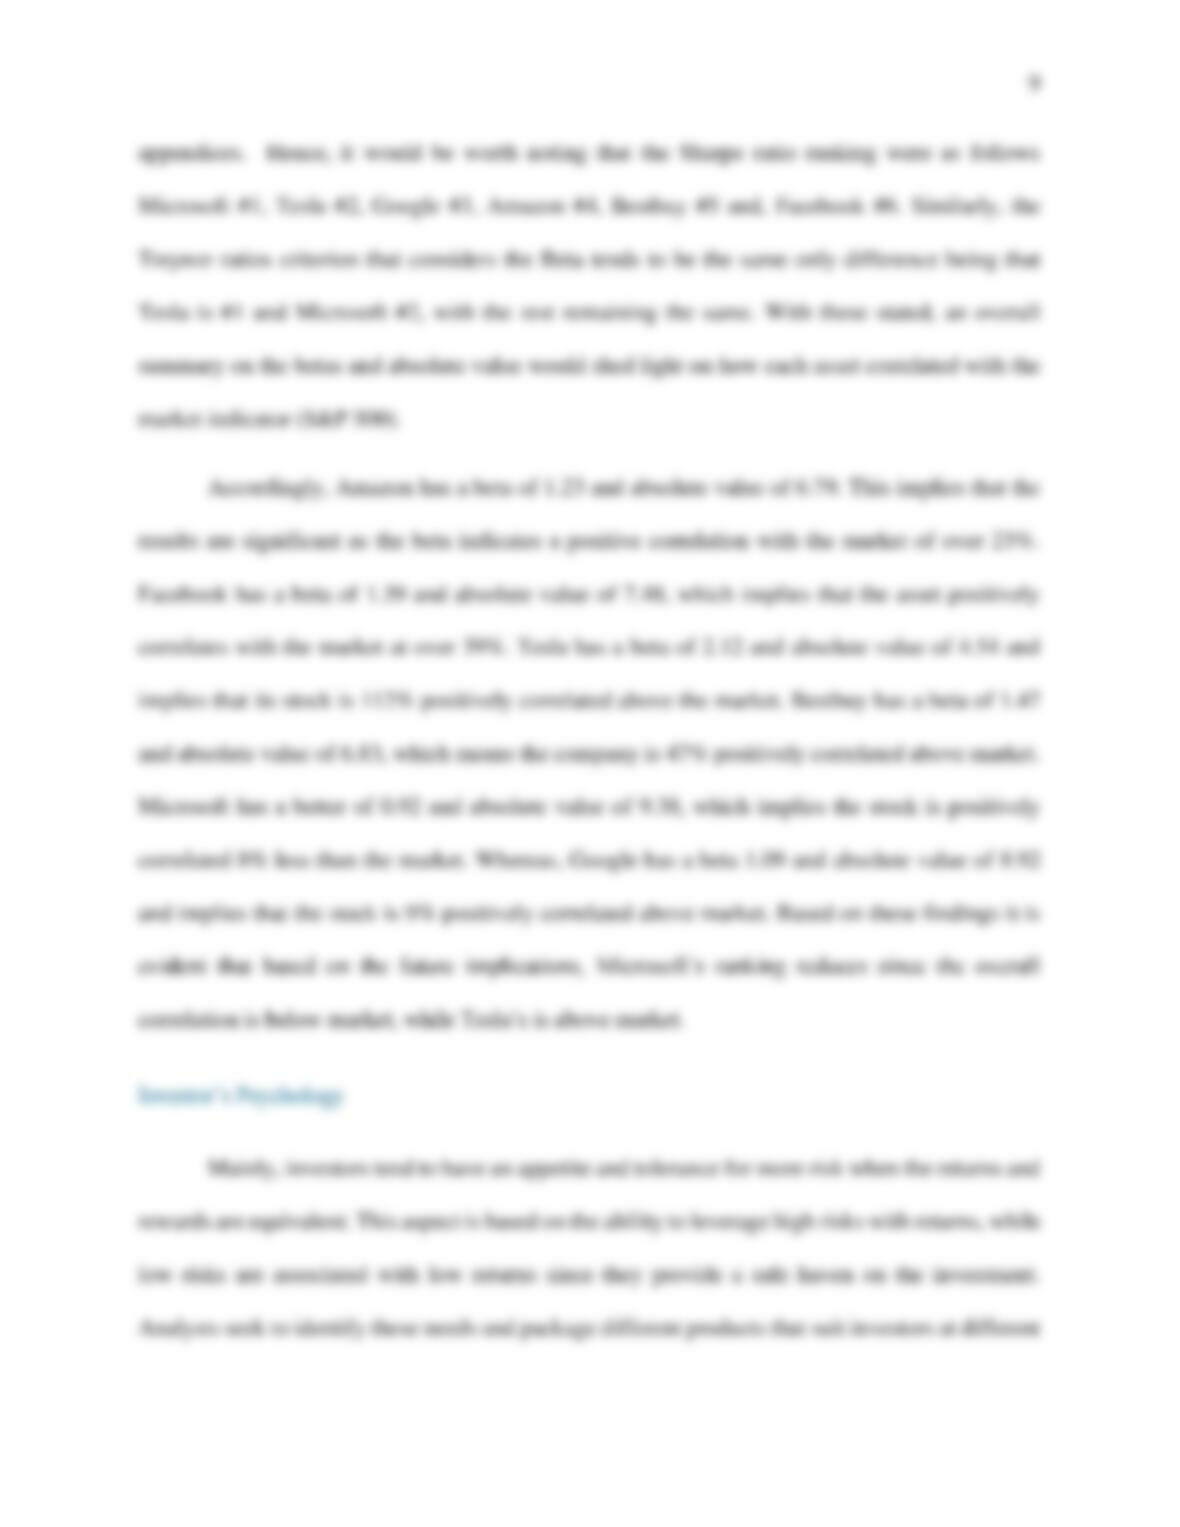
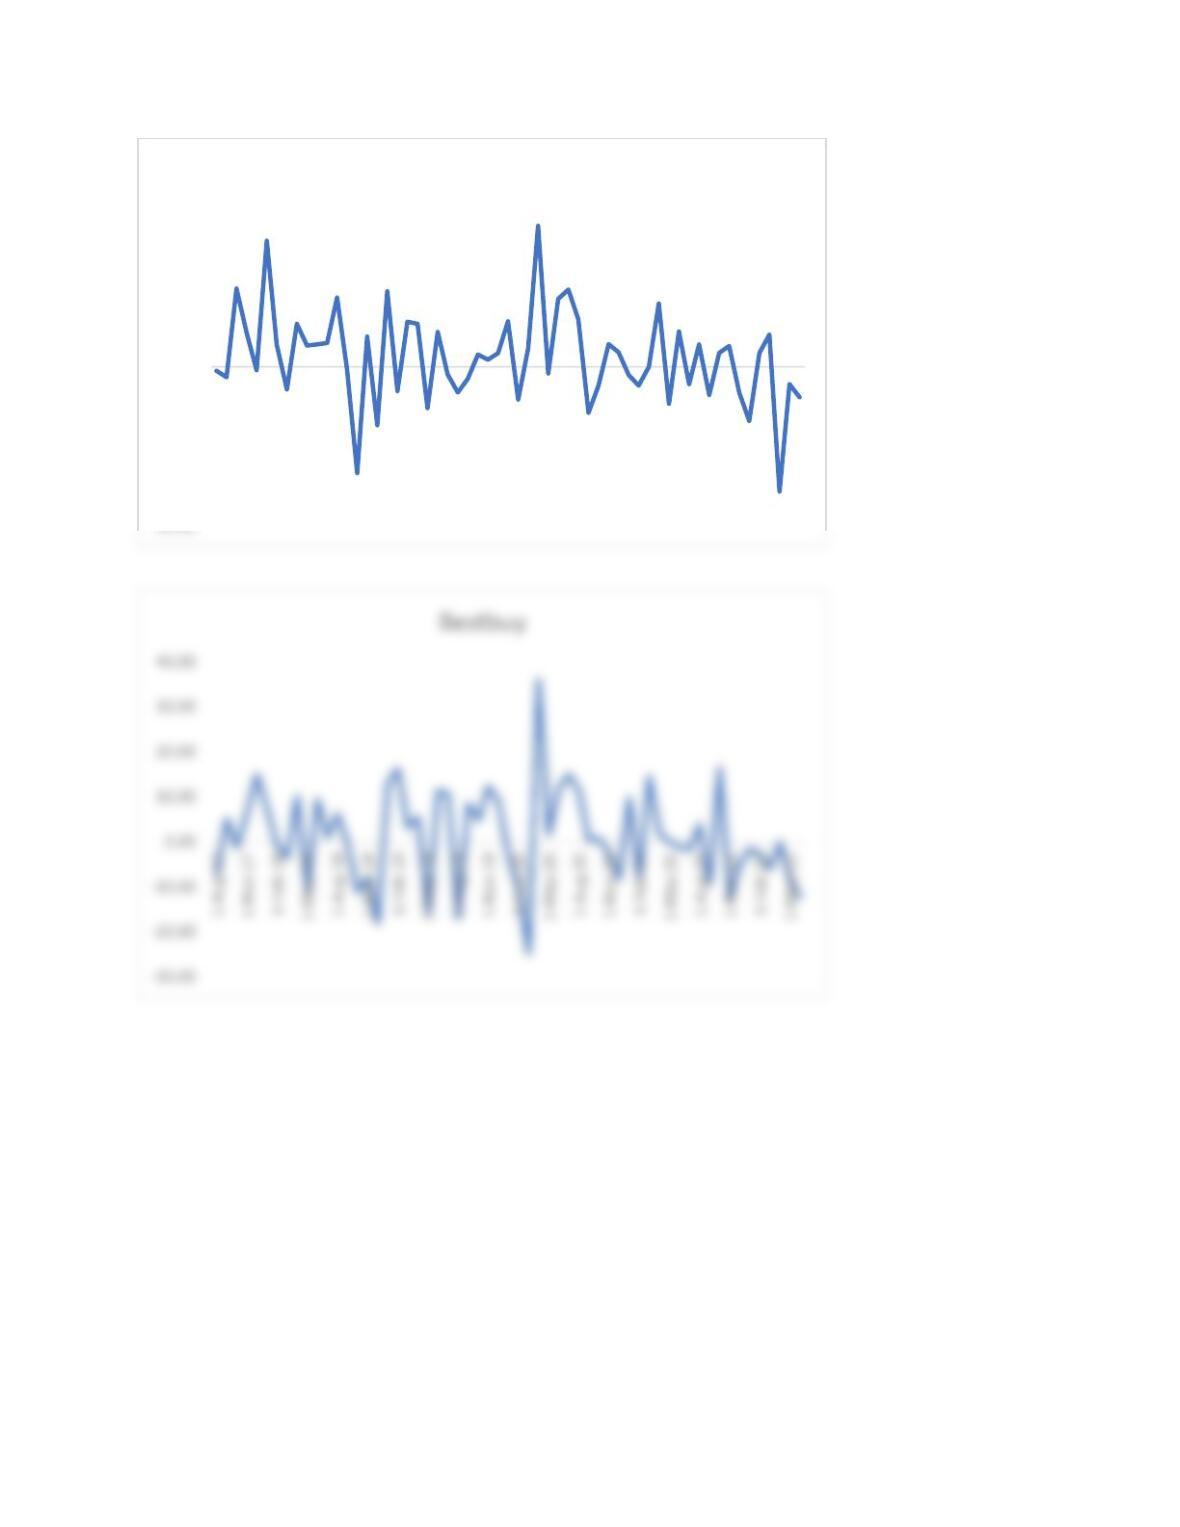
business cycle. First off, the trends for the Amazon stocks were highly volatile during the time
periods of August to November 2018, Feb to May 2020, February to May 2021 and February to
may 2022 as noted from the charts. The next stock is Facebook, which had high movement between
November 2018 to February 2019 and, February to May of 2020.
5
-20.00
-10.00
0.00
10.00
20.00
30.00
1-Aug-17
1-Nov-17
1-Feb-18
1-May-18
1-Aug-18
1-Nov-18
1-Feb-19
1-May-19
1-Aug-19
1-Nov-19
1-Feb-20
1-May-20
1-Aug-20
1-Nov-20
1-Feb-21
1-May-21
1-Aug-21
1-Nov-21
1-Feb-22
1-May-22
Amazon