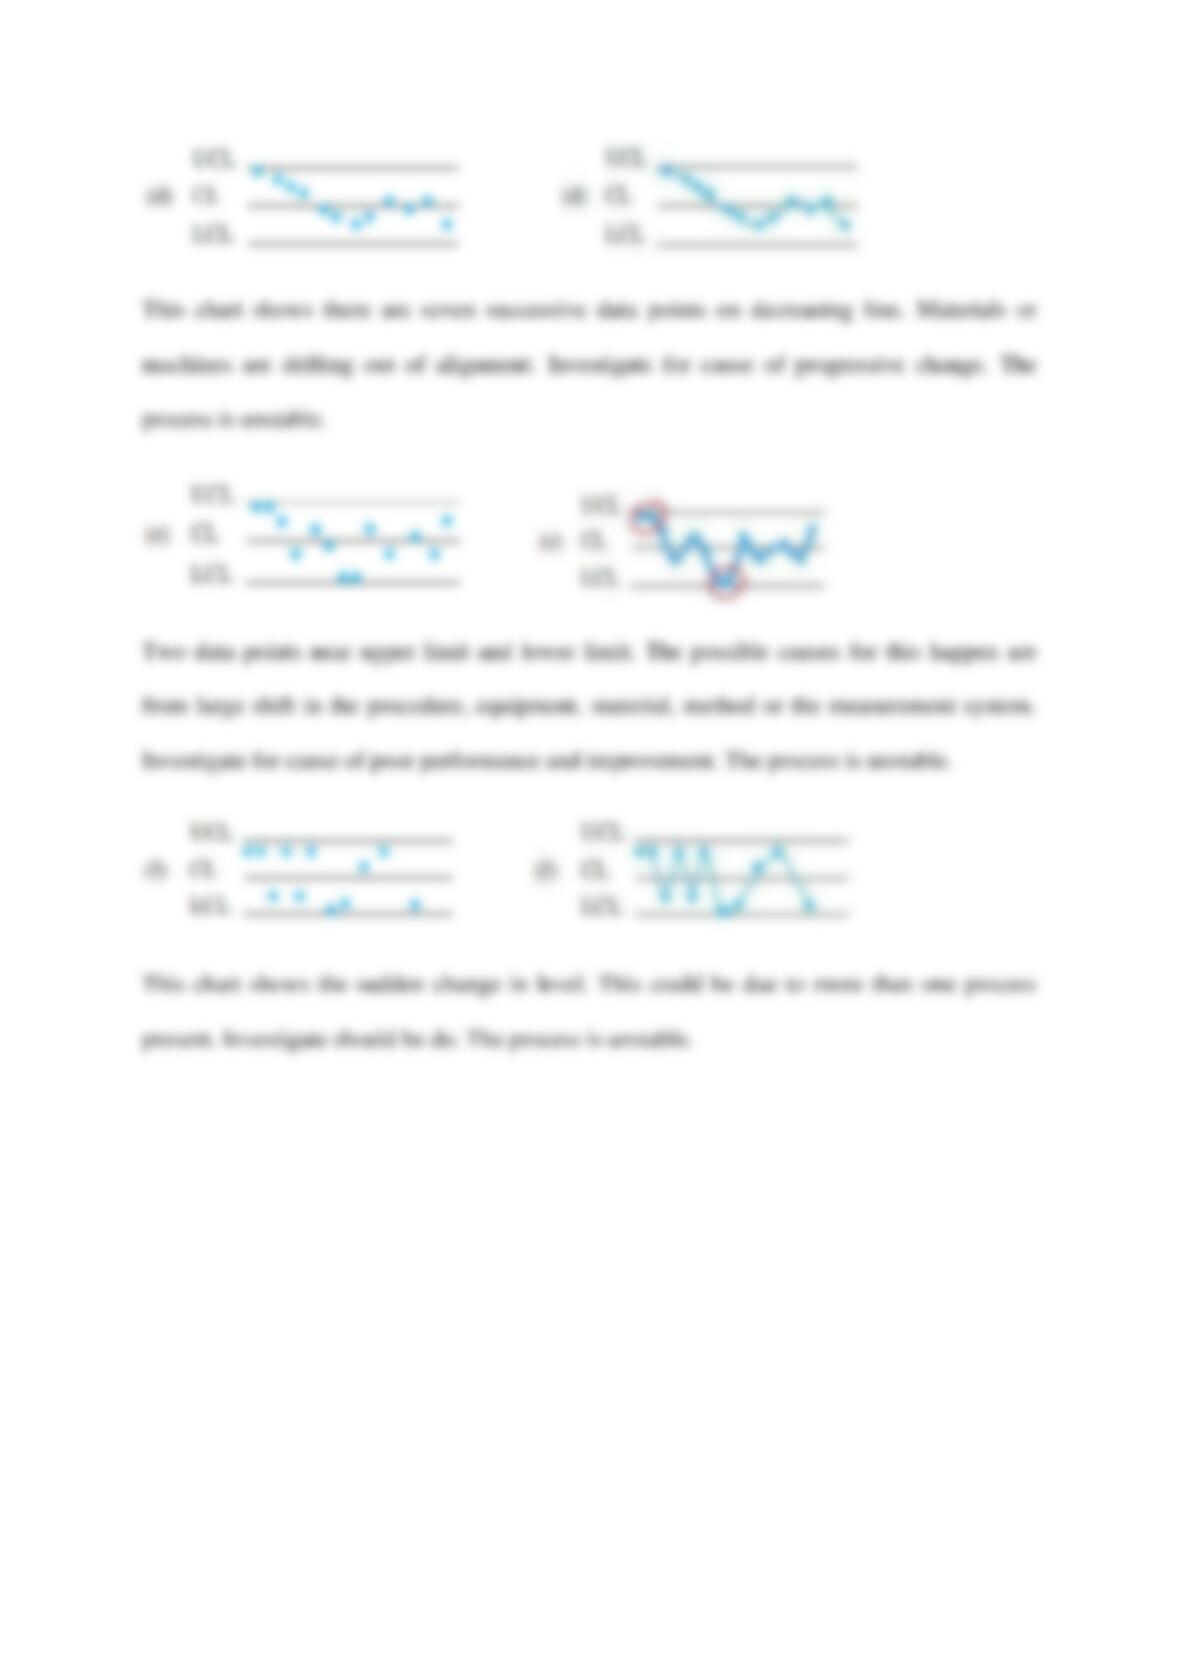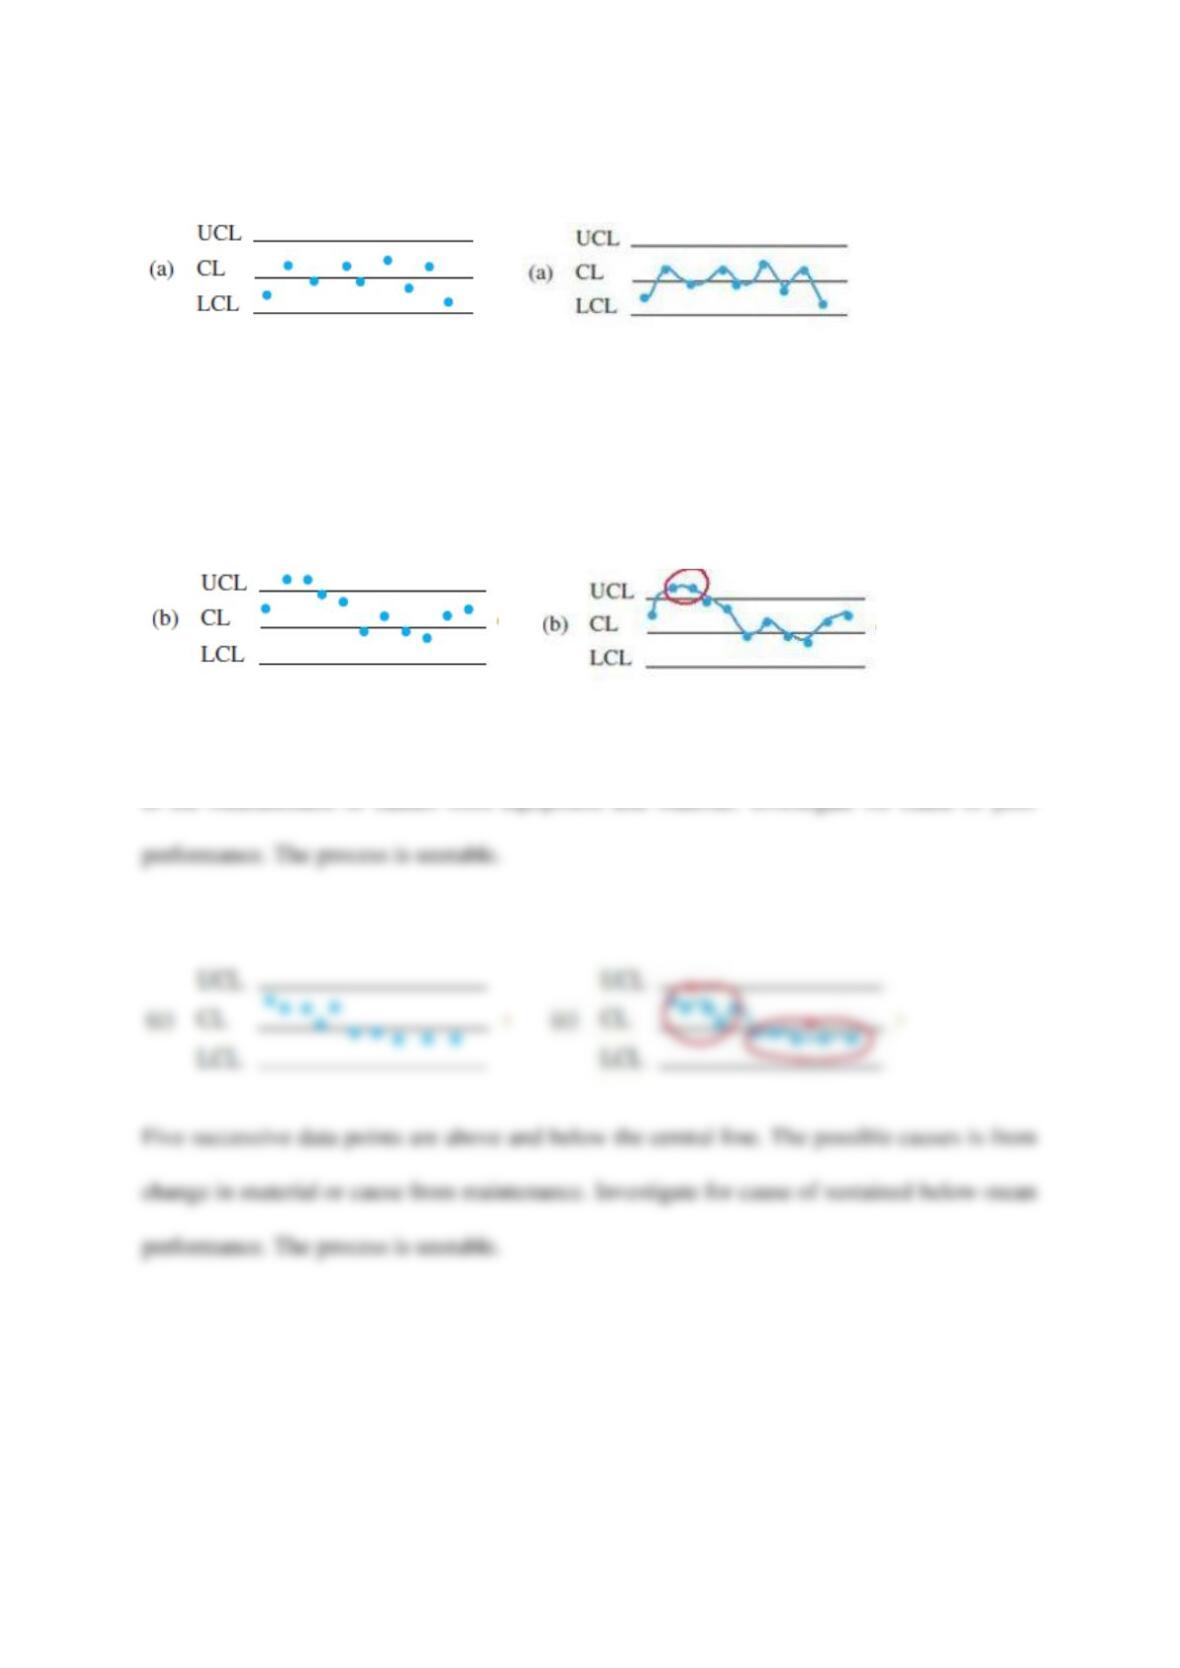
11.6. Interpret the following charts to determine whether the processes are stable
This chart shows a normal behaviour. There are a few points near to the central line and control
limits. It also no points are above the upper control limit or below the lower control limit. The
process is stable.
This chart shows there are points that exceed the UCL. This pattern indicates there are error