Potentiometry
CH 426, Anna Pan (Due: 10/23/14)
Introduction
In this experiment, a redox poten!ometric !tra!on of ferrocyanide [Fe(CN)64-] as the !trand and cerium
[(NH4)4Ce(SO4)42H2O] as the !trant was carried out. The volume of cerium at the equivalence point, the
e2ec!ve poten!al of a saturated calomel reference electrode, the standard reduc!on poten!al of the
Ce(IV)/Ce(III) half reac!on, and the junc!on poten!al of a NaNO3 salt bridge were determined.
Poten!ometric !tra!on is a volumetric method in which the poten!al between a reference and indicator
electrode is measured as a func!on of !trant volume.
The net redox reac!on carried out in this experiment was where Ce(IV) in (NH4)4Ce(SO4)42H2O is the
oxidizing agent and Fe+2 in ferrocyanide is the reducing agent. The reduc!on The equivalence point in a
!tra!on is defined as the point where the moles of !trant equal the moles of !trand, which indicates the
comple!on of the !tra!on. The important ions present in solu!on prior to the equivalence point are Ce(IV)
and Fe+2, while the important ions present in solu!on a:er the equivalence point are Ce(III) and Fe+3.
The Nernst equa!on, which relates the cell poten!al to the standard poten!al and to the concentra!ons
of the ions, is:
where Ecell° is the reduc!on poten!al of the cell in standard condi!ons (25°C and 1 atm). Eocell can be
determined through the following equa!on:
Eocell = Eored(Ce(IV)/Ce(III) + Eoox(Fe) (3)
This equa!on states the poten!al of the cell can be found by adding the poten!als of the redox half reac!ons.
He oxida!on reac!on is the ferri/ferrocyanide couple reac!on, , which has an EFe° of 0.690 V. The reduc!on
reac!on is the Ce(IV)/Ce(III) half reac!on.
Oxida!on: Fe2+ Fe3+ + e–Eoox. = -EoFe. = -0.69 V
Reduc!on: Ce(IV) + e– Ce(III) Eored. = E°Ce(IV)/Ce(III)
Overall: Eocell = -0.69 + E°Ce(IV)/Ec(III)
The poten!al of the cell, Ecell, is related to the indicator electrode poten!al (Eind), the reference electrode
poten!al (Eref), and the net junc!on poten!al (Ej) through the following rela!onship.
Poten!ometric !tra!on requires several primary components: a reference electrode, an indicator
electrode, a salt bridge, an analyte, and a poten!al measuring device. The line nota!on for a typical cell for
poten!ometric analysis is:
Reference Electrode | Salt Bridge | Analyte Solu!on | Indicator Electrode
The reference electrode is a half-cell with an accurately known standard reduc!on poten!al, Eref°, and
is completely insensi!ve to the analyte concentra!on and composi!on. The reference electrode used in this
experiment was the saturated calomel electrode (SCE), one of the most widely used and easily prepared
reference electrodes. It consists of mercury in contact with a saturated solu!on of mercury(I) chloride
(calomel) that is saturated with potassium chloride. The half-cell of the SCE can be represented as:
Hg | Hg2Cl2 (sat’d), KCl (sat’d) ||
The electrode poten!al for this half-cell is determined by the following reac!on:
The indicator electrode is immersed in the analyte solu!on and develops a poten!al, Eind, which is
dependent on the concentra!on of the analyte. Ideally, an indicator electrode responds rapidly and
reproducibly to changes in the concentra!on of the analyte. The indicator electrode used in this experiment
was the pla!num electrode, which is chemically inert, and its poten!al follows the Nernst equa!on.
The salt bridge, which connects the reference electrode to the analyte solu!on, prevents components
of the analyte solu!on from mixing with those of the reference electrode. The liquid-junc!on poten!al is the
poten!al di2erence that develops when one ion moves to an electrode more rapidly than another ion and
can be counteracted by the use of a salt bridge. The salt bridge provides nega!ve ions at the anode and
posi!ve ions at the cathode. In this experiment, two salt bridges were used – the KCl bridge and the NaNO3
bridge. The KCl bridge has a net junc!on poten!al of zero to at most a few millivolts because K+ and Cl– ions
travel at virtually equal speeds. In contrast, Na+2 and NO3– do not travel at the same speed, so a net junc!on
poten!al develops when using the NaNO3 salt bridge. Therefore, one of the objec!ves of this experiment was
to determine the net junc!on poten!al across the NaNO3 bridge based on the assump!on that the KCl bridge
has a zero net junc!on poten!al.
The poten!al measuring device used in this experiment was the MeHler/Toledo T50 Automated
Titra!on unit. It is an extremely precise, accurate, robust, and versa!le instrument that can deliver small
volumes of liquid with an almost endless array of possible parameters. The unit is linked to any combina!on
of electrodes and the T50 so:ware, which can be used to perform both the simplest and the most complex
poten!ometric analysis.
The T50’s output is a !tra!on curve, which has a characteris!c sigmoidal curve. The part of the curve
with the steepest slope marks the equivalence point of the !tra!on, which is the point where chemically
equivalent quan!!es of !trant and !trand have reacted with each other. The 9rst deriva!ve, ΔE/ΔV, is the
slope of the curve, and the endpoint occurs when ΔE/ΔV has the maximum value. Note that the slope
changes fastest just before and just a:er the equivalence point. At the equivalence point, the rate of change
of the slope is zero, which is called an inJec!on point. A plot of poten!al as a func!on of !trant volume will
display the inJec!on point in the steeply rising por!on of the curve, while a plot of poten!al per unit volume
of !trant (1st deriva!ve, ΔE/ΔV) will display a maximum value that corresponds to the equivalence point.
Experimental Section
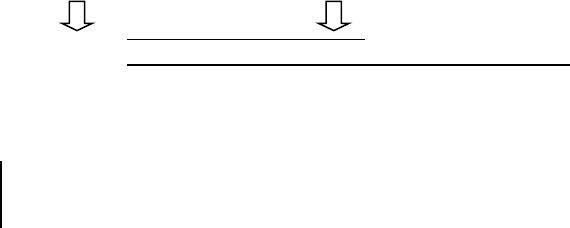
Salt-Bridge Preparation. Two long and narrow glass tubings were obtained and snapped to the
correct length. The shortened glass tubings were held over the Jame of a Bunsen burner at the spot indicated
by one of the black arrows below.
________________________________________
A:er the Jame so:ened the glass un!l an ideal malleability, the glass tubings were bent at a 90° angle to
achieve the shape indicated by the 9gure below.
___________________________
Glass Tubing
Glass Tubing

The bent glass tubings were allowed to cool. Next, the tubings were held over the Jame of a Bunsen burner
at the spot indicated by the second black arrow and also bent at a 90° angle to form two bridges with two
ver!cal limbs of approximately equal length. (See shape indicated by the 9gure below.)
__________________
The two shortened and bent glass tubes were clamped in an inverted fashion with the two ver!cal limbs
extending upwards with an approximately 2-inch long piece of rubber hosing aHached at both ends. The 9rst
agar gel was prepared by dissolving 3 grams of agar and 40 grams of KNO3 in 100 mL of hot dis!lled water.
With the aid of a funnel, the hot liquid was poured into the 9rst inverted bridge glass tube un!l it was
overJowing to remove any air bubbles. A:er clamping the rubber hosings at the end of the tube and allowing
the tube to cool, the rubber hosings were appropriately trimmed and stored, resul!ng in the KNO3 salt bridge.
The second agar gel was prepared in an iden!cal manner as the 9rst (steps 6 and 7), except that 40 grams of
KCl was dissolved in the agar instead of KNO3, resul!ng in the KCl salt bridge.
Reagents. 10.0N H2SO4 stock solu!on, solid potassium ferocyanide, K4Fe(CN)6*3H2O, from the J.T.
Baker Chemical Company, and 0.04511 M Ce(IV) solu!on were provided. 2N H2SO4 was prepared through a 1-
in-5 dilu!on of 10N H2SO4 stock solu!on. Because the molar mass of potassium ferocyanide is 211.949 g/mol,
exactly 0.2119 g of Fe(CN)6-4 solid was weighed out on the balance and diluted in 100 mL of 2N H2SO4 to form
approximately 0.01 M Fe(CN)6-4 in 2N H2SO4. The total volume of !trant to be delivered for each !tra!on was
approximately 4 mL, so the equivalence point should be reached when approximately 2 mL of the cerium
!trant has been added. Thus, using M!trantV!trant = M!trandV!trant, it was determined that 8 mL of 0.01 M Fe(CN)6-4
in 2N H2SO4 should be transferred into the !tra!on cup for the !tra!on runs.
Titration Measurements. The MeHler/Toledo T50 Automated Titra!on unit and its associated
computer were powered up. Under the Analysis tab of the Lab X so:ware applica!on on the computer’s
desktop, the CH426 method was selected. The following seUngs of the MeHler/Toledo Automated Titra!on
Glass Tubing