The process begins with the picking of coffee beans, and ends at the packing stage.
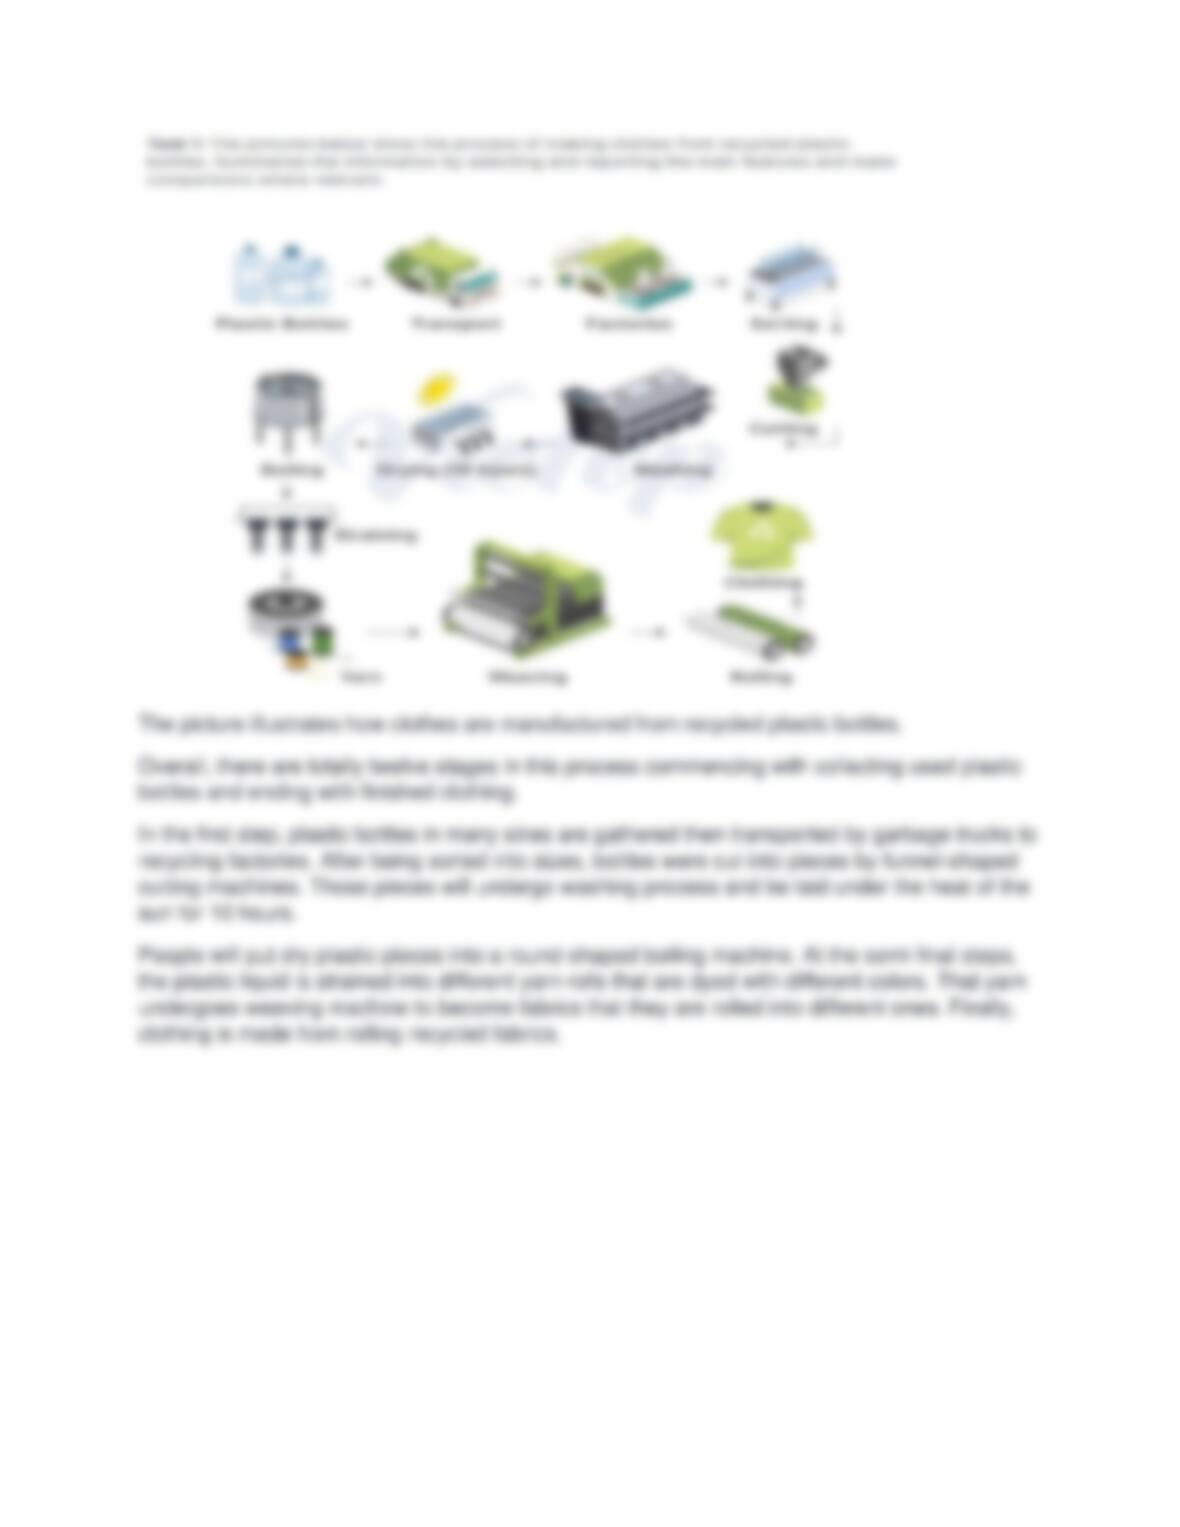
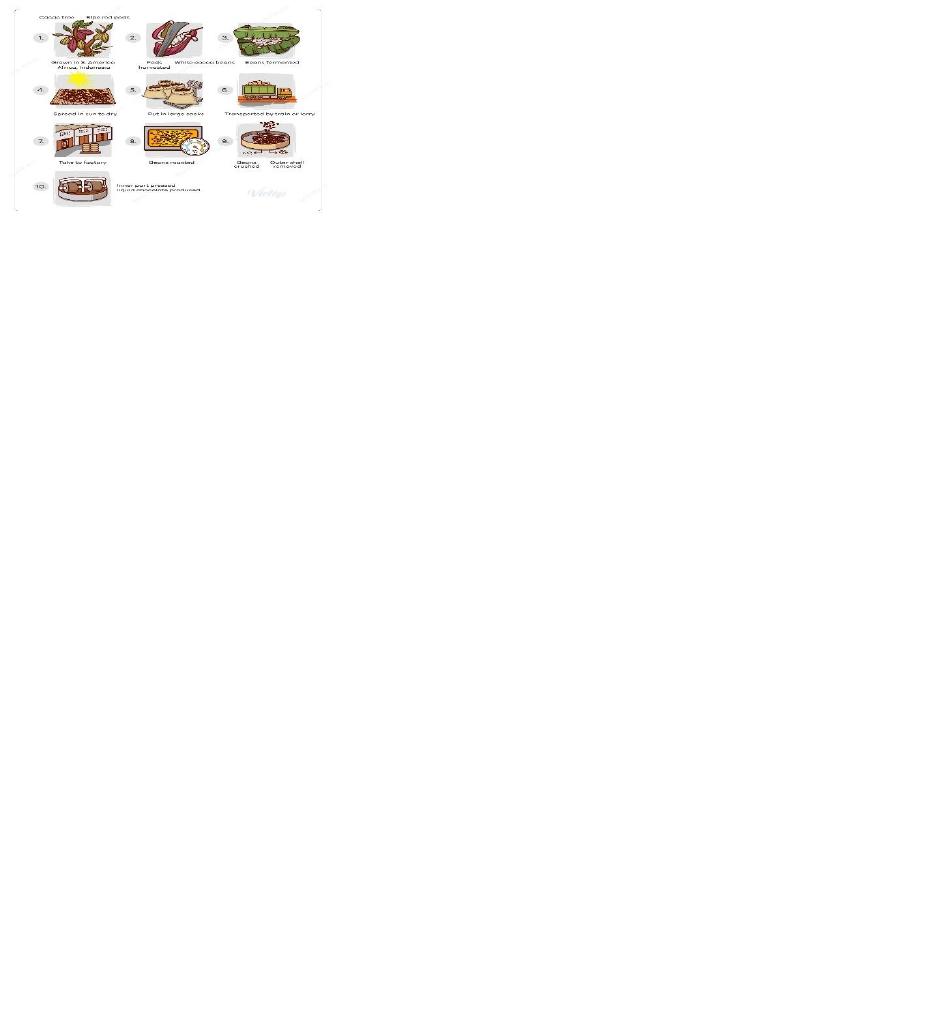
The picture illustrates the chocolate manufacturing process. Overall, there are mainly ten stages/phases
to produce chocolate commencing with harvesting the cacao fruit from the trees and ending with
completing liquid chocolate products.
First of all, people have to collect the cacao fruits from trees that are grown in South American, Africa,
and Indonesia, and those ripe fruits were identified by their red pod shape. In the next step, the inner
white cocoa beans are harvest then they are taken to be fermented under many banana leaves layers.
After they are fermented, people would spread the cacao bean under the heat of the sun for drying
them.
The next step is that dry beans are packaged into sacks and transported to the factory by train or lorry.
After being taken into the factory, dry cacao beans are roasted at the heat of nearly 250 Celsius degrees.
Finally, those roasted cacao beans are put into a crushing machine having a round shape to remove the
outer shell from the cacao core before crushed cacao beans are move to a machine that has two large
flatty wheels to be ground into liquid and become chocolate.
Upon being harvested,
Upon being harvested, the oval-shaped pods have their skins removed,
and are broken into halves so that the white cocoa beans can be collected.
Thereafter: after that
they are fermented
The process continues when
Undergoes
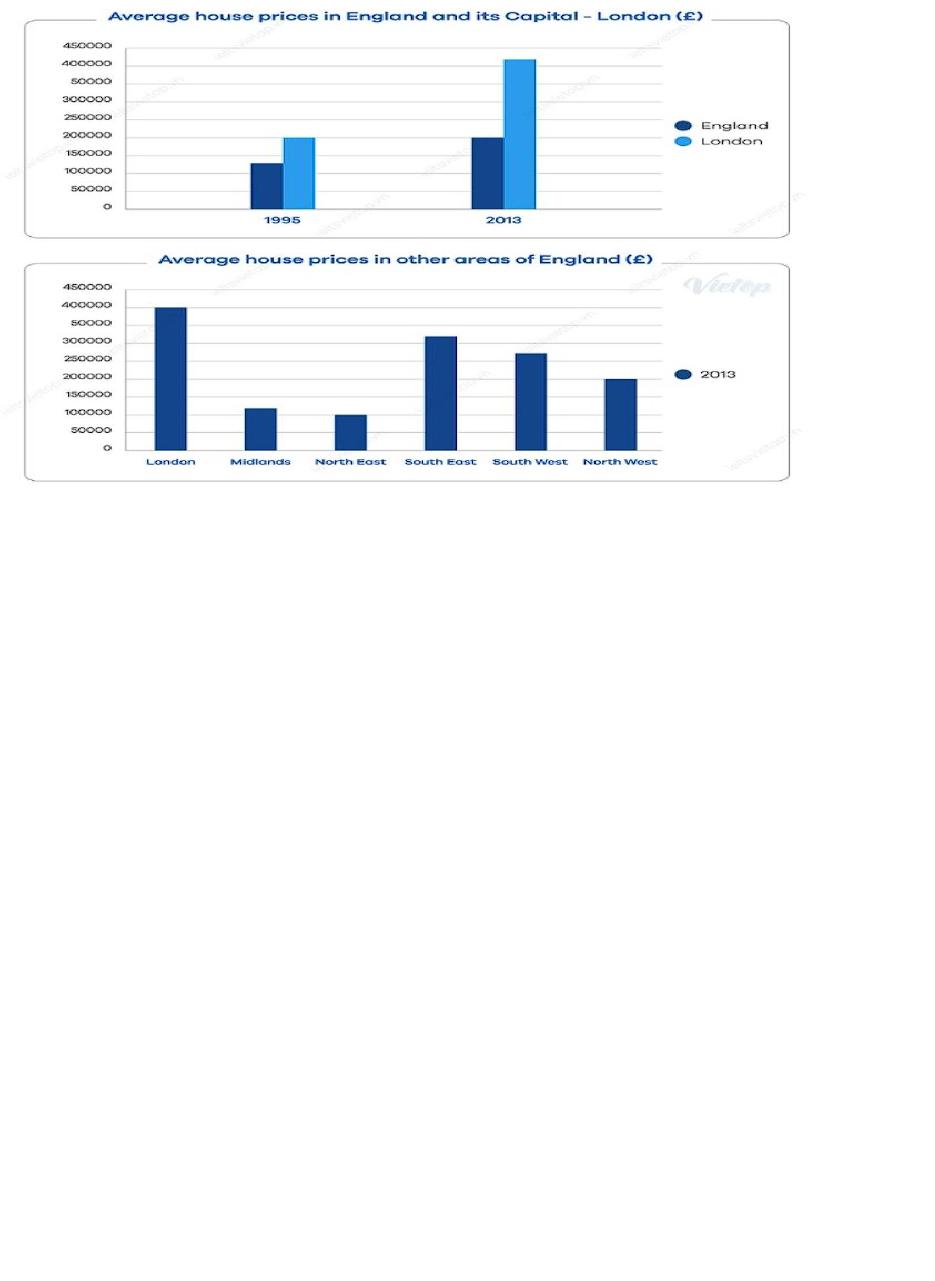
The bar charts below illustrate the general cost for a house in England and its capital – London
in the years 1995 and 2013 as well as make a comparison about average house prices in other
areas of England in 2013.
Overall, it is obvious from the first graph that the amount of money spent on houses in the whole
of England increased while London had the highest house price in both research periods.
Additionally, London still had the first rank at house prices compared to other lands of England
in 2013.
In 1995, the average price for purchasing a house in England is nearly 130000 pounds, which is
less than 200000 pounds of that in London. While the house expenses in London dramatically
double to over 400000 pounds in 2013, the figure for England only reaches the price which is
equal to the house prices in London 1995, about 200000 pounds.
Regarding the house prices range in other regions of England, London was still reported as the
highest price nearly 400000 pounds while the opposite was true for the North East area, in
which residents spent only 100000 pounds for purchasing a house. Moreover, South East and
South West regions held the second and the third rank which the prices for owning a house are
nearly 310000 pounds and 275000 pounds, respectively.
…..,more than double the country’s average.
Stood/ to be at the top of the list
ranked second and third places
In stark contrast =In contrast = by contrast
Respectively = in that order
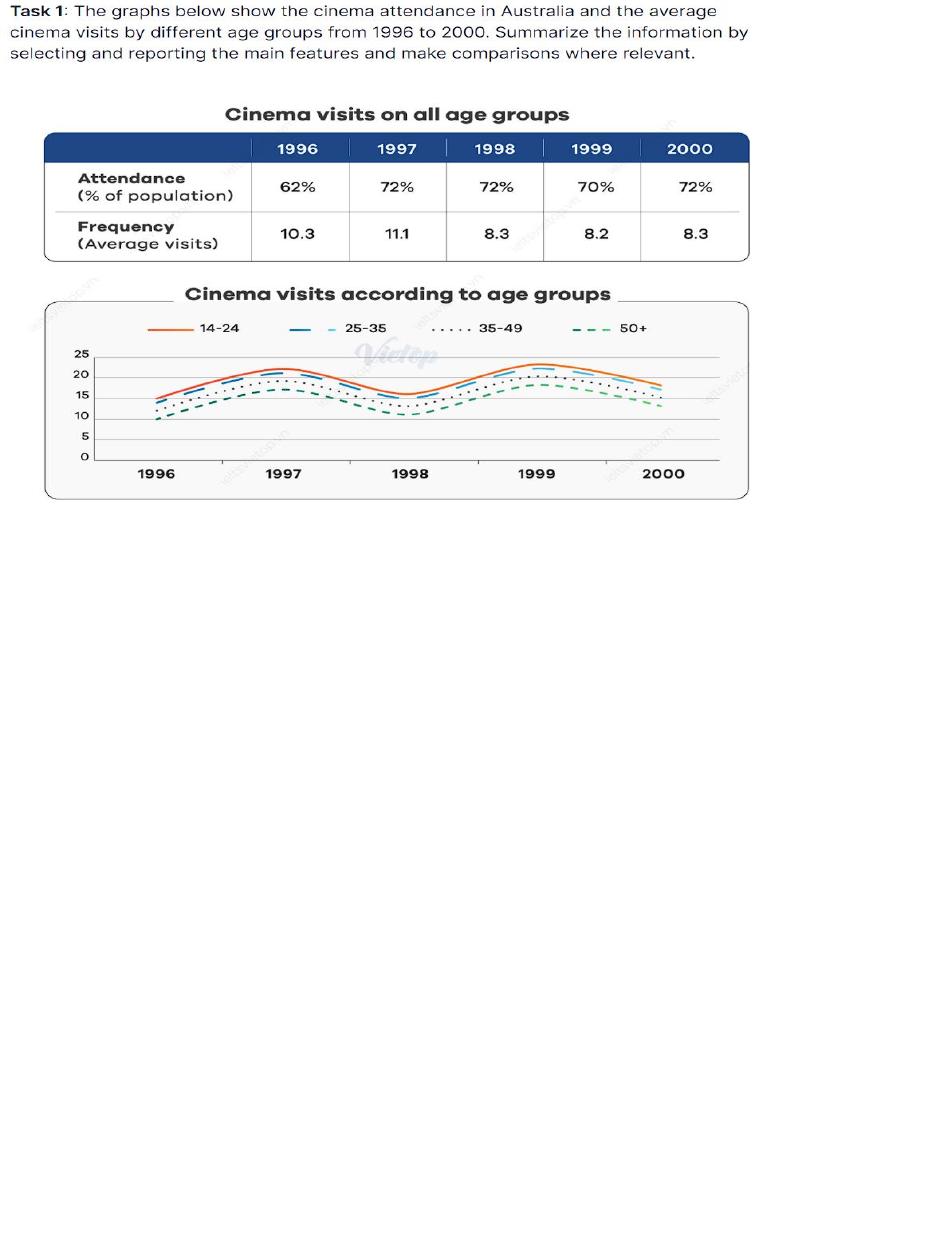
The table graph illustrates the proportion of Australian residents attending cinema as well as
how many times on average they visit while the line chart below shows the number of average
cinema visits of distinctive four ranges of age from 1996 to 2000.
Overall, it is obvious that Australia witnessed an increase in the amount of cinema attendance in
the researched period, whereas, the number of visits experienced a downward trend. In
addition, people whose age from 14 to 24 years old seems most interested in going to the
cinema while the oldest age range, over 50 years old, did not keen on this type of
entertainment.
In 1996, there are over half of a number of the Australian population, around 62%, had attended
the cinema with 10,3 average visits. In the next following years, the percentage of the Australian
paying visit continued to rise steadily to about 72% and remained stable till the end of the period
despite the slight fall to 70% in 1999. In contrast, although the frequency of average visits had
reached a peak at 11.1, this figure decreased dramatically before reaching 8,3 in 2000.
Regarding the number of cinema visits according to age groups, Australian residents pay to visit
the cinema between 10 to 15 per years with the older old range visiting slightly less than the
younger age groups. All the age groups followed the same trend with the number of cinema
visits fluctuating from 10 to 15 till the end of the period.
Over the given time = throughout the period
Remain fairly stable
Follow the same trend
Stabilize = remain stable
Initially = firstly
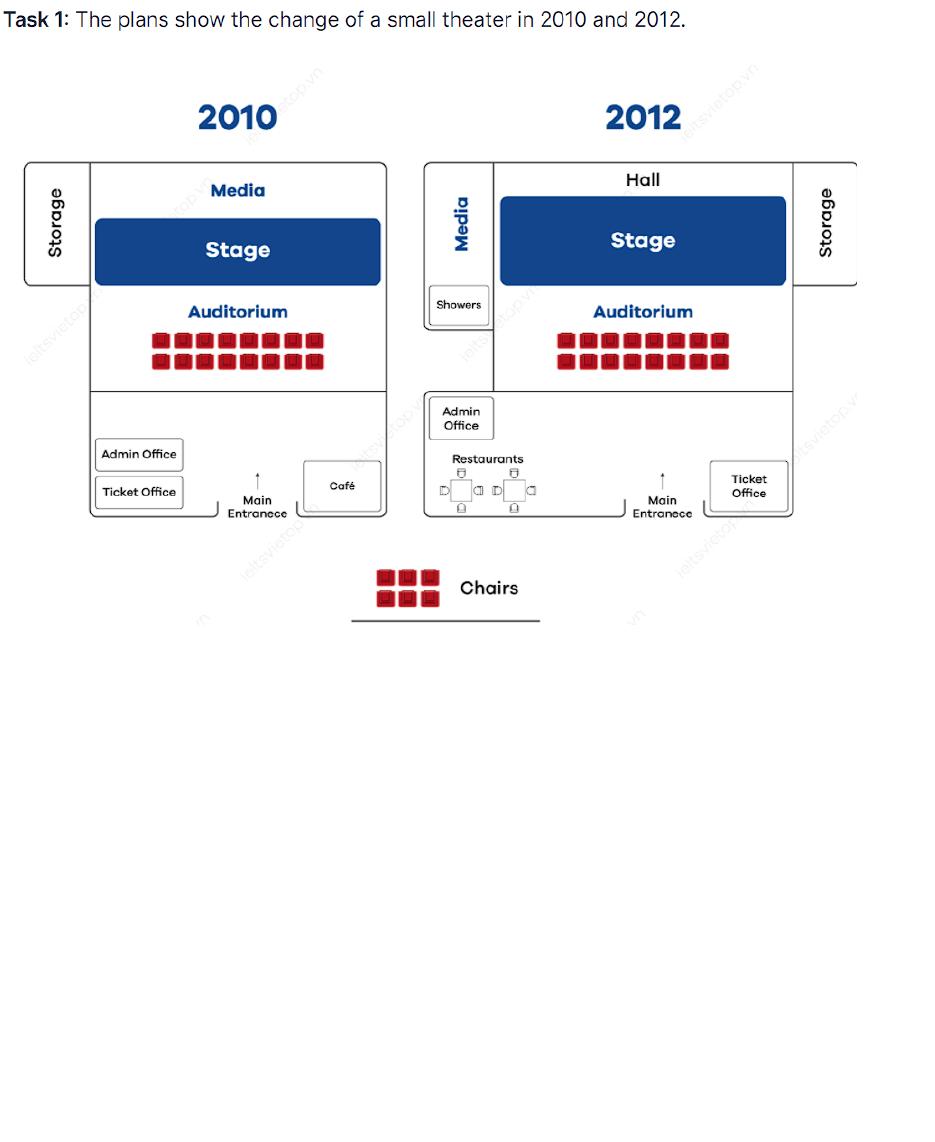
The map illustrates the shifts happening to a small theater between the years 2010 and 2012.
From the diagram, it is obvious that the theater had undergone significant modifications
including the rearrangement of the storage room as well as the hall. Another striking feature is
that there are some additions to new function rooms.
In 2010, looking from the right side of the main entrance was a cafeteria while the admin office
and ticket office were on the opposite side. There is an auditorium with around 18 chairs which
were located at the center of the theater. The stage was built between the auditorium and media
room which was at the end of the structure. Moreover, the storage room was set on the left wall.
After refurbishment, the auditorium and 16 chairs had not experienced any change, whereas,
the front area had changed dramatically. The whole area was broadened and the café shop was
replaced by the ticket office. Additionally, the place of the ticket office used to be is now for a
humble restaurant and the admin office was allocated at the left top corner of the entrance area.
The stage in 2012 was wider when the media attached with showers was on the left side of the
theater which is the storage room used to be. The storage room experienced the removal from
the left side to the right sidewall.
Accommodate S.O needs
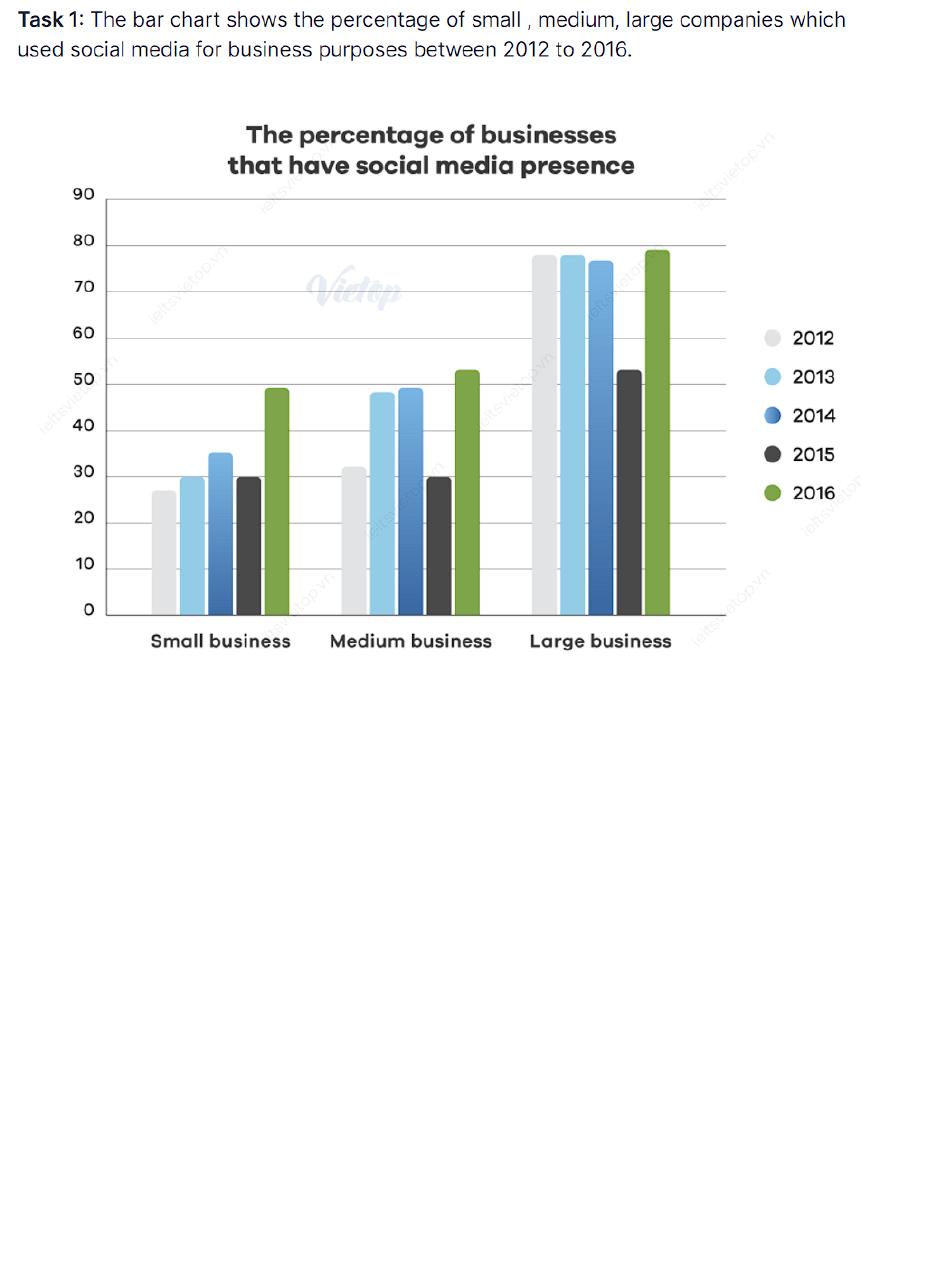
The bar chart illustrates the proportion of small, medium, and large entrepreneurs that utilized
social media as means of a business tool from 2012 to 2016.
Overall, there is an increasing number of companies that have social media in practice. Another
striking feature is that large firms have the highest rate of using social media in businesses in
the research period.
In 2012, huge conglomerates held the first rank in the percentage of businesses having media
presence with almost 79%. In contrast, small and medium started with humble figures for that,
only 25% and over 30%, respectively. The year 2014 witnessed increases in the proportion of
businesses assisted by the media, which was about 25% at small firms and nearly 25% while
large companies have a slight fall at 77% using this type of traffic.
The year 2015 was an unfortunate period when the figure for all types of companies drop
dramatically that large businesses using media account for over 50% while small and medium
businesses share the same rate, about 30%. At the end of the given period, there was a
recovery in the percentage of using social media for business purposes at all small, medium,
and large firms, about 49%, 52%, and nearly 80%, respectively.
After, bounce back to
Marginal = sharp
In term of = regarding
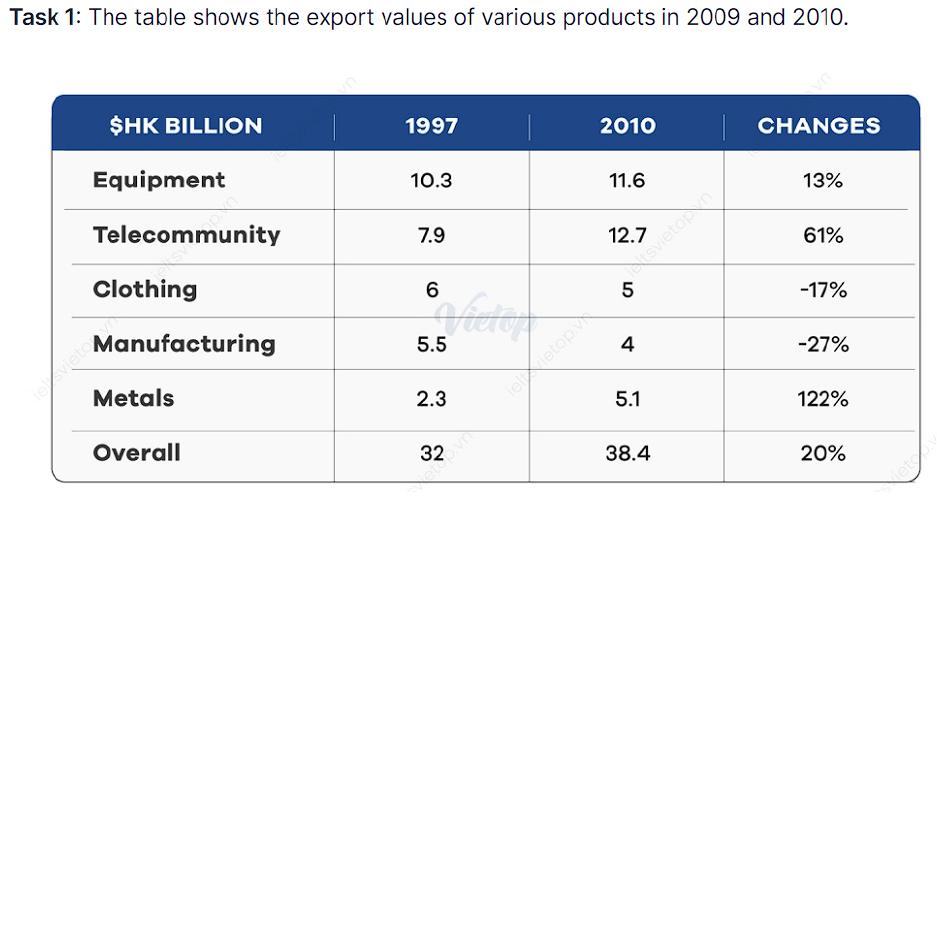
The given table illustrates the amount of money evaluated for 5 different export products in the
years 2009 and 2010.
Overall, the total export values increased steadily in the research period. Another striking point
is that the figure for tele-community products is highest while the opposite is true for
manufacturing products.
In 1997, equipment products hold the first rank in the value of export, with 10.3 HK Billion while
metal products account for the least amount of total value with only 2.3 HK billion. Following the
equipment products are tele-community and clothing, whose values are 7.9 and 6 HK billion,
respectively.
The year 2010 witnessed a growth of about 20% in total export value that reach about 38.4 HK
Billion. Meanwhile, the metals values grow significantly by almost 122% that is followed by tele-
community and equipment, around 61% and 13%, respectively. In addition, the tele-community
has dominated the export values list with 12.7 HK billion while manufacturing products account
for the least amount of export money.
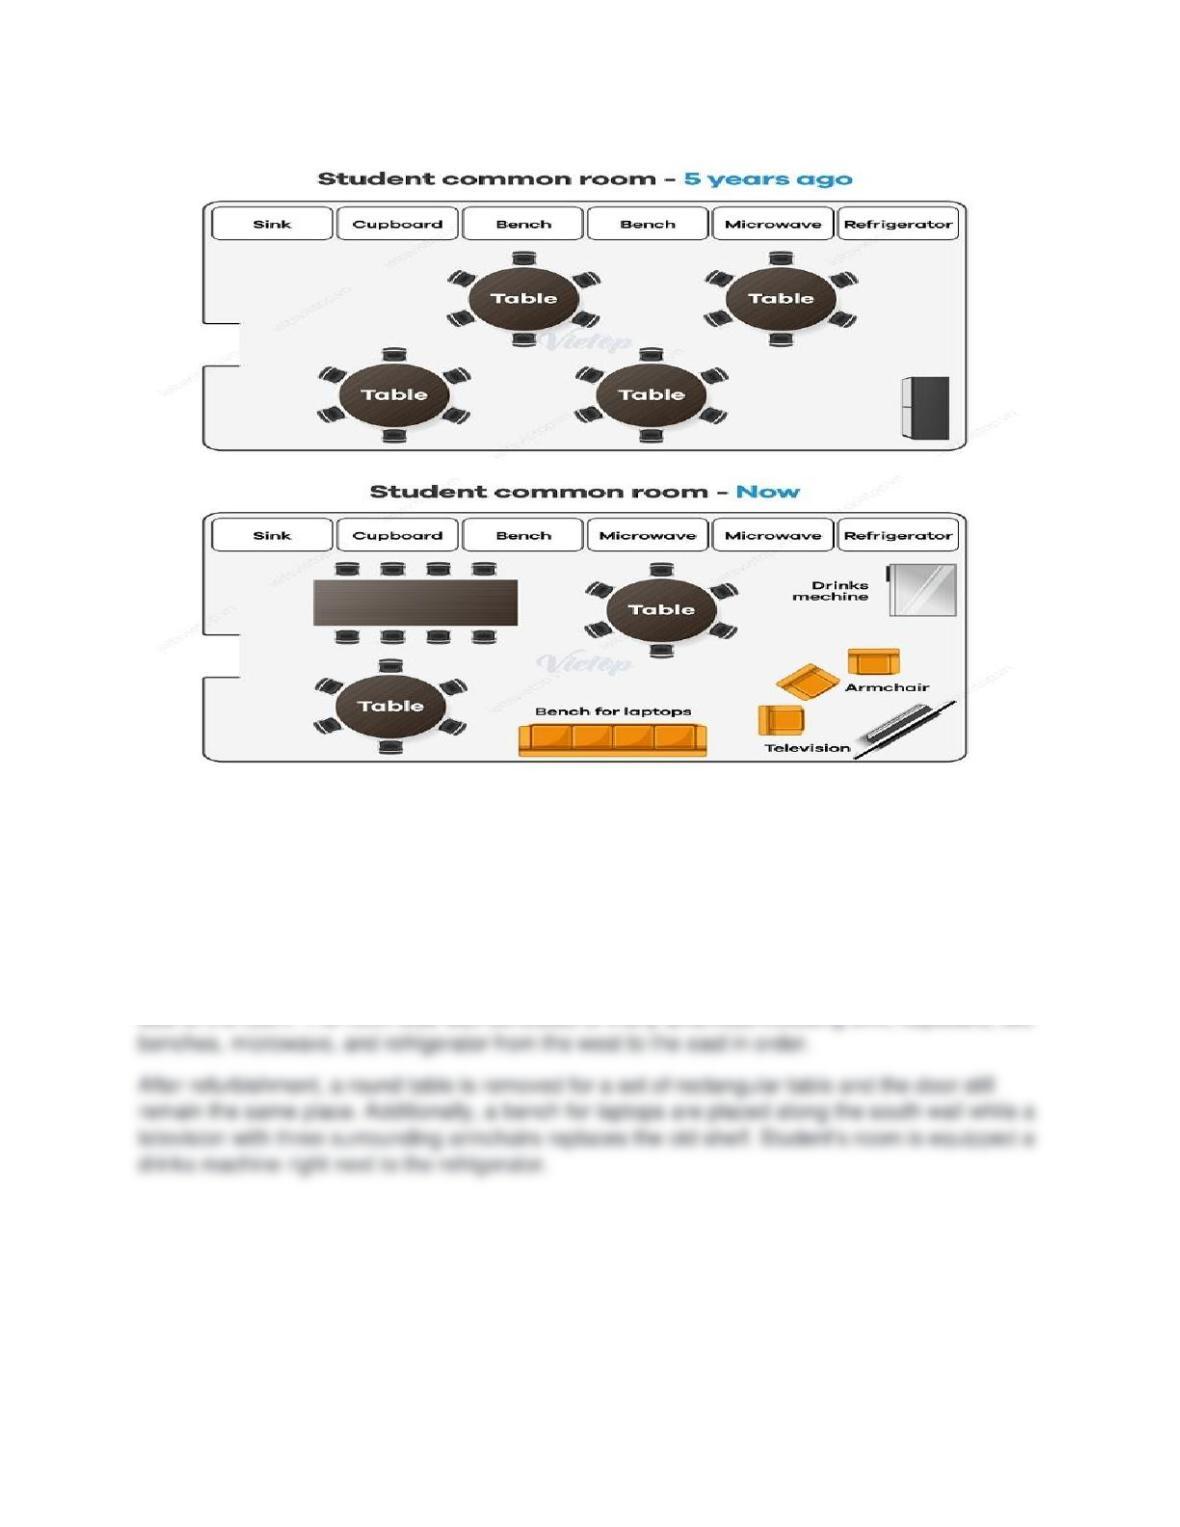
The picture illustrates the shift to a general student room.
Overall, it is obvious that the room has undergone many significant modification including the
addition of some new amenities. Another striking feature is that the old facilities experienced
rearrangement.
In the past 5 year, the student’s room had 4 round tables surrounded by chairs and there was a
shelf which was located at the south east corner. Moreover, the main entrance was at the west