Running head: SHELL OIL GROUP CASE 1
Operations Management Shell Oil Group Case
Prepared for Dr. Jie Yang
Prepared by:
Mario Aguilar
Corrie Bass
Qurat Khan
Randy Munguia
Aaron Portis
November 2, 2014
SHELL OIL GROUP CASE 2
INTRODUCTION
Manufacturing companies can have a multitude of equipment operations in order to
complete a product. For instance, “Oil shale can be mined and processed to generate oil similar
to oil pumped from conventional oil wells; however, extracting oil from oil shale is more
complex than conventional oil recovery and currently is more expensive” (About Oil Shale,
n.d.). The complexity of maintaining 24/7 ongoing operations involves key project management
pieces. In the case of Shale Oil Company’s in Aston, Ohio which has units that operate 24 hours
a day, 7 days a week, maintenance on a predetermined schedule involves program evaluation and
review technique as a method to reduce shutdown time and improve operating efficiencies. By
using the PERT method Shale Oil Company is able to plan, control, and establish phases on each
three year scheduled maintenance and is able to reduce nationwide shortages. Also by
incorporating the PERT method Shale Oil Company is able to answers several questions such as:
determining the expected shutdown time and the probability of how long the shutdown will be.
The probabilities of how many days Shale Oil Company will finish the maintenance project.
Also, if Shale Oil Company considers adjusting the shutdown budget to shorten maintenance
time the company will have ideas of how to proceed. On the Shale Oil Company website under
Who We Are the company states, “The AMSO team is excited about the potential for shale oil to
reduce America’s dependence on foreign oil” (n.d.) These three questions are important
questions Shale Oil Company should take into consideration in order to contribute to the
reduction of America’s dependence on foreign oil. The three questions will be examined and
discussed further throughout the case study. Throughout the case study the three phases of
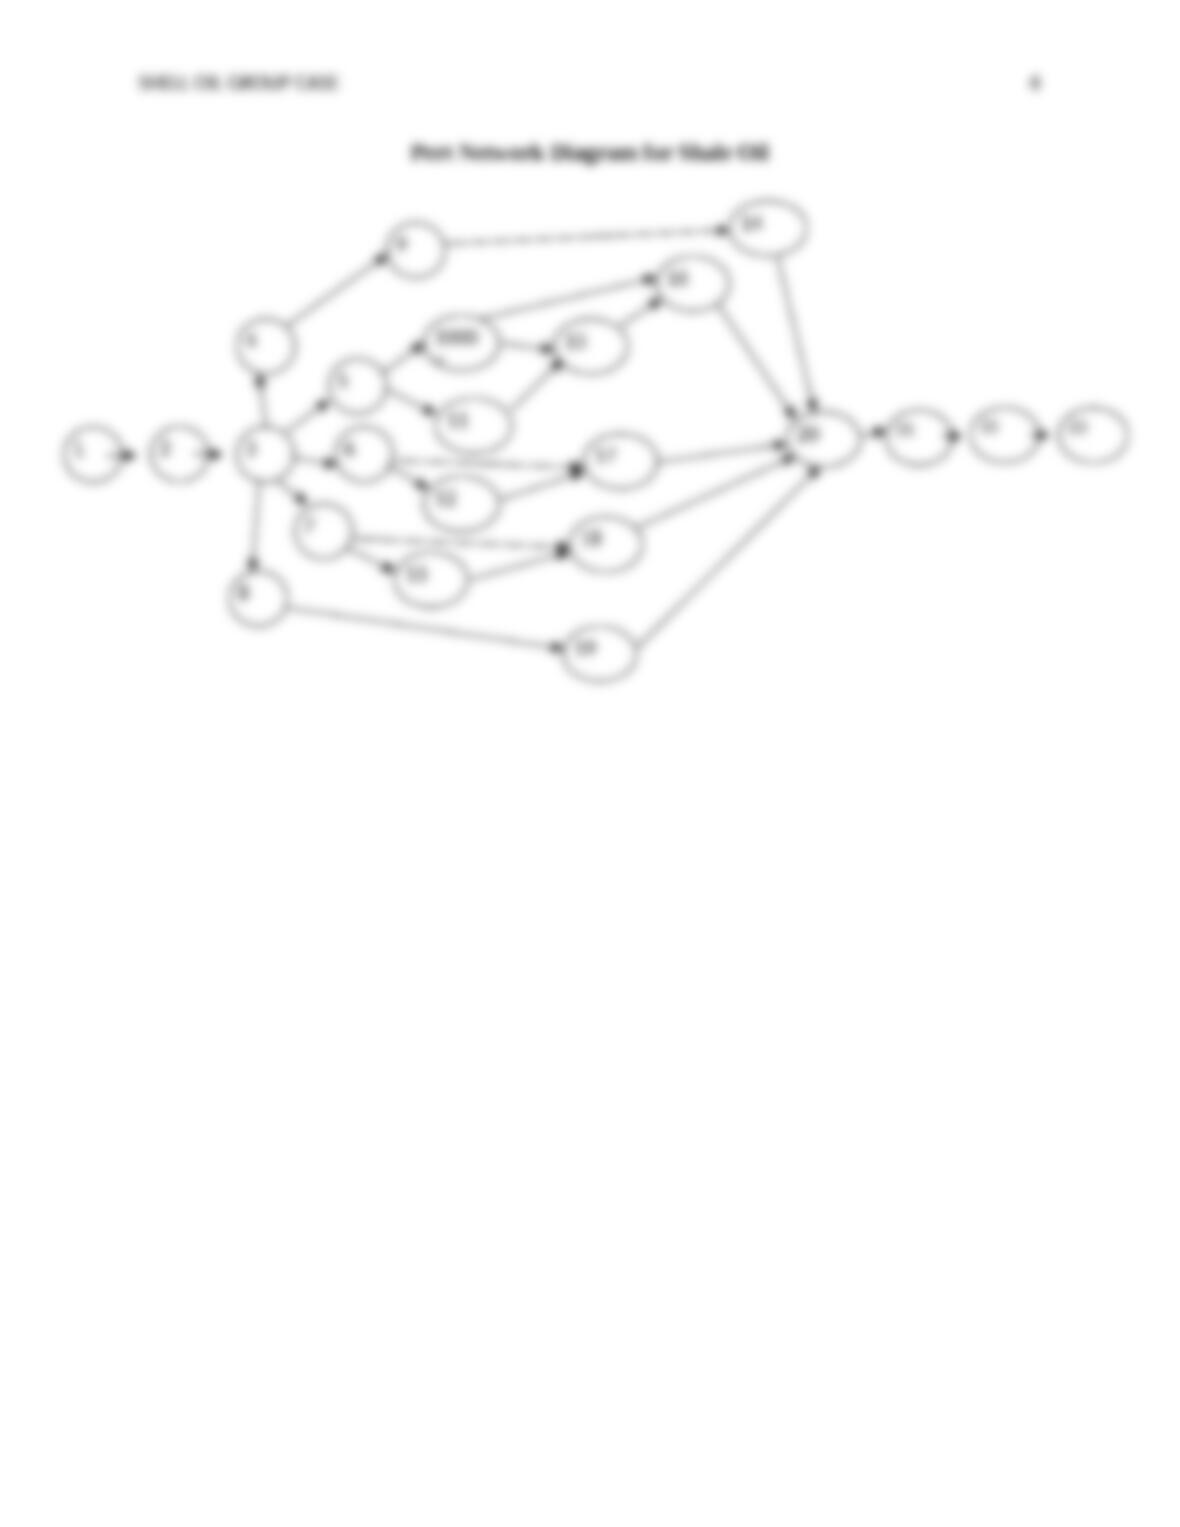
project management will be discussed, PERT/network diagram will be illustrated with all the
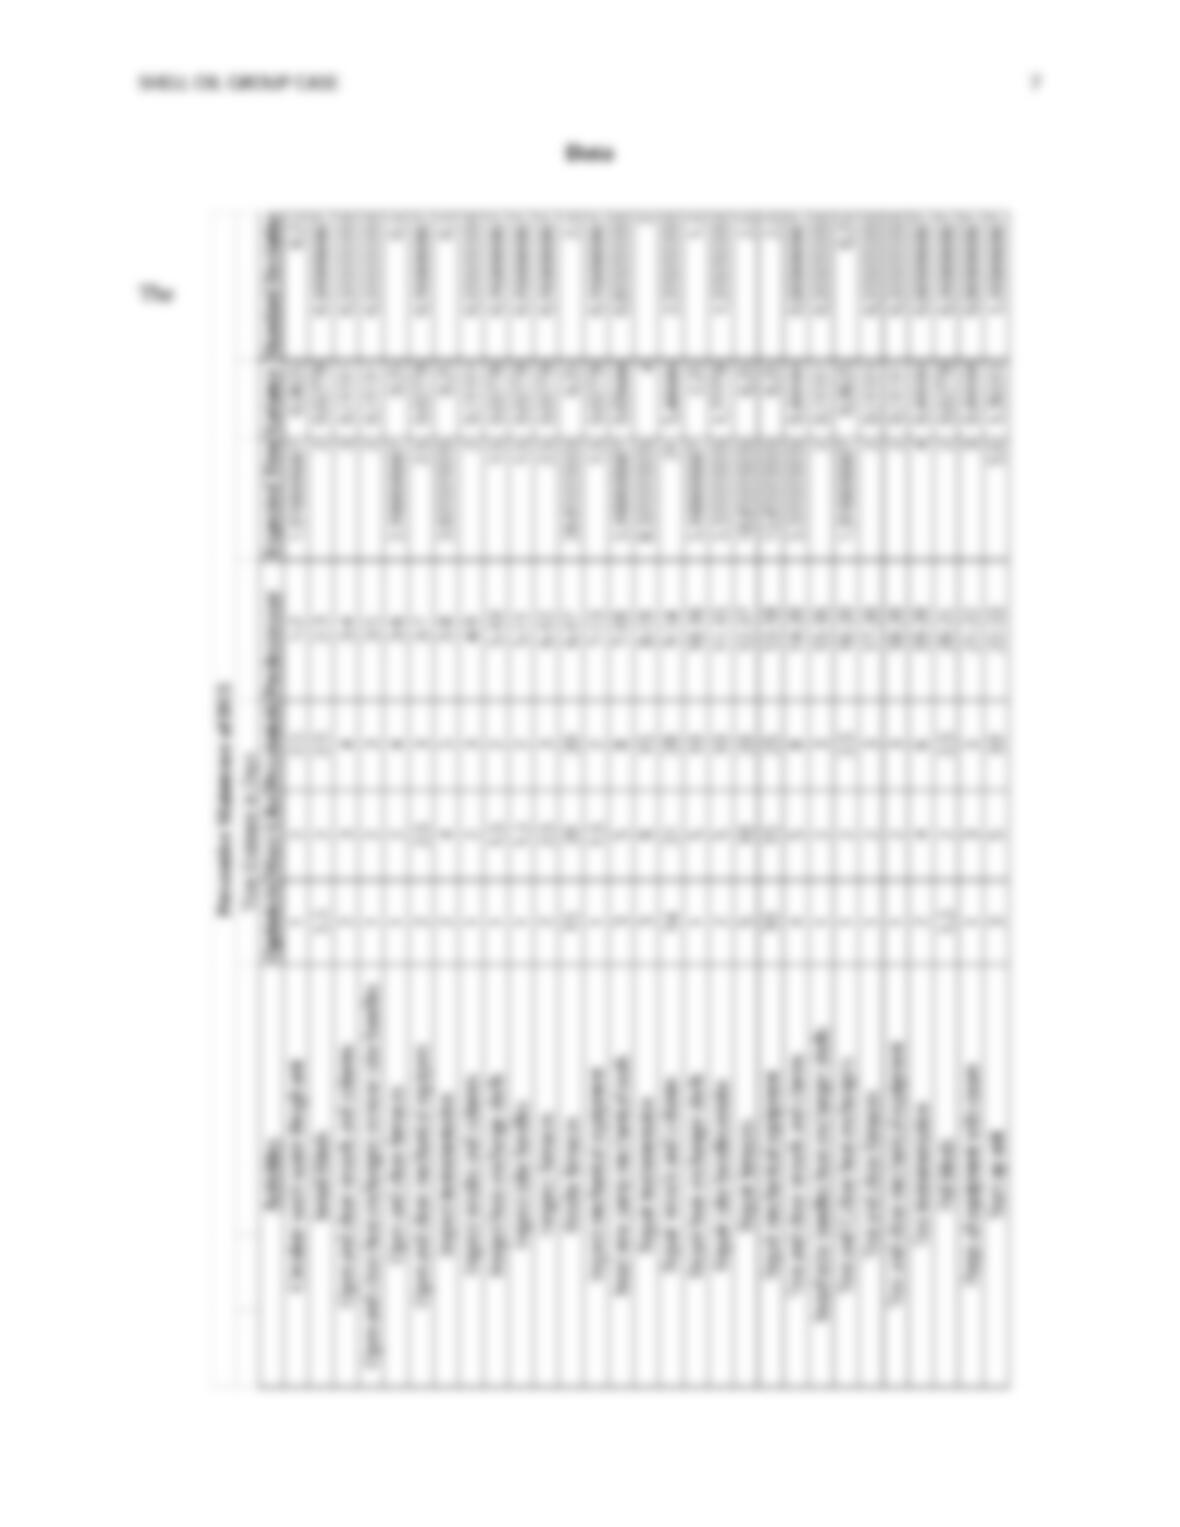
numbers of a project schedule, and a Time illustrating activity time. The overall case study will
SHELL OIL GROUP CASE 3
detail a strategized schedule to improve effectiveness and efficiencies during the scheduled
maintenance.
Project Management
With Shale Oil facing this maintenance issue every 3 years, it brings up the very
importance of project management. Projects such as these have a designated beginning and end
which is determined in the scheduling phase which we will describe below. Unnecessary delays
and cost hindrances have to be taken into account and figured into the project shutdown time
which needs to be kept at a minimum in order to continue service. It is very common for a
project to fall behind schedule or over budget. The complexity of the project itself brings up the
stress and importance of quality project management. The fundamental challenge of project
management is to accomplish all of the project goals and objectives while recognizing the
preconceived constraints such as time, quality and budget. To oversee a project, it is important to
follow certain steps. There are three phases involved in project management. These are:
Planning (goal setting, defining the project, team organization), Scheduling (deciding when the
various activities will be carried out) and Controlling (closely monitoring resources, analyzing
data, investigate any delays, determine solutions, compare the costs of the delays and work out
solutions).
There are three useful approaches that a project manager may use to help in these phases
and these are CPM (Critical Path Method), Gantt Charts, and PERT (Program evaluation and
review technique). Shale uses PERT as a planning and controlling tool to reduce shutdown time.
PERT follows six basic steps:
1. Define the project and prepare the work breakdown structure.

SHELL OIL GROUP CASE 4
2. Develop the relationships among the activities. Decide which activities must precede
and which must follow others.
3. Draw the network connecting all the activities.
4. Assign time and/or cost estimates to each activity.
5. Compute the critical path.
6. Use the network to help plan, schedule, monitor, and control the project.
PERT analysis can easily find the probability of finishing by a certain date. The PERT
diagram makes use of three time estimates for each activity. These are utilized to estimate the
anticipated values and standard deviations for the activity. Graphically, the PERT diagram is
expressed by nodes connected with solid lines. There are two ways of drawing a network