Question 1
First, we need the calculate the average speed in each sample. Then the average mean of the 6
days’ samples is calculated to be 64.53 kph [(64.8+64.8+65+64.8+64.2+63.6)/6]. The
population standard deviation is 4.01. The chart shows below:
Day
AverageSpeed(kph)
Range
1
70 60 61 69 64 64.8 10
2
64 71 60 69 60 64.8 11
3
61 64 72 65 63 65.0 11
4
69 68 65 62 60 64.8 9
5
58 68 65 68 62 64.2 10
6
60 59 70 67 62 63.6 11
Theaveragemeanofthe6dayssamples=
64.533
AverageRange 10.333
Speedofcars(kph)
OriginalSamples
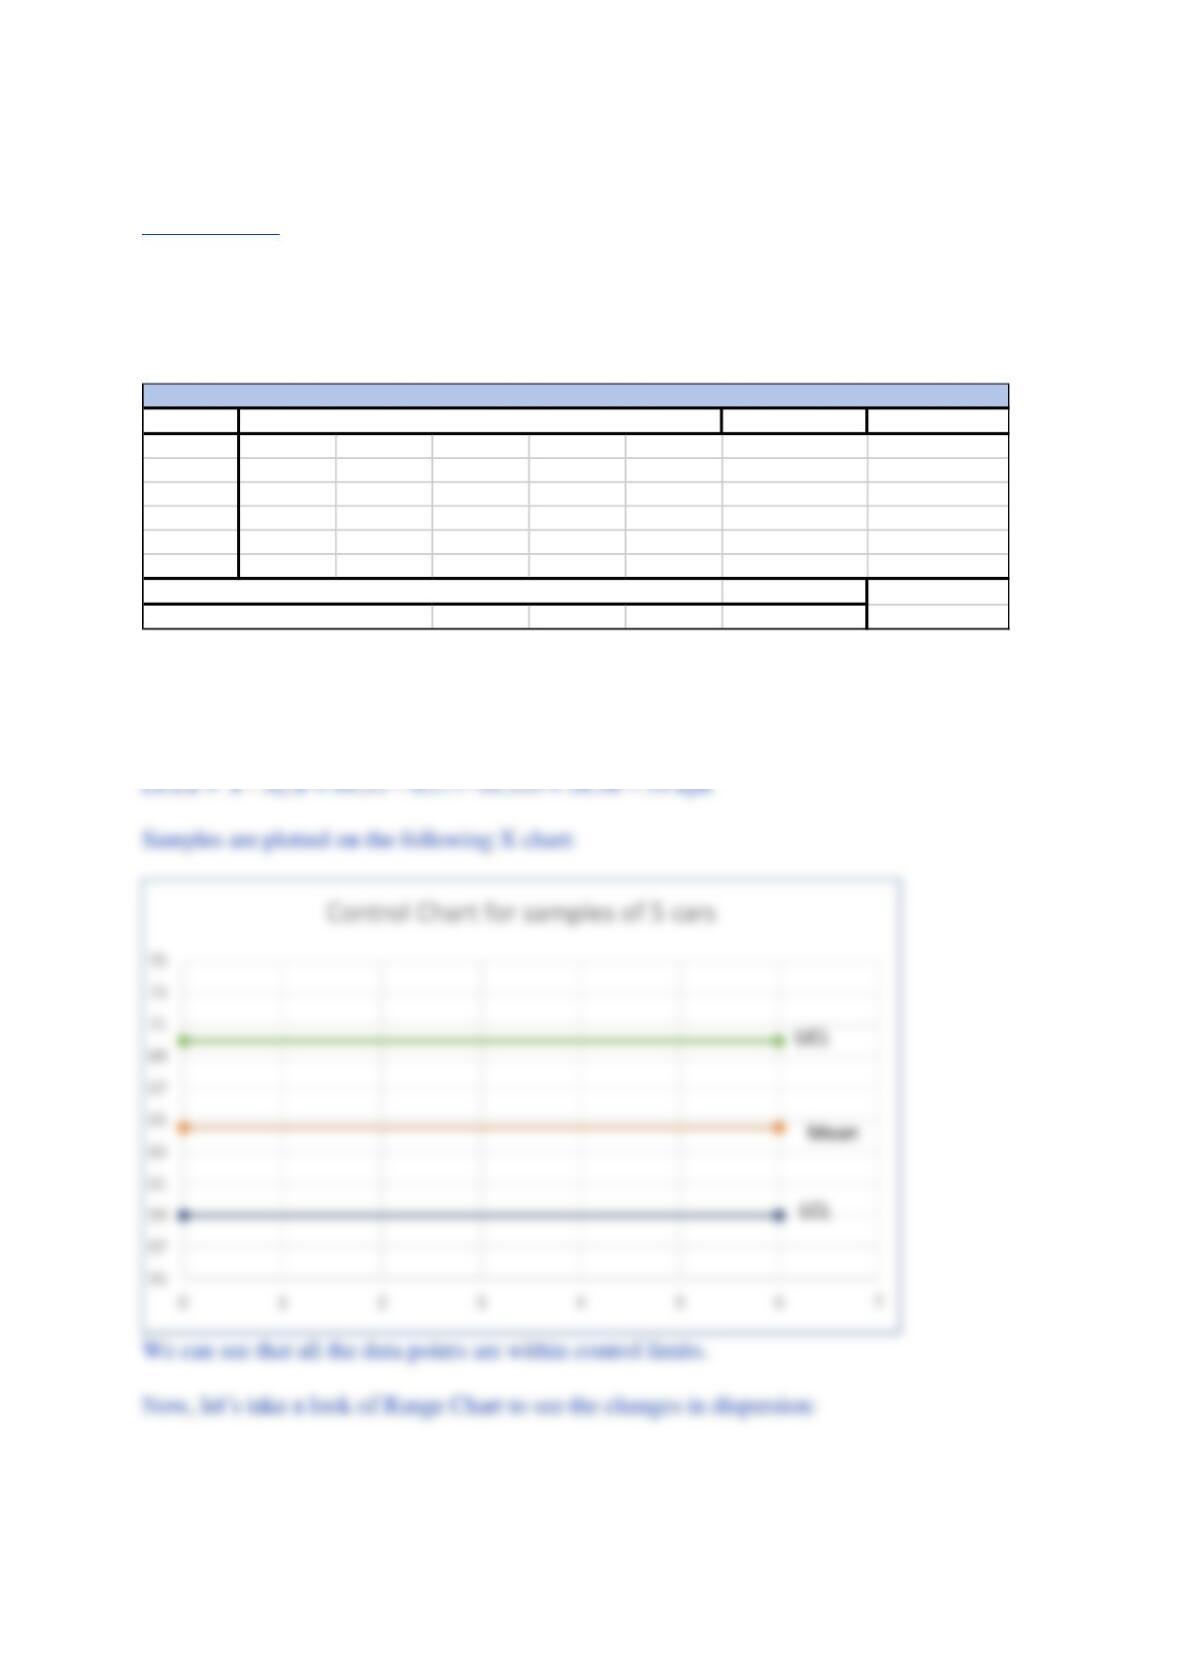
Therefore, 𝑥̿ = 64.53 kph, n = 5 and z=3. from text book page 212 Table S6.1 we can see the
A2=0.577, 𝑅
̅ = 10.33
UCLx̅ = 𝑥̿ + A2 𝑅
̅ = 64.53 + 0.577*10.333= 70.49 ≈ 70 kph