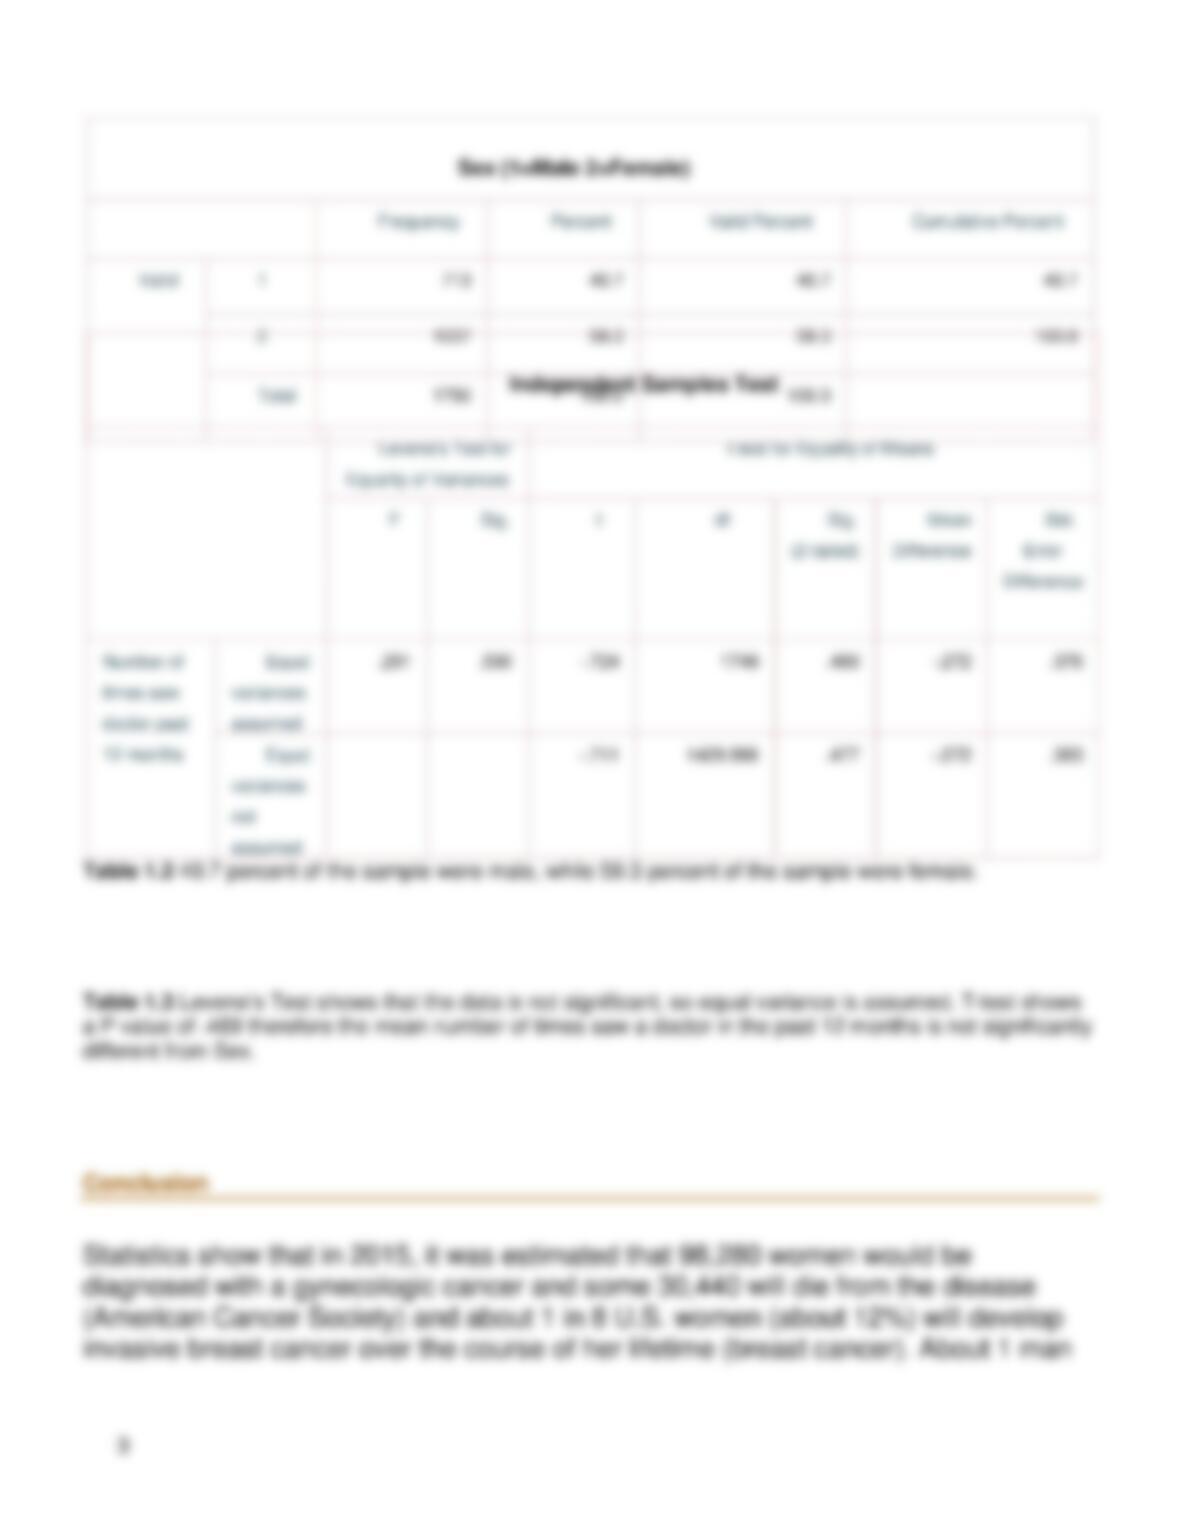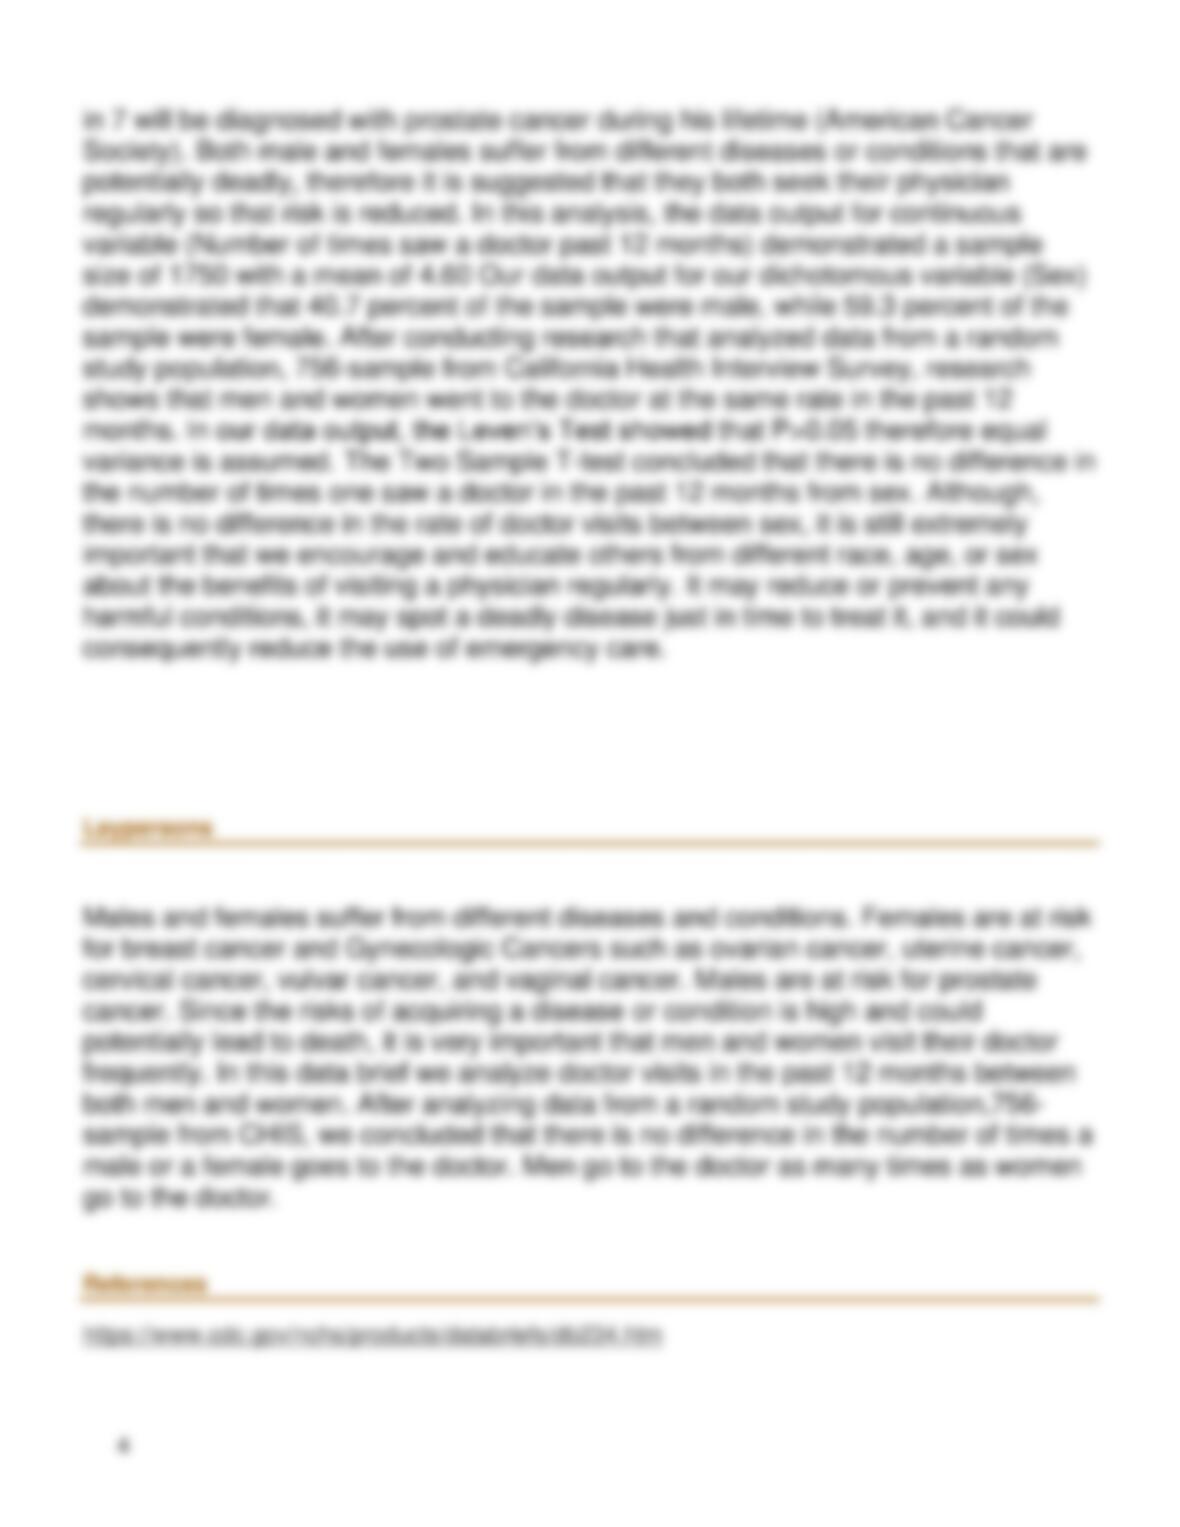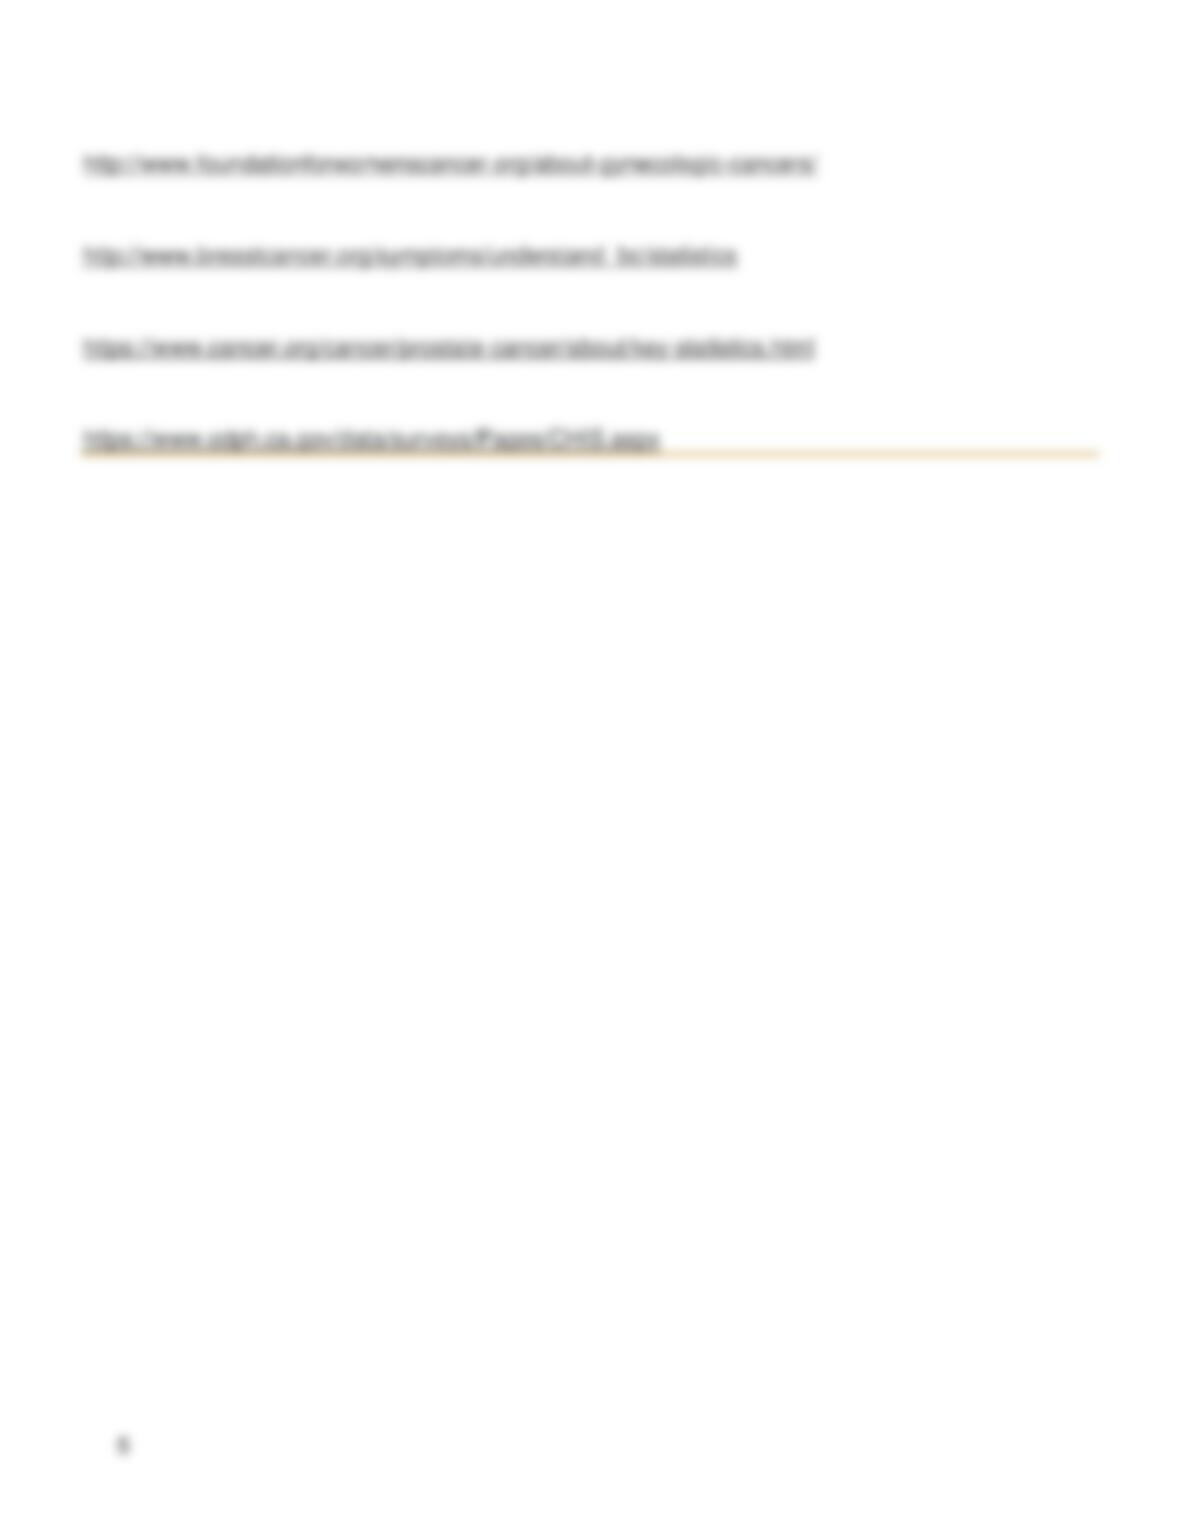
Doctor Visits in The Past 12 Months, by Sex
Consuelo Reyes, College of Health Science and Human Ecology, California State University, San Bernardino, 5500
University Parkway
Contact: 0049406098@coyote.csusb.edu
Frequent doctor visits allow for preventative care, which include medical
examination, screening for disease or any medical condition, and lifelong education
to promote healthy behaviors. In this report, the rate of doctor visits in the past 12
months is examined by sex. Health issues women are at risk for include Gynecologic
Cancers. In 2015, it was estimated that 98,280 women would be diagnosed with a
gynecologic cancer and some 30,440 will die from the disease (American Cancer
Society). All women are also at risk for breast cancer. About 1 in 8 U.S. women
(about 12%) will develop invasive breast cancer over the course of her lifetime
(breast cancer). Men are all at risk for developing prostate cancer. About 1 man in 7
will be diagnosed with prostate cancer during his lifetime (American Cancer Society).
Women and men both experience unique health issues and conditions, therefore it is
important that both get examined regularly for early diagnosis and treatment.
Methods
This Analysis used Data from a random study population, 756-sample from
California Health Interview Survey. CHIS Collects information on California’s health
status. It provides health surveys and is a great source of data on Health conditions
and behaviors. CHIS covers varies topics that focus on population health.
Continuous data (Average number of times saw a doctor in past 12 months) for this
analysis was measured by count. Dichotomous data (Sex) was measured by male
and female.
Analysis
Software used for this analysis SPSS version 24
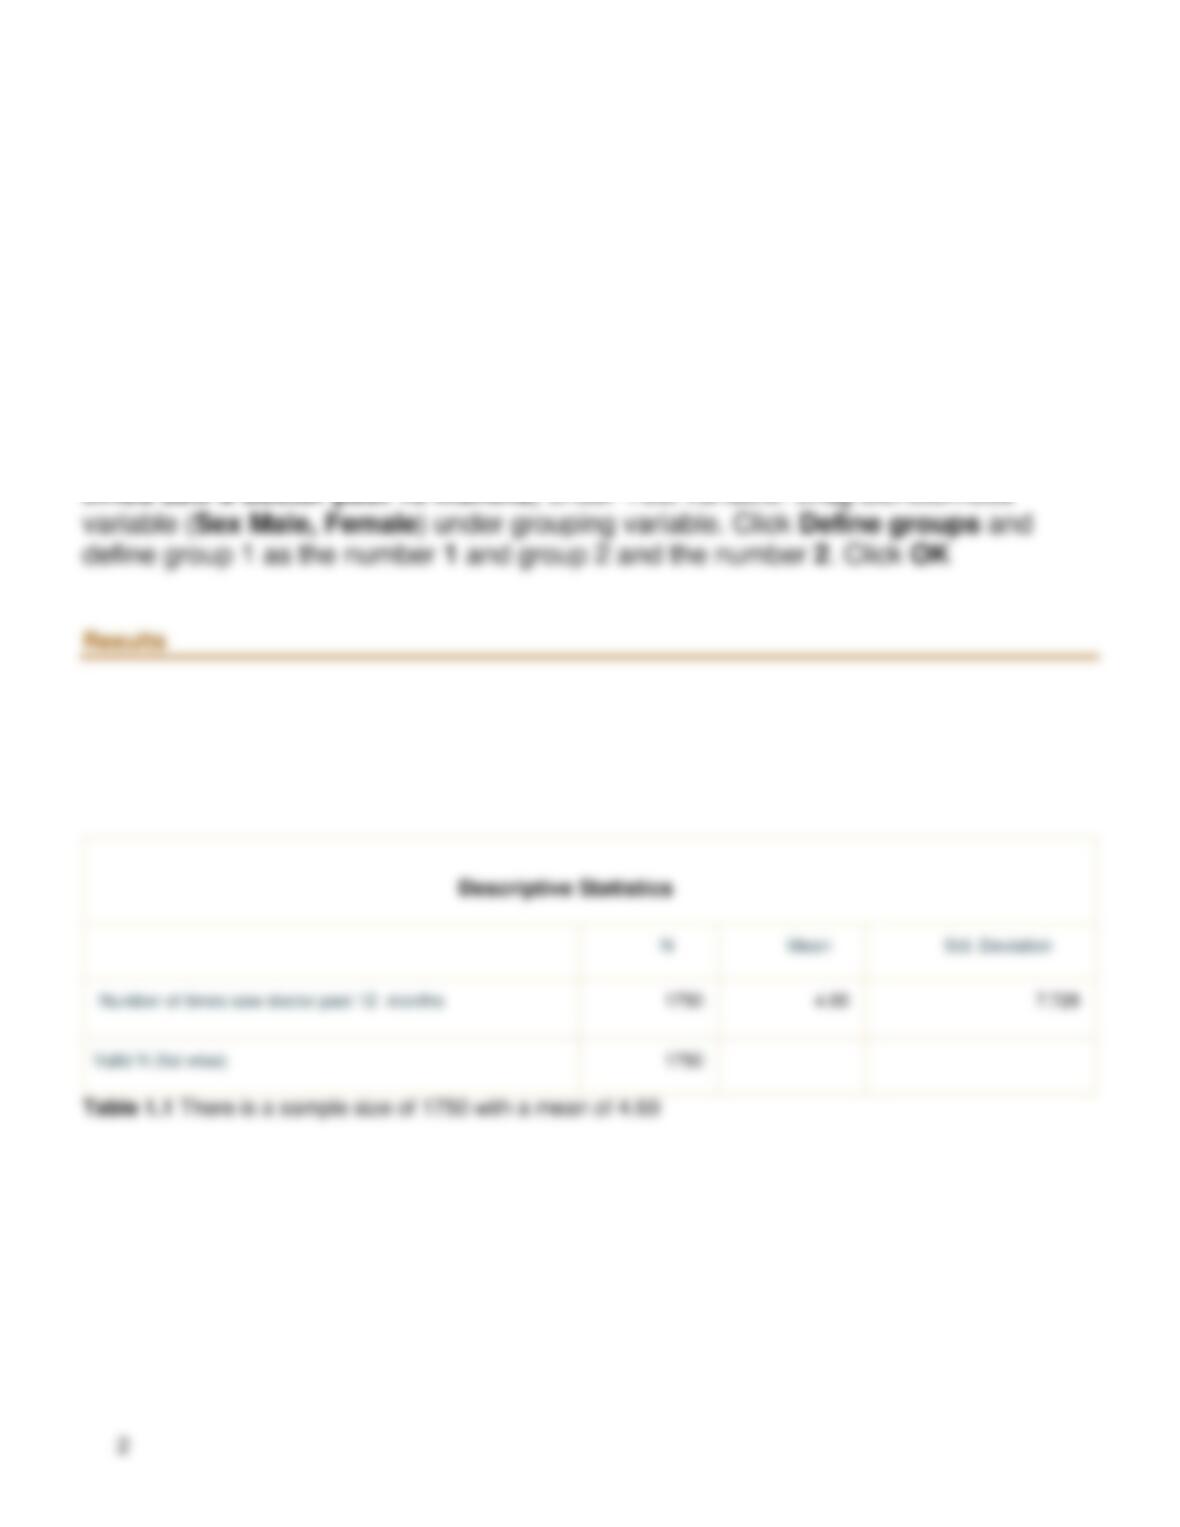
Summary statistics for continuous variable. Click on analysis, then click on
summary statistics, finally click on descriptive. Add continuous variable (Average
number of times saw a doctor past 12 months) click on, options and select the
desired statistics, Mean and Standard Deviation. Click continue and OK.
Summary statistics for dichotomous variable. Click on analysis, then click on
descriptive statistics, select frequencies and add dichotomous variable (Sex
Male, Female). If desired, select charts. Click on continue and OK to run the
results.
Bivariate analysis using two sample T-test. Click on analysis and compare means.
Select Independent Sample T test. Drag continuous variable (Average number of