nPlug: A Smart Plug for Alleviating Peak Loads
Tanuja Ganu
IBM Research, India
Deva P. Seetharam
IBM Research, India
Vijay Arya
IBM Research, India
Rajesh Kunnath
Radio Studio, India
Jagabondhu Hazra
IBM Research, India
Saiful A. Husain
Universiti Brunei Darussalam
Liyanage Chandratilake
De Silva
Universiti Brunei Darussalam
Shivkumar
Kalyanaraman
IBM Research, India
ABSTRACT
The Indian electricity sector, despite having the world’s fifth
largest installed capacity, suffers from a 12.9% peaking short-
age. This shortage could be alleviated, if a large number of
deferrable loads, particularly the high powered ones, could
be moved from on-peak to off-peak times. However, con-
ventional DSM strategies may not be suitable for India as
the local conditions usually favor only inexpensive solutions
with minimal dependence on the pre-existing infrastructure.
In this work, we present nPlug, a smart plug that sits be-
tween the wall socket and deferrable loads such as water
heaters, washing machines, and electric vehicles. nPlugs
combine real-time sensing and analytics to infer peak pe-
riods as well as supply-demand imbalance and reschedule
attached appliances in a decentralized manner to alleviate
peaks whenever possible. They do not require any manual
intervention by the end consumer nor any enhancements to
the appliances or existing infrastructure. Some of nPlug’s
capabilities are demonstrated using experiments on a com-
bination of synthetic and real data collected from plug-level
energy monitors. Our results indicate that nPlug can be an
effective and inexpensive technology to address the peaking
shortage.
Categories and Subject Descriptors
B.m [Hardware]: Miscellaneous; E.4 [Data]: Coding And
Information Theory; F.m [Theory of Computation]: Mis-
cellaneous; I.6 [Computing Methodologies]: Simulation
And Modeling
General Terms
Algorithms, Design, Experimentation
Keywords
Smart Plug, Demand Response, Demand Side Management,
Peak Loads, Scheduling, Multiple Access
Permission to make digital or hard copies of all or part of this work for
personal or classroom use is granted without fee provided that copies are
not made or distributed for profit or commercial advantage and that copies
bear this notice and the full citation on the first page. To copy otherwise, to
republish, to post on servers or to redistribute to lists, requires prior specific
permission and/or a fee.
e-Energy 2012, May 9-11 2012, Madrid, Spain.
Copyright 2012 ACM 978-1-4503-1055-0/12/05 …$10.00.
1. INTRODUCTION
As of November 2011, the Indian electricity sector, despite
having the world’s fifth largest installed capacity of 185.5
GW, suffers from a 12.9% peaking shortage [7]. The situa-
tion could worsen with the current trends in population and
income growth, industrialization, and urbanization. Elec-
tricity consumption is expected to increase substantially in
the coming decades as well [10].
Considering that electricity cannot easily be stored in large
scale, peak shortage can be alleviated by increasing supply
or by reducing demand. Supply can be increased through
the use of“peaker”power plants that operate on fast-starting
fuels such as diesel or open-cycle gas/hydro turbines. Peaker
plants operate only during the peak, for a small fraction of
time, so their electricity is inherently expensive. It is es-
timated that if India were to add peakers to the existing
generation portfolio, the average supply cost might increase
by over 35% [19].
Clearly, there is a significant role and potential for demand
side management (DSM) programmes in India. The Gov-
ernment of India, through new Energy Conservation legisla-
tion, is also seeking to implement a host of such programmes
within the country [13]. However, conventional DSM strate-
gies may not be suitable for India as the local conditions
usually favor only inexpensive solutions with minimal de-
pendence on the pre-existing infrastructure [20]. One of the
disadvantages of existing DSM strategies such as direct load
control is their centralized nature which requires communi-
cation between appliance-level monitors and a central con-
troller at the utility. Since monitors require communication
capabilities, it increases their cost. More importantly, this
requires a communication infrastructure between the utility
and appliances which is expensive to deploy. Although cel-
lular communication is inexpensive in India, existing infras-
tructure will need a capacity upgrade to support household
appliances as well. An Internet based solution may not be
widely applicable as only 11.3% of Indian households have
access to Internet [9].
In this paper, we present a decentralized DSM system
based on smart plugs called nPlugs that “sit” between de-
ferrable loads and wall sockets. An nPlug senses line volt-
age and frequency to infer the load level and supply-demand
imbalance in the grid respectively. It processes the sensed
data using simple data mining algorithms to identify the
peak and off-peak periods of the grid. It runs the attached
load(s) during off-peak periods as much as possible without
violating user-specified constraints. To ensure grid and ap-
pliance safety, it avoids scheduling appliances during periods
of supply-demand imbalance. Furthermore each nPlug runs
a decentralized load rescheduling algorithm that contributes
to peak load reduction by distributing the loads over time.
The key contributions of this paper are:
•Design of a low-cost standalone smart plug that can
schedule appliances during off-peak periods. It nei-
ther requires any communication infrastructure nor
any changes to the appliance or grid. It can work with
common deferrable loads such as water heaters, wash-
ing machines, and electric vehicles.
•Design of simple and effective data mining algorithms
to determine peak and off-peak periods as well as sup-
ply demand imbalance, that can run on low-cost mi-
crocontrollers.
•Design of novel decentralized load scheduling algorithms
that contribute to peak load reduction and load-leveling
by spreading the joint load efficiently under varying
grid load conditions.
•Experimental evaluation of above-mentioned algorithms.
The rest of the paper is organized as follows. Section 2
presents the theoretical basis for inferring grid load and
supply-demand imbalance by sensing line voltage and fre-
quency. The details of nPlug hardware design is described in
Section 3. The data mining algorithms used to identify peak
and off-peak periods as well as load scheduling algorithms
used by nPlugs are presented in section 4. Experimental
evaluation of our algorithms is presented in Section 5. Sec-
tion 6 presents related work and finally section 7 concludes
with a discussion about future work.
2. POWER SYSTEMS BACKGROUND
This section uses the power systems theory to explain why
the line voltage and frequency measured in a household can
serve as good indicators of grid load and supply-demand
imbalance respectively.
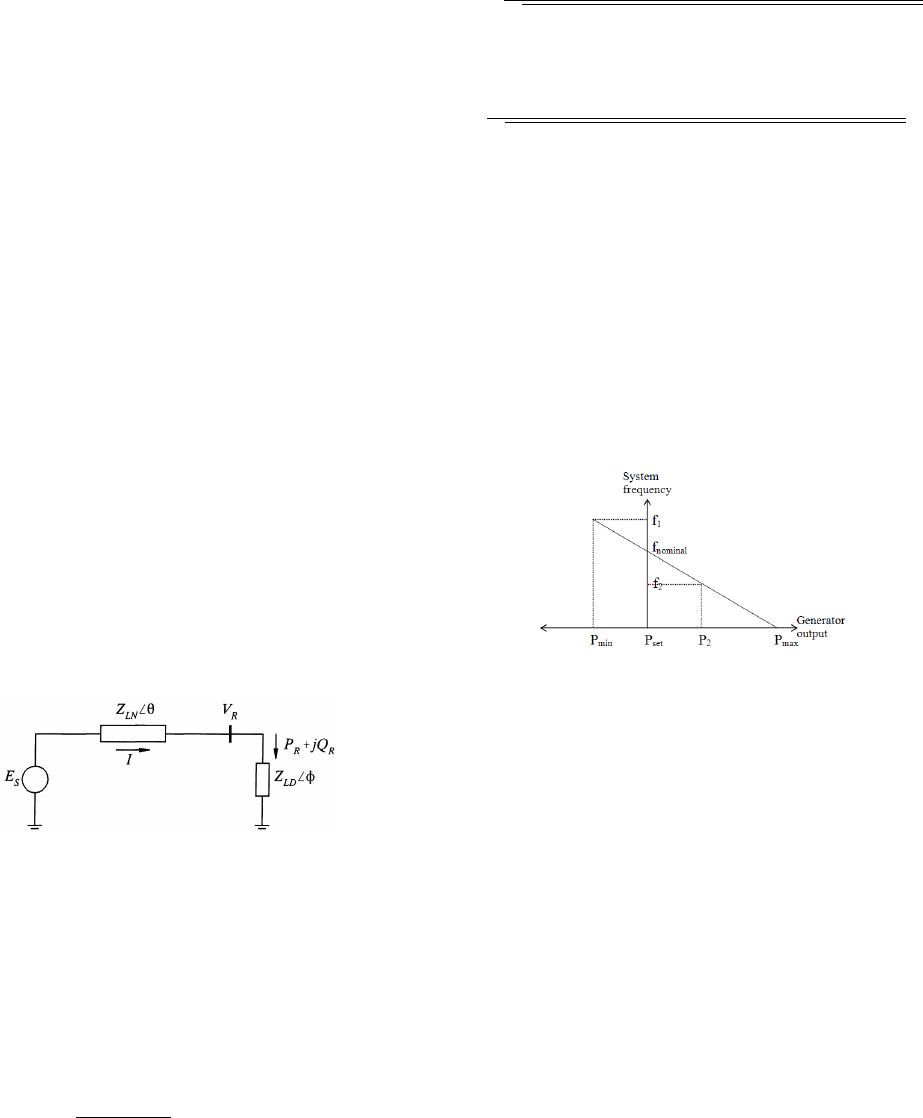
Figure 1: A two-bus power system
2.1 Inferring grid load from voltage
Figure 1 shows a simple “power system” wherein a load
is connected to a generator using a transmission line. ˜
ES
is the generator voltage, ˜
VRis the load voltage, ˜
ZLN is the
transmission line impedance, and ˜
ZLD is the load impedance
(all quantities are vectors). We will now see how the magni-
tude of load voltage VRdecreases with increasing load. The
current flowing through the line and load, ˜
Iis given by
˜
I=˜
Es
˜
ZLN +˜
ZLD
where ˜
ZLN =ZLN ∠θ=ZLN cosθ +jZLN sinθ
˜
ZLD =ZLD∠φ=ZLDcosφ +jZLD sinφ
Here θis phase angle between reactive and resistive com-
ponents of the line impedance while φis the phase angle
between the load current and voltage. Now the magnitude
of current Iis given by
I=ES
p(ZLN cosθ +ZLDcosφ)2+ (ZLN sinθ +ZLDsinφ)2
Therefore the magnitude of load voltage VRis:
VR=ZLD ×I
=ZLD ×ES
p(ZLN cosθ +ZLDcosφ)2+ (ZLN sinθ +ZLDsinφ)2
(1)
Since the source voltage ESand transmission line impe-
dance ZLN ∠θare generally constant, the load voltage VR
is essentially a function of the magnitude of load impedance
ZLD and the power factor cos φ. To minimize reactive power
consumption, appliances are usually designed to have high
power factor (0.9 to 1). Thus from Eq.(1) we see that the
load voltage VRis dominated by the magnitude of load
impedance ZLD . As the load increases (i.e. impedance
decreases), the load voltage VRdecreases and vice versa.
Therefore as the collective load on the grid increases, the
corresponding voltage drop can be sensed at households. In
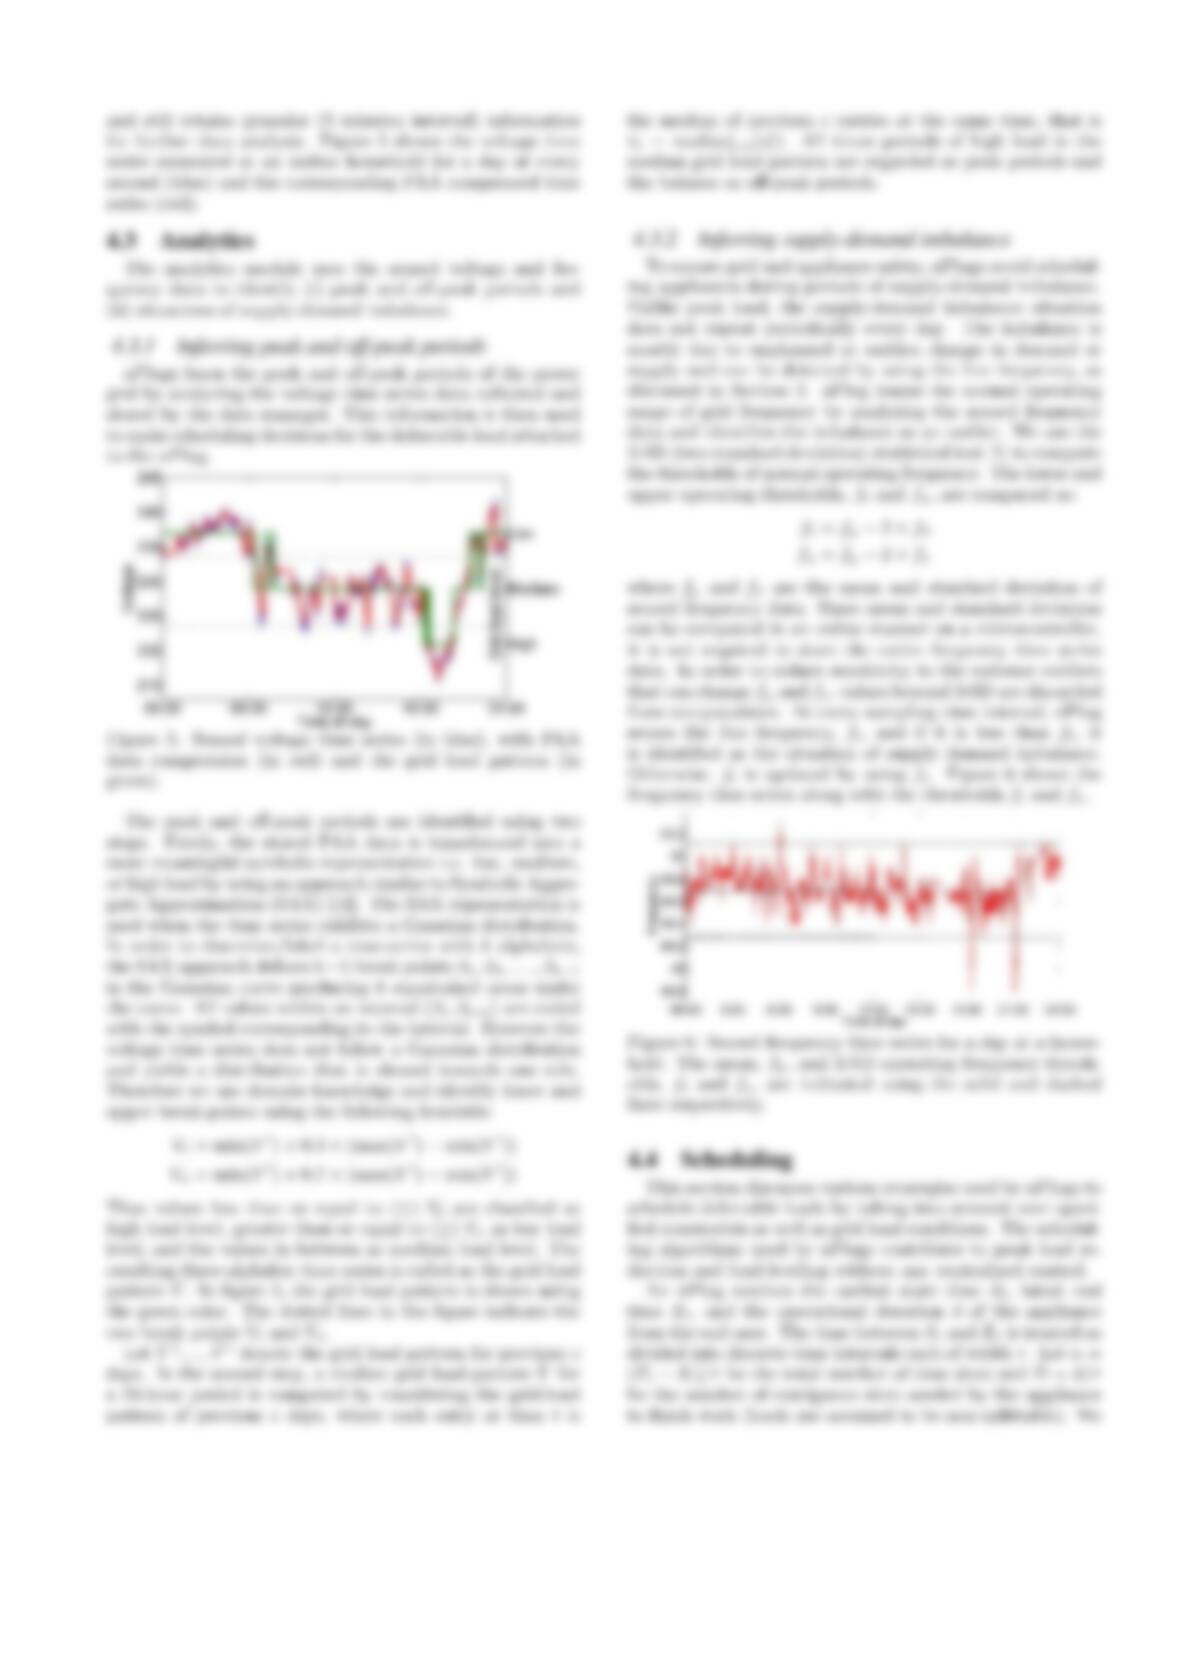
section 5, we shall plot the variation in voltage VRmeasured
at a household and show how it drops during peak hours.
Figure 2: Load-frequency control characteristics
2.2 Detecting supply-demand imbalance from
frequency
Conventionally, the grid frequency is regarded as an indi-
cator of imbalance between generation and demand. During
imbalance, the output of each generator is automatically
adjusted to meet the demand. This changes the system fre-
quency according to the load-frequency characteristics of the
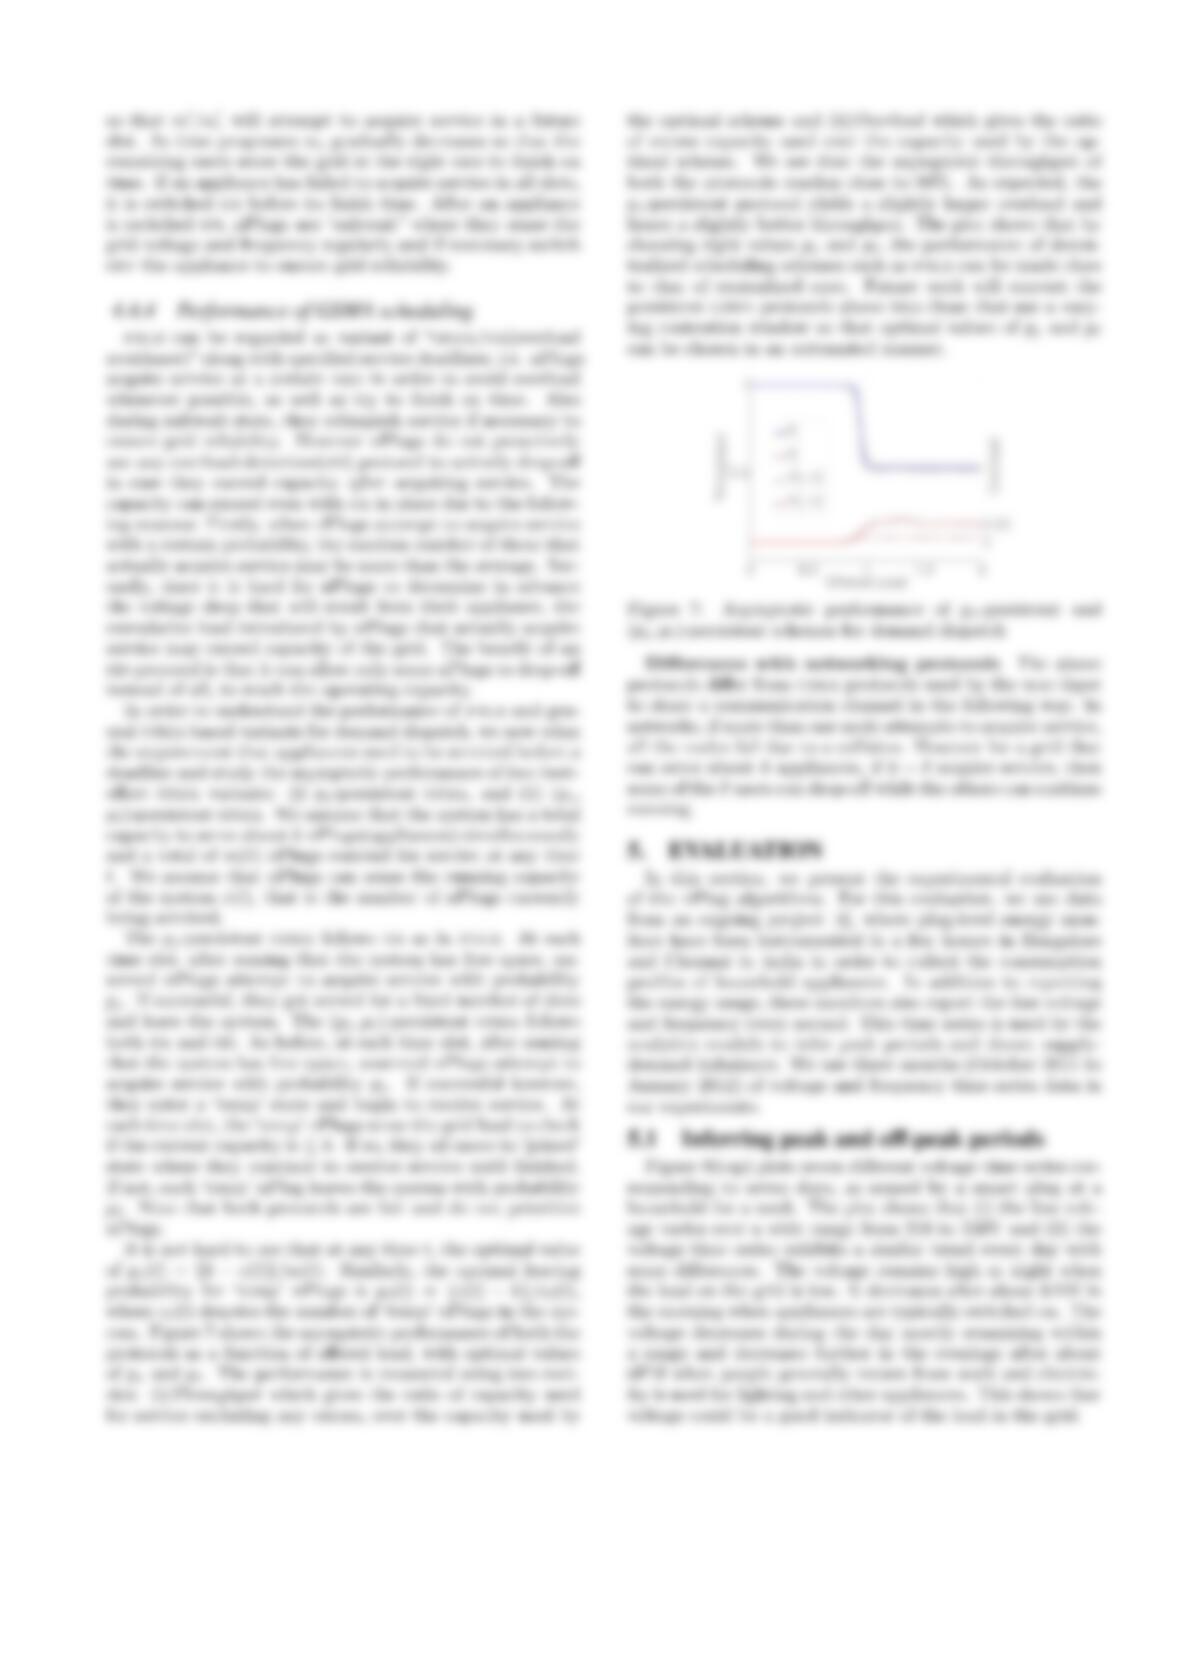
generators as shown in Figure 2. The plot shows that when
the generation is higher than Pset (the generation needed to
support a fixed load), the frequency drops. On the other
hand, if it is less than Pset, the frequency shoots up.
Although frequency is a good indicator of imbalance, our
measurements show that it varies continuously and may not
be sufficient to identify grid load accurately. One possible
reason for this is that in anticipation of increased demand,
the generation is ramped up to keep the frequency close
to nominal levels. Even though the power systems theory
explained in this section is well-known, to the best of our
knowledge, none of the existing systems learn the voltage
and frequency patterns to derive load schedules that can
help reduce peak loads.
3. NPLUG HARDWARE DESIGN
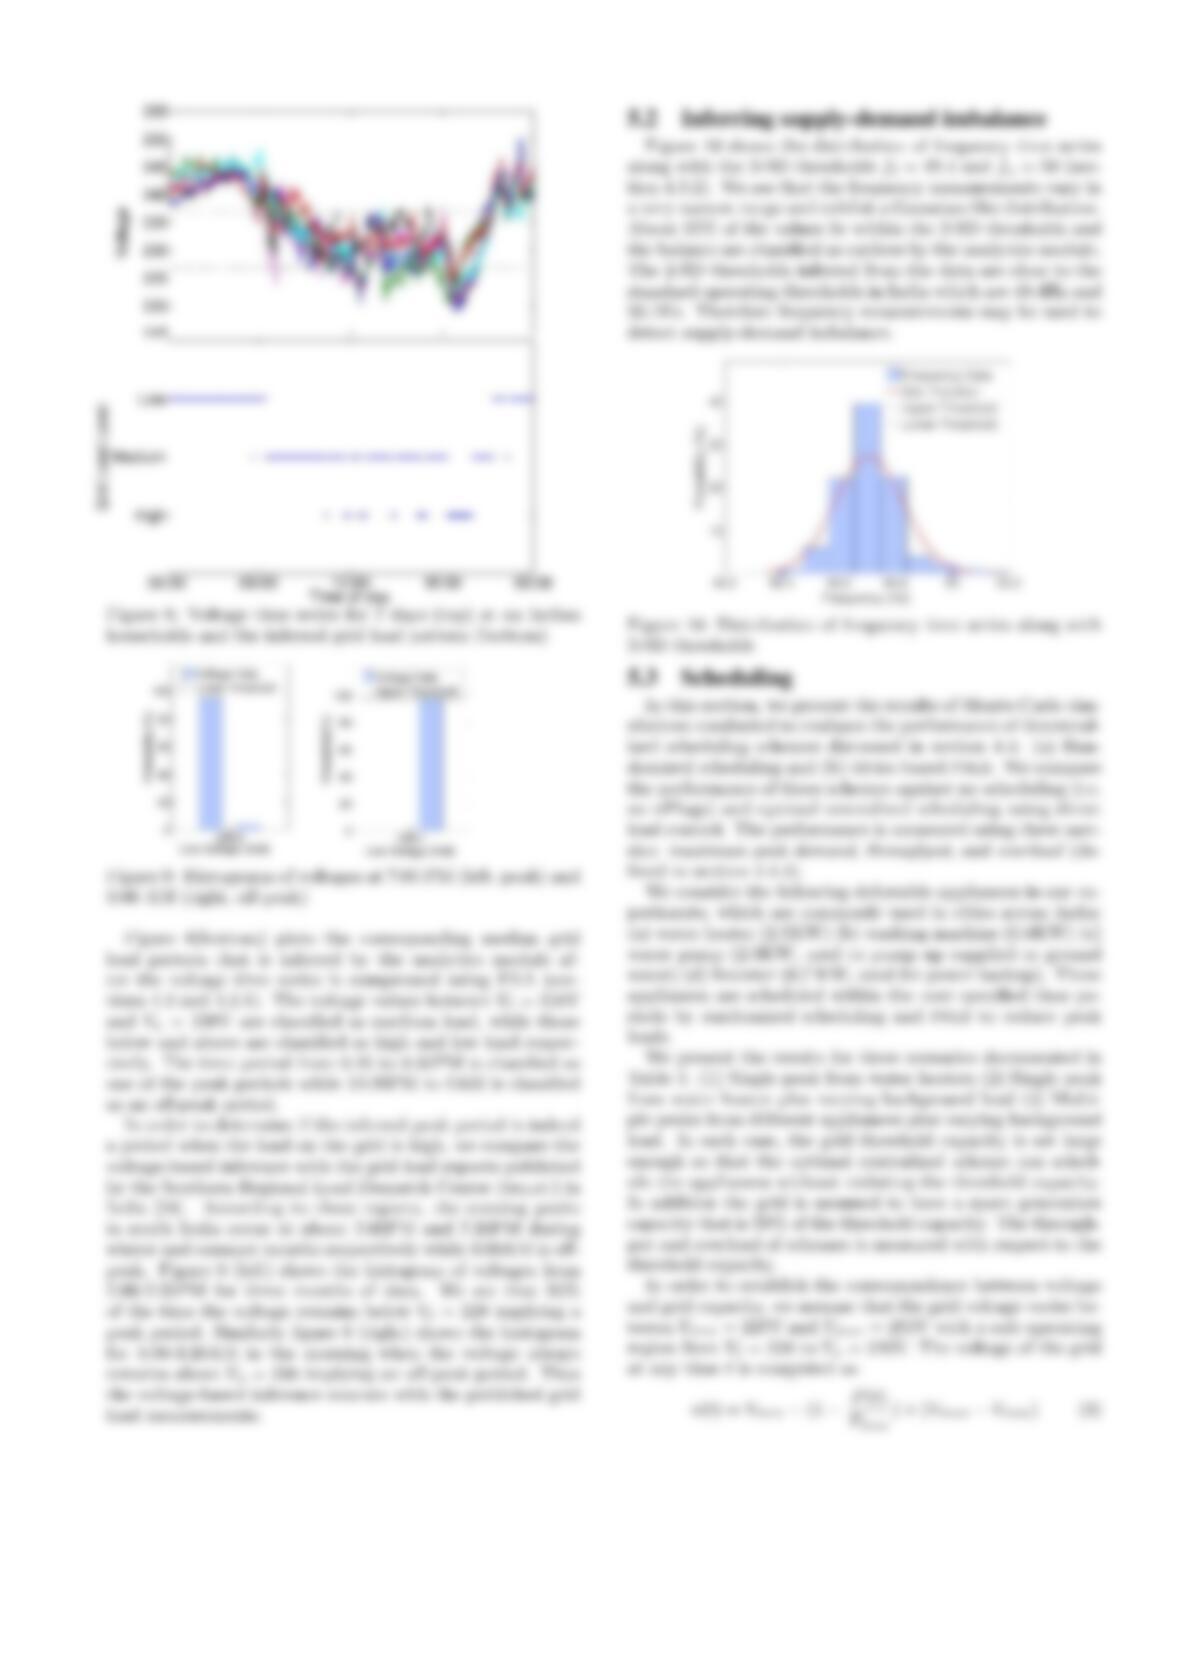
Figure 3 shows an initial prototype of nPlug. The hard-
ware design is based on cost-performance trade-offs.
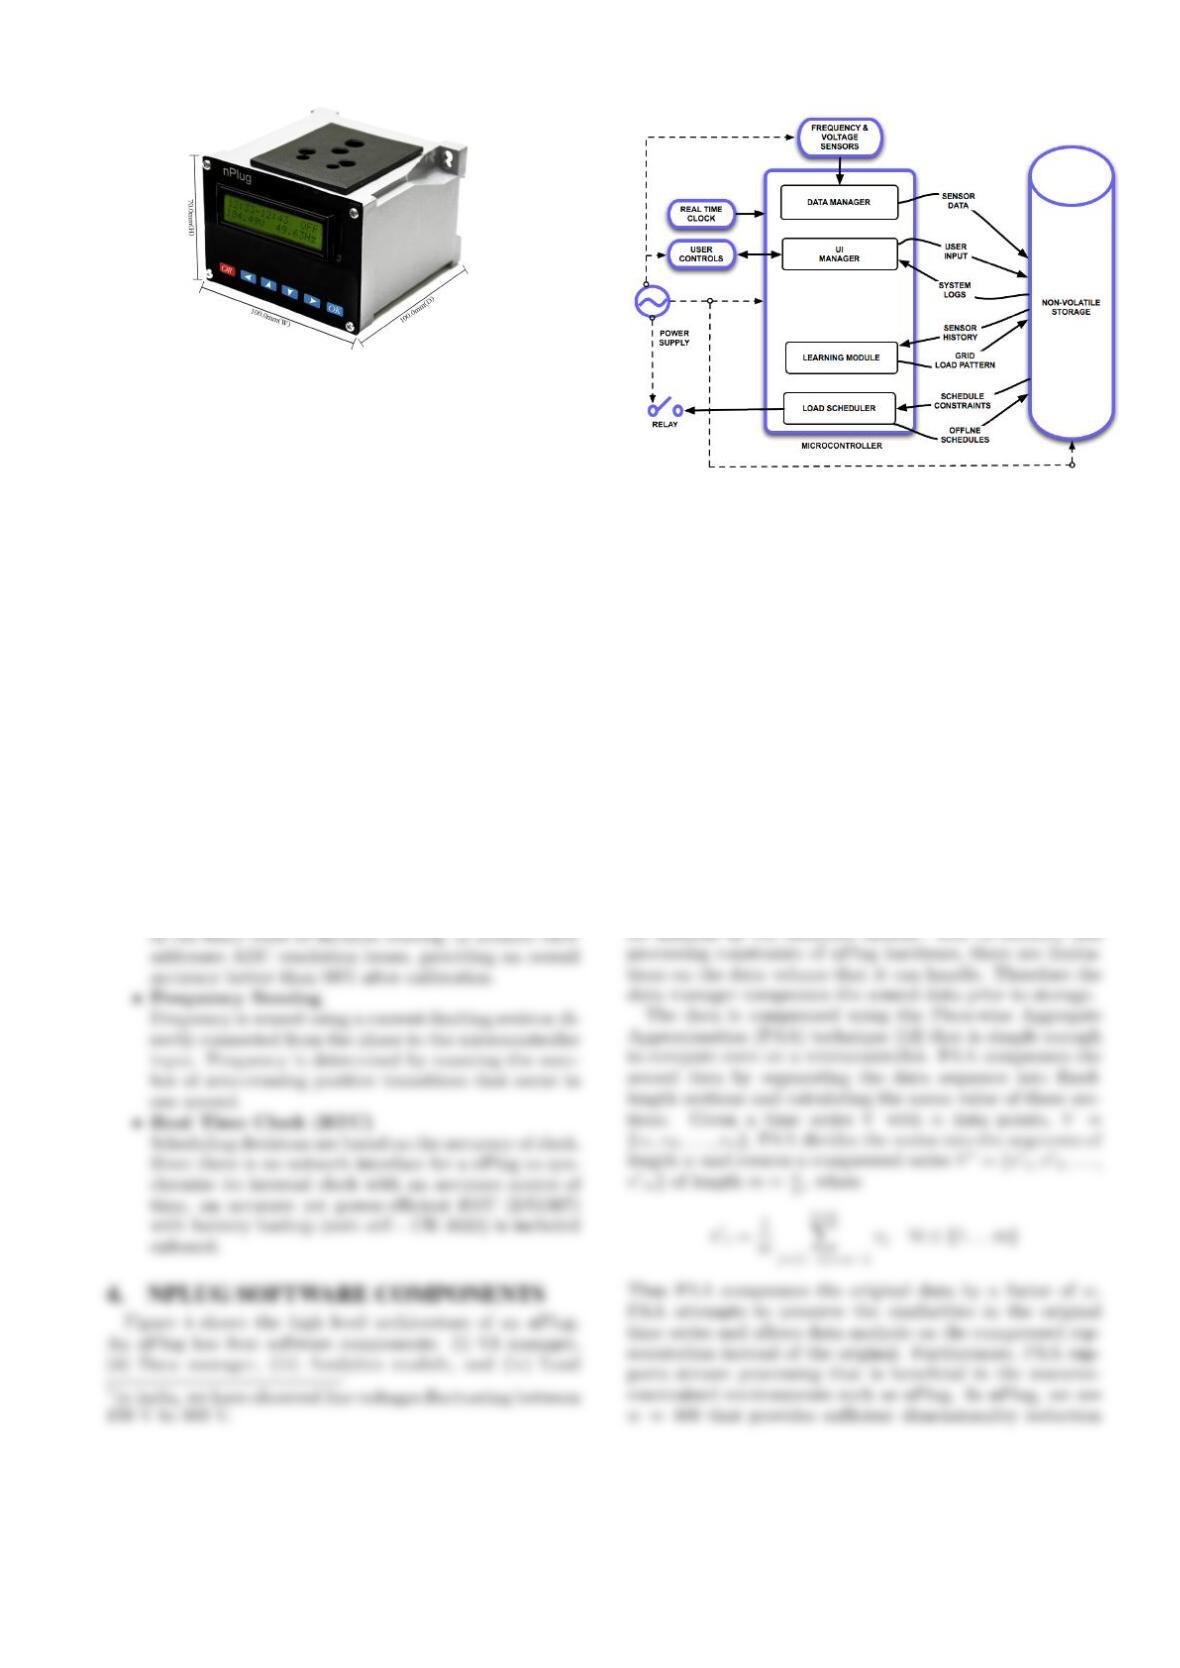
Figure 3: nPlug Prototype
As shown in Figure 4, the hardware modules (drawn in
blue) of nPlug are user controls, grid sensors, relay, real
time clock and power supply.
•User Interface
nPlug is equipped with buttons for entering schedul-
ing preferences and for overriding nPlug’s scheduling
decisions, and a 32-character (16×2) LCD.
•Controller, Memory and Storage
The current design uses a Microchip PIC24FJ128GA010
16 bit microcontroller. This 4MIPS controller has 128KB
of Program Memory, 8KB of RAM and a SPI flash
memory interface. A 4 Mb Flash memory with SPI
Interface is used to store the end user preferences, the
sensing history as well as the outputs from the learning
and scheduling modules
•Voltage Sensing
Voltage sensing is achieved with a resistive divider
(built with 1% tolerance resistors) between phase and
neutral. The divider is sized in such a way that the
dynamic range of microcontroller’s Analog to Digital
Converter (ADC) can cover the input voltage range
(110 V – 350V) 1. Since nPlug is only required to iden-
tify voltage changes due to peak demand, the mea-
surement must be accurate between 185 V and 250
V (≈ ±10% of nominal voltage). Voltage calibration
Figure 4: nPlug: System Overview
scheduler. The following sections explain the functionality
of each component.
4.1 UI Manager
The UI Manager accepts three user-specified constraints:
1.Earliest start time:- the earliest time at which an appli-
ance can be switched on; 2.Latest end time:- the latest time
at which the appliance must finish running; and 3.Dura-
tion:- the duration for which the appliance must be pow-
ered. For example, a residential consumer who leaves for
work at about 8 AM may specify that her insulated water
heater must be run for 30 minutes between 4 AM and 7 AM.
4.2 Data Manager
The data manager works as an interface between the hard-
ware sensors and storage. nPlugs sense the grid at regular
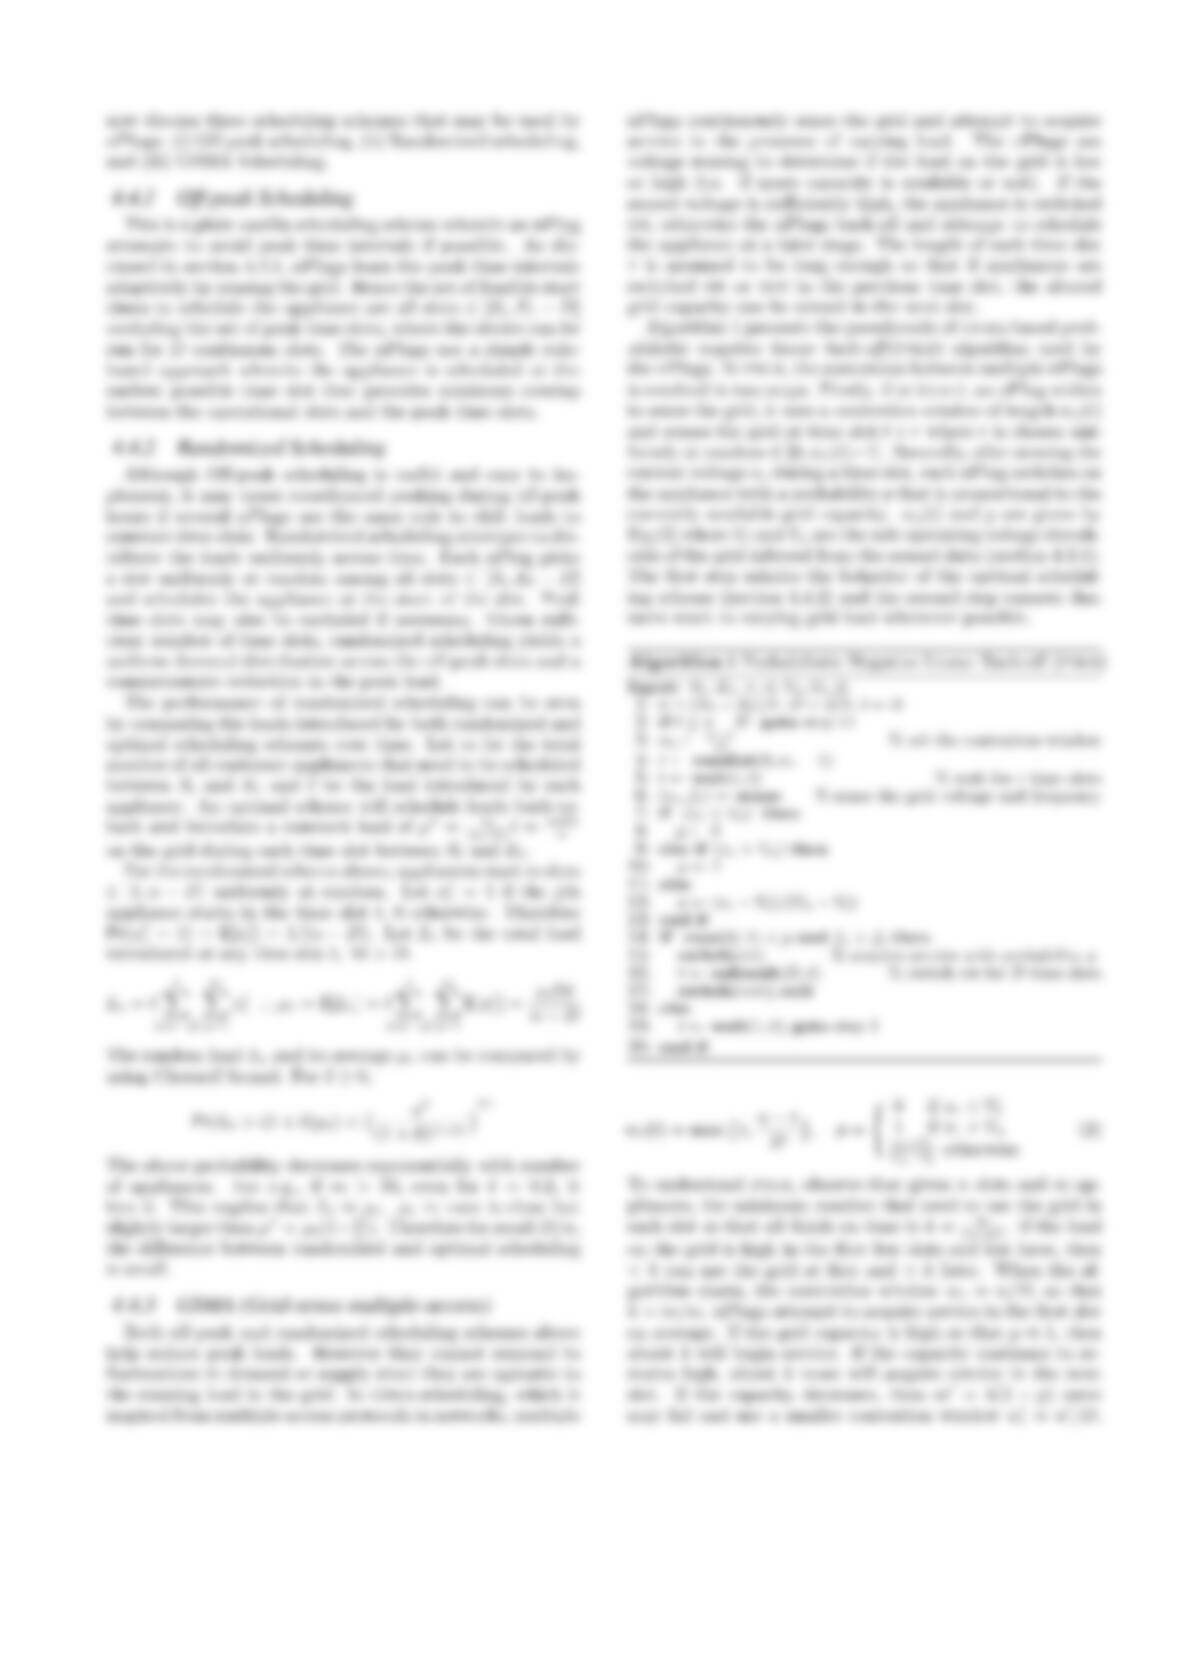
time intervals to measure line voltage and frequency . The
sensed data is preprocessed and saved in the data storage