Innovation Strategy and Entrepreneurship
Professor Rod Adner
Nespresso: A New Coffee Standard
June 2005
Pedro Dias
Hugo Gouveia
Premjit Kaur
Li Liang
Rodrigo Quintas
i
Table of Contents
1 THE COFFEE INDUSTRY 1
1.1 COFFEE – THE COMMODITY 1
1.1.1 TWO BASIC COFFEE TREES 1
1.2 THE COFFEE MARKET STRUCTURE IN THE 80′S 2
1.3 THE COFFEE VALUE CHAIN 4
1.3.1 RESEARCH AND DEVELOPMENT 4
1.3.2 PLANTATION AND HARVEST 4
1.3.3 GETTING THE GREEN BEANS 4
1.3.4 PACKAGING, STORING AND TRADING 5
1.3.5 BLENDING AND ROASTING 5
1.3.6 DRYING 5
1.3.7 FINAL PACKAGING AND DISTRIBUTION 5
1.3.8 PREPARATION AND CONSUMPTION 5
1.4 TWO DIFFERENT WORLDS: LOCAL FARMERS AND MULTINATIONAL ROASTERS 6
1.4.1 LOCAL FARMERS AND PRODUCTION OF GREEN COFFEE 6
1.4.2 MULTINATION ROASTERS AND PRODUCTION OF R&G AND INSTANT COFFEE 8
2 NESTLÉ IN 1985 13
3 TECHNICALITIES OF TH E NESPRESSO SYSTEM 15
3.1 THE COFFEE MACHINE 15
3.2 CAPSULES 15
4 TIMING AND CHOICE OF ENTRY 16
4.1 RESOURCES & CAPABILITIES 16
4.1.1 R&D 16
4.1.2 FINANCIAL RESOURCES 16
4.1.3 SETTING UP A SATELLITE 17
4.1.4 GIVING RISE TO A CLIMATE FOR INNOVATION 17
4.1.5 EXIT STRATEGY 17
4.2 SEGMENTATION, TARGETING AND POSITIONING 17
4.3 MARKETING PLAN 18
5 RETHINKING THE STRATEGY 19
5.1 CHANGES IN MANAGEMEN T 19
5.2 NEW SEGMENTATION, TARGETING AND POSITIONING 19
5.3 MARKETING PLAN 20
5.4 THE CLUB 20
5.5 DIFFERENTIATION ADVANTAGE & SUSTAINABILITY 21

ii
6 NEW LEADERSHIP 23
6.1 PACE OF ADOPTION 23
6.2 PROCESS INNOVATION VS PRODUCT INNOVATION 23
7 THE DECISION TO LAUNCH 25
7.1 THE 4I’S FRAMEWORK 25
7.1.1 THE INITIAL TARGET MARKET 25
7.1.2 INTERNAL RISK 25
7.1.3 INTERDEPENDENCE RISK 26
7.1.4 INTEGRATION RISK 27
7.2 SETTING EXPECTATIONS 27
7.3 EXPECTATION ANALYSIS 28
7.3.1 EXPECTATIONS OUTLOOK 29
8 IMPACT ON THE INDUSTRY 30
8.1 NEW CATEGORY 30
8.2 CHANGES IN THE VALUE CHAIN 30
8.2.1 THE “NESPRESSO CLUB” 30
8.2.2 THE “NESPRESSO BOUTIQUES” 31
8.2.3 RISK AVOIDANCE AND BENEFITS 31
8.3 MANAGING COMPLEMENTS 31
8.4 COMPETITORS AND SUBSTITUTES 32
8.4.1 COMPETITORS 32
8.4.2 SUBSTITUTES 33
8.4.3 NESPRESSO‘S SUPREMACY 33
9 FUTURE OF NESPRESSO 34
9.1 SUSTAINING COMPETITIVE ADVANTAGE 34
9.1.1 PATENTS 34
9.1.2 BUILDING SCALE 34
9.1.3 DATABASE 34
9.1.4 NEW SUPERIOR COMPETITION 34
9.1.5 NEW INFERIOR COMPETITION 35
9.2 REACHING THE INITIAL GOAL 35
10 EXHIBITS 37
iii
Table of Figures
Figure 1 – Importance of coffee in the total exports of some developing countries in 1985.1
Figure 2 – Major coffee producers in 1985. …………………………..………………………1
Figure 3 – Coffee market structure based on different coffee products and on different
consumption habits. …………………………..…………………………..…………………..3
Figure 4 – Size of coffee segments in 1988. …………………………..………………………4
Figure 5 – Production levels (in bags) between 1950 and 1985.…………………………..…6
Figure 6 – Evolution of real prices between 1900 and 1982. …………………………..……7
Figure 7 – Coffee is not a capital intensive activity. …………………………..………………7
Figure 8 – Coffee consumption per capita between 1971 and 1985.………………………..9
Figure 9 – Coffee consumption stagnation in major world markets between 1979 and 1985.
…………………………..…………………………..…………………………..……………10
Figure 10 – Beverages penetration in the US population between 1982 and 1985.……….10
Figure 11 – Coffee consumption by population age group between 1962 and 1985.……..10
Figure 12 – Unlike farmers, roasters have a dominant position in the coffee industry, and
are able to capture significant margins from the final coffee value. ………………………..12
Figure 13 – Nestlé has led the overall coffee market since the late 30’s.……………………13
Figure 14 – Nestlé presence in the R&G and instant coffee segments in 1988.……………13
Figure 15 – Nestlé typical resource allocation to R&D programs over the last few decades.
…………………………..…………………………..…………………………..……………14
Figure 16 – The Nespresso System obliged Nestlé to change its traditional R&D strategy..16
Figure 17 – Nestlé established an exit test for the new Nespresso System.…………………17
Figure 18 – Value Curve for Nespresso and Traditional Espresso. ………………………..21
Figure 19 – Short term barrier to imitation.…………………………..……………………..22
Figure 20 – The chasm effect on Nespresso’s adoption.…………………………..………..23
Figure 21 – Process innovation was key to Nestlé after several years of product innovation.
…………………………..…………………………..…………………………..……………23
Figure 22 – Summary of Nestlés key internal risks.…………………………..……………..26
Figure 23 – Summary of the key interdependence risks.…………………………..……….27
Figure 24 – Summary of the assessment of integration risks.…………………………..…..27
Figure 25 – Nestlé long–term expectations seem to be achievable. …………………………29
Figure 26: Partial structure of coffee market, 1999.…………………………..…………….30
Figure 27 – Tasting Box.……………………………………………………….……………..32
Figure 28: Positioning of Competitors and Substitutes relative to Nespresso. …………….32
Figure 29 – Relative positioning of Nespresso and Tassimo to the market’s required
performance.……………………………………………………….…………………………35
Figure 30 – Moving into the mass–market of espressos.…………………………..………..35
iv
Executive Summary
In the early 80’s Nestlé, the world leading player in the entire coffee market was looking for
major growth strategies in a stagnating coffee industry. Nestlé decided to enter the less
explored Roast & Ground (R&G) espresso segment, which was seen as a niche market with
an expected unique growth rate and attractive margins.
Willing to conquer the premium segment of that market, Nestlé developed and marketed a
new R&G espresso, the Nespresso System, targeted to demanding high–end consumers.
This innovation, based Nestlé’s strong R&D capabilities, led to the creation of a new coffee
standard: the pre–dosed single–portion espressos.
This paper starts by addressing the major issues and threats affecting both the coffee
market and Nestlé and then discusses the invention and evolution of the Nespresso
System. The analysis covers the initial faulty targeting of Nespresso as a luxury product for
the utilitarian office segment and addresses its shift towards a business that becomes the
fastest growing business line inside the entire Nestlé organization.
Thereafter, this paper looks into the timing and choice of entry and the subsequent change
in the positioning of the Nespresso System. We examine the pace of adoption and the
need for a process innovation phase after several years of product innovation. With this
approach we analyze how Nespresso was able to cross the chasm and accelerate the
adoption course. Following this line, we identify the risks Nespresso was facing in the
decision to launch and how relevant they were in setting their initial expectations.
Afterwards, we evaluate the impact that Nespresso had on the overall coffee industry. Due
to this new coffee category we analyze how Nestlé was able to partially change the coffee
value chain, how complements started to play a more decisive role and how Nestlé
managed them, and how did Nestlé affect its competitor’s reactions and strategies.
Finally, in a forward looking exercise, we explore how Nespresso can sustain its current
competitive advantage and what strategies are available for Nestlé to achieve its initial goal.
Nespresso: A New Coffee Standard 1
1 The Coffee Industry
1.1 Coffee – The Commodity
In 1985, coffee, the world’s second largest
agricultural commodity, registered a total
trade volume of $10.3 billion. Its importance
is felt at different levels of today’s society,
with up to 25 million people depending on
it, the vast majority of which are small
producers and farmers in developing
countries, and with 40% of world population
consuming coffee on a regular basis [13,14].
Coffee is globally seen as a vital political and
socioeconomic product, playing an
important role in transferring wealth
between developing and developed
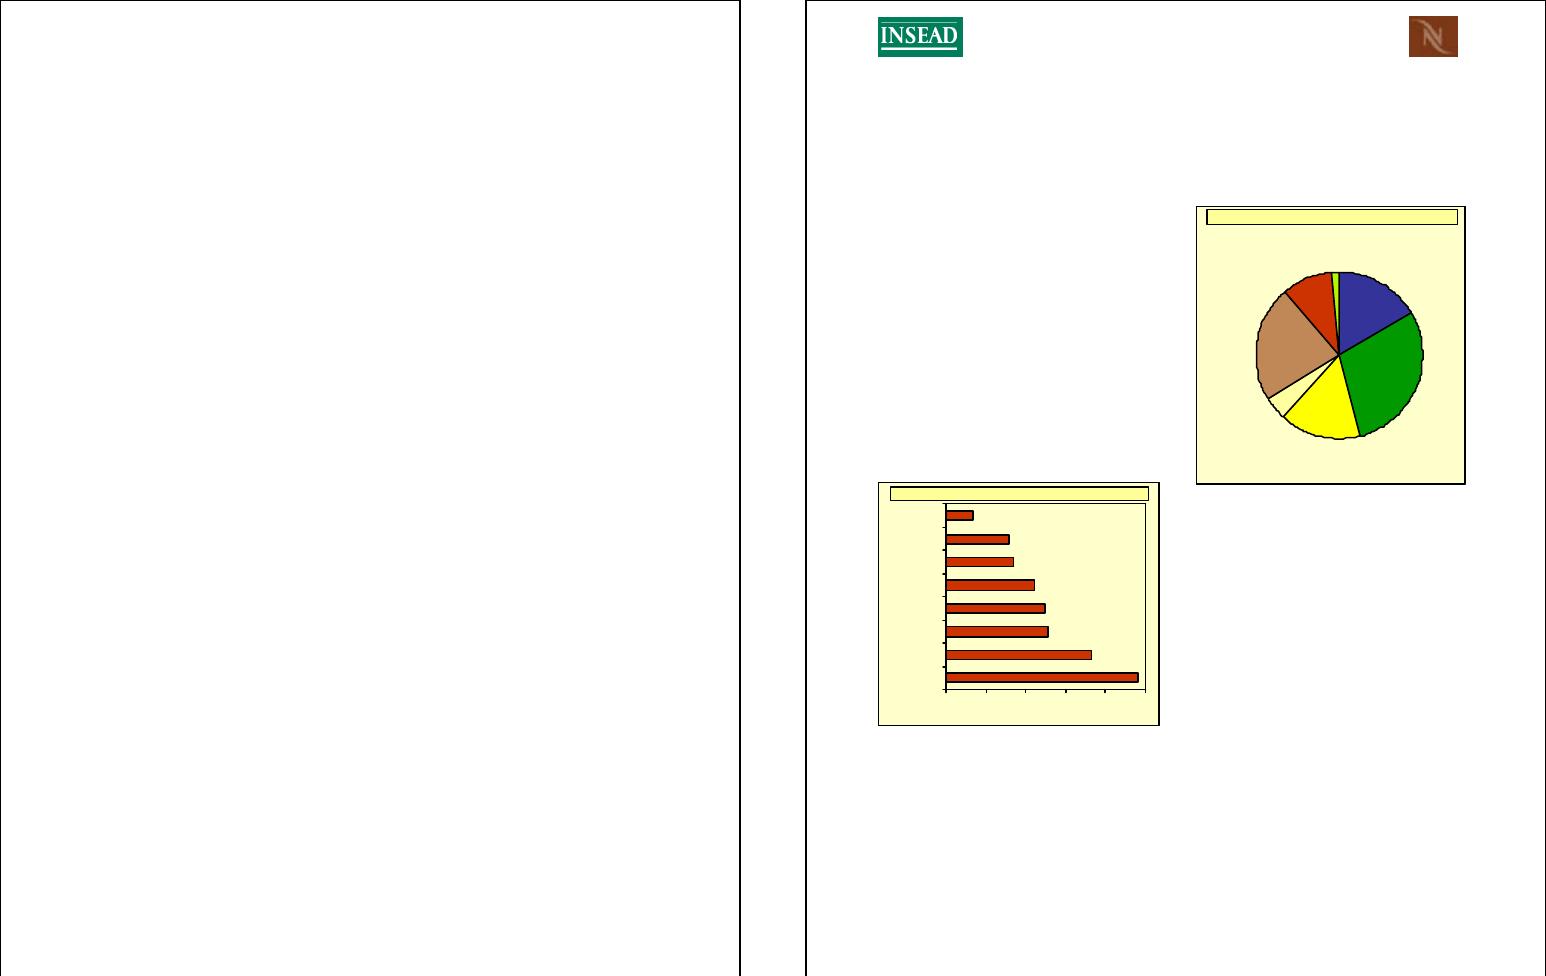
countries. Figure 1 shows the importance of
coffee exports for some developing
countries in 1985.
Figure 1 – Importance of coffee in the total
exports of some developing countries in 1985.
Requiring plentiful rainfalls of about 1,500
to 2,500 mm per annum coffee trees grow
best in the designated “coffee belt”, a region
in the world that straddles the equator
between the tropics of Cancer and
Capricorn. Given these necessary conditions
coffee is produced mainly in Latin America
(67% of total world production) and some
African countries (22%). For these
developing countries, coffee represents one
of the most important contributions of the
foreign exchange earnings [2,3]. Figure 2
shows the major coffee producers in 1985.
Figure 2 – Major coffee producers in 1985.
1.1.1 Two Basic Coffee Trees
There are several varieties of coffee trees
worldwide, but only 4 are produced widely
throughout the world, and only 2 of them
have commercial significance.
The four major coffee varieties are:
• Arabica – the most widely grown and
commercialized
• Canephora or Robusta – the second
largest coffee variety
• Liberica – produced in small
quantities, for local consumption in a
few countries
• Excelsa – produced mainly in Africa,
its importance decreased
substantially over the 60’s and 70’s
due to its susceptibility to the
Trachcomycosis plague.
Major Coffee Suppliers in 1985
Source: Coffee to 1991, EIU
Central
America
17%
Brazil
29%
Colombia
16%
Rest of South
America
5%
Africa
22%
Asia
10%
Rest of the
World
1%
Major Coffee Suppliers in 1985
Source: Coffee to 1991, EIU
Central
America
17%
Brazil
29%
Colombia
16%
Rest of South
America
5%
Africa
22%
Asia
10%
Rest of the
World
1%
Share of coffee in 1985 exports
Source: Coffee to 1991, EIU
13,0
31,3
33,5
44,1
49,8
50,9
73,0
96,6
0 20 40 60 80 100
Brazil
Kenya
Costa Rica
Guatemala
Ethiopia
Colombia
El Salvador
Burundi
%
Share of coffee in 1985 exports
Source: Coffee to 1991, EIU
13,0
31,3
33,5
44,1
49,8
50,9
73,0
96,6
0 20 40 60 80 100
Brazil
Kenya
Costa Rica
Guatemala
Ethiopia
Colombia
El Salvador
Burundi
%
Nespresso: A New Coffee Standard 2
Arabica and Robusta represent, since the
60’s, approximately 99% of the world’s total
consumption [2,23].
Arabica coffee is generally preferred by
consumers because it is usually milder in
flavor and has lower caffeine content.
However, Robusta has attracted some
markets, especially those that enjoy the
higher continental roasts with a distinctive
flavor. Moreover Robusta has become the
preferred variety for the soluble industry
because its yield is higher in the soluble
process than the yield obtained from
Arabica coffees. Robusta has also been a
priority for suppliers worldwide because it
does not require specific altitudes to grow
and it has great resistance to plagues and
diseases1. While Arabica requires an altitude
between 600 and 2000 m above sea level to
grow, Robusta grows up to 1000 m above
sea level.
1.2 The Coffee Market Structure in the
80’s
Coffee producers (roasters) can usually
develop three different coffee products:
R&G coffee, instant coffee and coffee
drinks. Coffee drinks in 1985 were still in an
inception point and represented about 0,1%
of the total coffee market. The two main
categories of coffee products were therefore
the R&G coffee and the instant coffee.
Instant coffee
Instant coffee, also called soluble coffee, is a
convenient and ready–to–drink coffee
targeted essentially to home consumption.
Its preparat ion offers a bigger flexibility since
it does not require any special equipment or
materials (only a cup and boiling water).
1 Robusta is a Spanish word that translates from the
English “robust”, due to its resistance to plagues,
diseases and even adverse weather conditions.
Instant coffee is obtained through
dehydration of beans and is provided in the
form of either powder or granules. These
can be later rehydrated using hot or boiling
water to provide a rapid and “clean” coffee.
Although some blends between Arabicas
and Robustas are used, instant coffees
usually contain a larger proportion of
Robustas due to their higher solubility.
The preparation of soluble coffee is
probably the most convenient and flexible
process, however, it comes at the expense of
a lower quality coffee (especially in flavor,
aroma and freshness). Instant solubles can
also include low quality “espressos”2,
cappuccinos or decaffeinated coffees.
Roast and Ground coffee
R&G coffee was the largest coffee category
in the 1985 and was further subdivided into
two different types of coffee: filter and
espresso. R&G coffee can also be produced
by blending Arabicas with Robustas, but
higher quality products tend to use a higher
proportion of Arabicas, given their mildness
and capacity to preserve the flavor.
Filter coffee is produced by brewing coffee
with paper filters into a container. The
coffee produced with filters is usually a clear
coffee, light–bodied and with little sediments.
This coffee is usually produced with
automatic drip brewers that are composed
by a paper filter, a filter holder and a
decanter. Electronic drip machines have
increased the convenience of this process
since they heat the water to the optimum
temperature before the brewing process.
Nevertheless this process is still less “clean”
than the soluble coffee that does not require
any filter processing. Either with disposable
filter (paper filters) or with permanent filter
(washable mesh filters), filter coffee always
2
Soluble espresso is a denomination that most coffee
experts refuse to accept. It is perceived as a marketing
categorization that does not respect the quality
standards of a genuine espresso.
Nespresso: A New Coffee Standard 3
requires additional steps when compared to
instant coffee.
Although still targeted to in–home
consumers, this type of coffee was also
massively present in the “away–from–home”
segment. This coffee was perceived to be of
better quality than instant coffee but less
convenient due to the requirement of
additional equipments and to the
preparation and maintenance of filters. Filter
coffees offered the same product variety as
soluble coffees, such as cappuccinos or
decaffeinated.
Espresso was a small category in 1985 and
mainly targeted “away–from–home”
consumption. This category consisted of
very high quality coffees for premium
consumption segments. Invented in Italy in
the beginning of the twentieth century,
Espresso was still a low volume product in
1985 and represented about 3% of the
overall coffee market.
Espresso is a brewing method that uses
pump–driven machines to extract the interior
of the coffee bean with hot water (but not
boiling) and high pressures (nine
atmospheres)3. At this pressure a typical
espresso should take between 18 and 23
seconds to be ready.
This method produces a thicker, richer, and
darker coffee. Espresso is the coffee
preparation that best preserves the coffee’s
original flavor and aroma.
Although faster to prepare, espresso coffee
in 1985 required very sophisticated and
expensive machines that prevented its
penetration in the domestic segment.
Consumption habits
All these types of coffee could essentially be
consumed through two different “channels”:
“in–home” consumption and “away–from–
home” consumption. Home consumption
3 Espresso derives from the Latin word “Expresere”
which means “to press out”.
was clearly predominant in soluble and filter
coffees while higher–quality coffees were
predominantly sold in the “away–from–home”
channels. These channels included
restaurants, bars, hotels, coffee shops and
stationary vending machines.
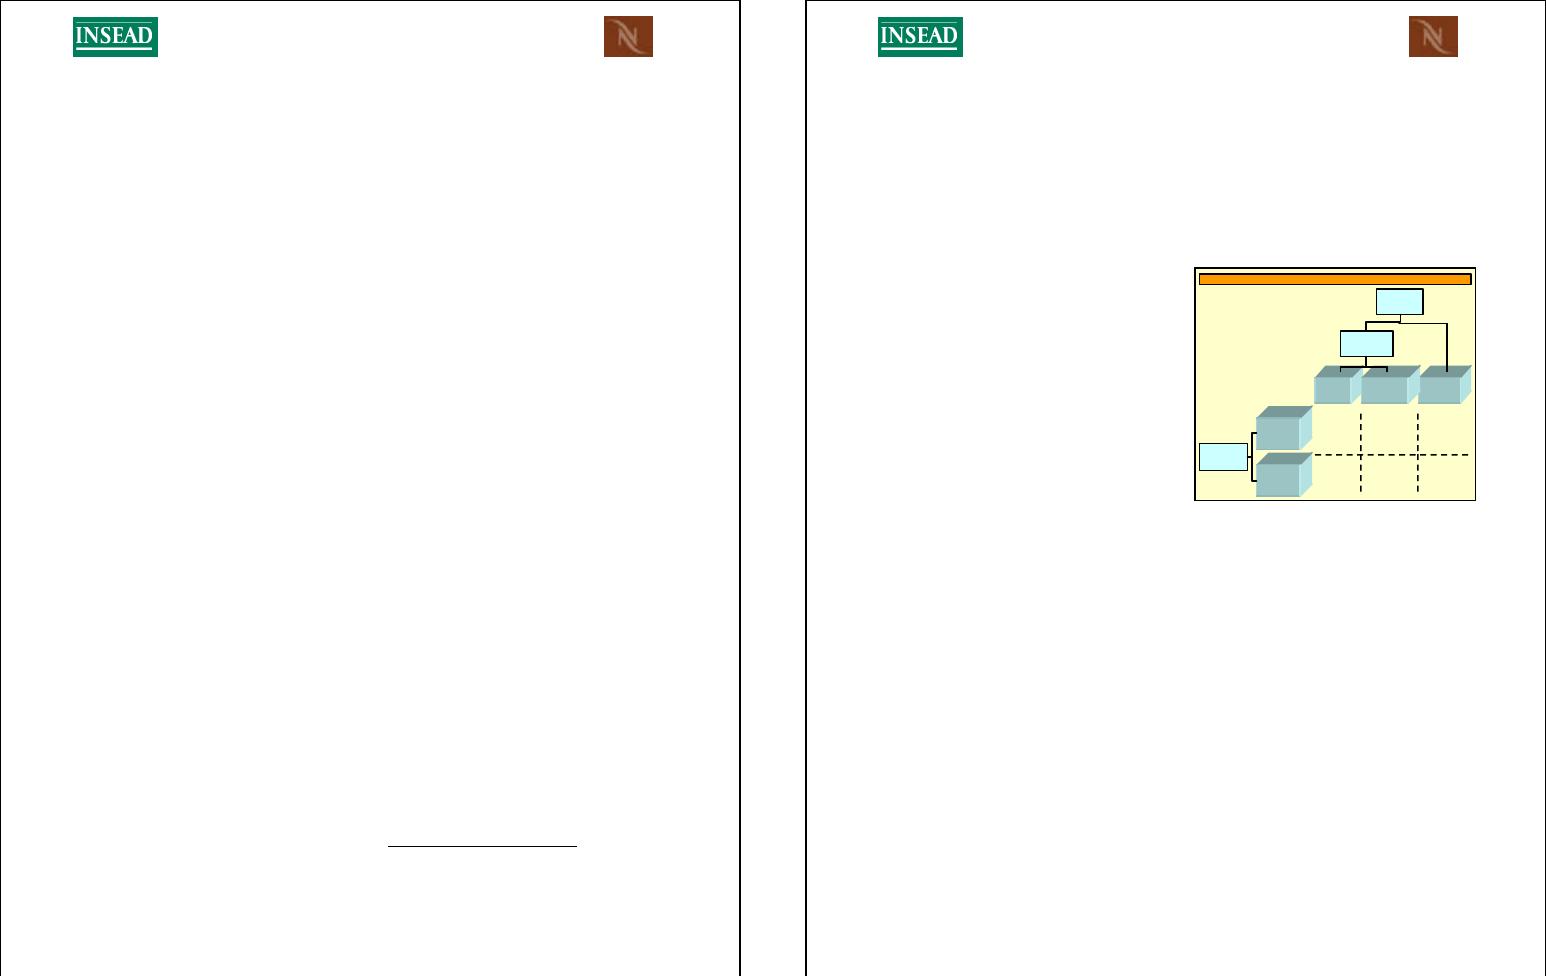
Figure 3 illustrates the 6 market segments
that result from the distribution of three
different coffee products in the two
described consumption channels.
Figure 3 – Coffee market structure based on
different coffee products and on different
consumption habits.
Although the Espresso category was
becoming more and more attractive,
especially due to the higher margins it
offered the roasters, it was still a very small
category that was not sufficient to command
growth in the overall coffee consumption.
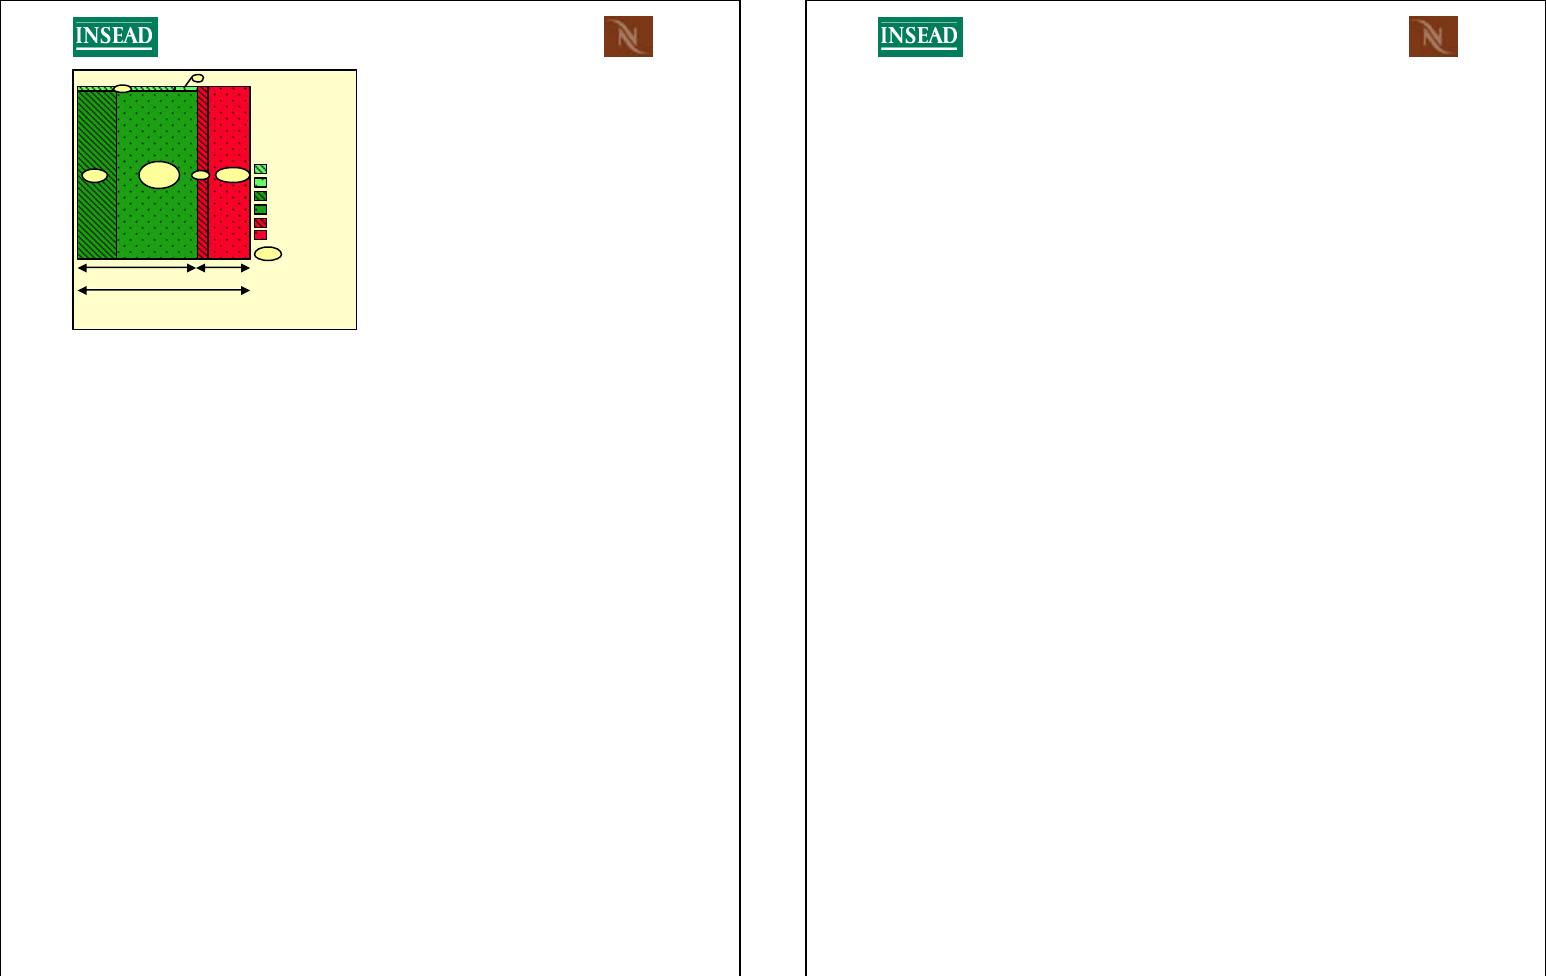
Filter coffees still represented the largest
coffee category, with 65% of the overall
coffee market, followed by the instant
category that accounted for 32% of the total
market.
Figure 4 shows the size of the relevant coffee
categories in 1988, when total world coffee
consumption was estimated to worth US$
180 Billion.
Coffee
types
Roast and
ground
InstantFilter Espresso
Drinking
habits
In–home
Away
from
home
In–home
filter In–home
espresso In–home
instant
Away
instant
Away
espresso
Away
filter
Basic market structure for coffee
Coffee
types
Roast and
ground
InstantFilter Espresso
Drinking
habits
In–home
Away
from
home
In–home
filter In–home
espresso In–home
instant
Away
instant
Away
espresso
Away
filter
Basic market structure for coffee
Nespresso: A New Coffee Standard 4
Figure 4 – Size of coffee segments in 1988.
1.3 The Coffee Value Chain
The coffee industry in 1985 had basically to
develop two different types of coffee: roast
and ground coffees (R&G) and soluble
coffees.
Despite the differences in their consumption
and preparation both coffees are produced
by the same industry with very similar value
chains, similar processes and by the same
players.
To produce both types of coffees the
following steps are necessary [13,14,15]:
i. Research and development of
varieties
ii. Plantation of coffee trees and harvest
of individual cherries
iii. Processing of cherries and removal
of green beans
iv. Packaging, storing and trading of
bags
v. Roasting of green beans
vi. Extraction and drying of roasted
beans (only for soluble coffees)
vii. Packaging of final coffee and
distribution
viii. Preparation of coffee and final
consumption
1.3.1 Research and development
To obtain a superior coffee quality it is
increasingly important to grow the
appropriate varieties. Researchers around
the world work to improve several
characteristics of coffee varieties. Ability to
develop at different altitudes, content of
caffeine and resistance to pests and diseases
are some of the aspects that researchers try
to improve.
1.3.2 Plantation and harvest
After the improvement or discovery of new
varieties, the new seeds are crossed with
older seeds and given to farmers for mass
production.
After plantation by farmers, coffee trees take
on average three to four years to reach
maturity and to bear fruit.
After the appearance of the first cherries it
takes about nine additional months to pick
them up. Cherries develop slowly, as they
follow a transformation process from light
green to bright red. When cherries get a
homogeneous red coloring, farmers may
finally picked them, something that is usually
done by hand.
1.3.3 Getting the green beans
Inside each cherry there are two coffee
beans. Once harvested the beans must be
separated from the skin, pulp and
parchment that surround them. This
separation may be done through two
alternative methods:
• Dry processing
• Wet processing
In dry processing the cherries are first dried
by heat (usually with exposure to the sun).
The drying process is usually carried on the
Away Espresso
In –home Espresso
Away Filter
In –home Instant
Away Instant
In –home Filter
x% Relative size over
total coffee market
2754619
~3
<1
R&G (68%) Instant (32%)
US$180 Billion
Source :Nestlé, EIU, ICO, Team Analysis
Away Espresso
In –home Espresso
Away Filter
In –home Instant
Away Instant
In –home Filter
x% Relative size over
total coffee market
2754619
~3
<1
R&G (68%) Instant (32%)
US$180 Billion
Source :Nestlé, EIU, ICO, Team Analysis
Nespresso: A New Coffee Standard 5
field or on large aluminum tables (to
concentrate the heat).
In wet processing the skin and the pulp of
the cherries are removed by a succession of
mechanical and watery treatments,
producing parchment coffee.
1.3.4 Packaging, storing and trading
After the coffee is dried, the parchment that
remains on the bean is removed by a hulling
machine. Afterwards, the individual coffee
beans are sorted by hand or by specific
machines to remove stones, other strange
forms of matter and defective beans. At this
stage producers obtain what is generally
called green coffee.
The following procedure is to control the
green coffee quality. In this stage, several
quality aspects are manually (through
sampling) or automatically controlled. Color,
density and shape, as well as odor and
flavor, are monitored to control the final
quality of the exported beans.
The beans are then packed in bags of 60 kg
and stored in warehouses, where they wait
for direct purchases from roasters or from
being traded in the futures markets. After
the purchase coffee bags are shipped to the
factories of roasters.
1.3.5 Blending and Roasting
The blending is the process by which
different beans from different origins are
combined to obtain final coffees with
different properties: consistency, aroma and
flavor. Additionally, blending also increases
the roaster’s flexibility as it makes him less
dependent on each source of supply, both in
terms of availability and in price.
Blends are often seen as an art of making
coffee and heavily depend on the targeted
markets. Blends on southern European
countries such as France, Spain and Portugal
tend to have a very high proportion of
Robusta varieties, where Scandinavian
countries and Italy tend to have higher
proportion of Arabica coffees.
Roasting develops the coffee’s flavor and
flagrancy and the higher the roast the more
the flavor is developed. Higher roasts
produce darker liquors, with stronger
aromas but also lead to bigger weight losses.
Lighter roasts, on the other hand, produce
lighter liquors but lead to higher process
efficiency.
To produce soluble coffees higher roasts are
usually adopted as the cell destruction is
higher which facilitates the extraction of
solubles.
Roasting is usually done after blending
(although it can occasionally be done before)
and can also differ according to the
consumer tastes. Italy and France usually
demand high roasts while other European
countries usually prefer medium to light
roasts.
This step marks the end of the process for
Roast and Ground (R&G) coffees.
1.3.6 Drying
In the case of soluble coffees a longer
manufacturing process is required. The next
steps are the extraction and drying of the
roasted beans in order to obtain a soluble
coffee powder.
1.3.7 Final packaging and distribution
After a final quality control, that guarantees
the coffee basic properties (aroma,
consistency, color and solubility) the coffee
powder is filled in jars and is distributed to
coffee shops and retailers.
1.3.8 Preparation and consumption
Different preparation and consumption
patterns are possible depending on the type
of coffee. Soluble coffees are predominantly
consumed inside houses and are easier to
Nespresso: A New Coffee Standard 6
prepare, usually requiring simpler or no
equipments at all. Typical soluble coffees
require only boiled water and a cup with
coffee.
R&G coffee preparations are usually more
complex and require more sophisticated
equipments, such as electric drip coffee
machines or pump–driven espresso
machines. While drip coffee machines are
appropriate for domestic consumption
(producing lower quality coffee), espresso
machines, given their cost, size and
complexity, are usually adopted for
consumption at restaurants and coffee shops
(providing top quality coffee).
1.4 Two Different Worlds: Local Farmers
and Multinational Roasters
The various steps of the coffee industry
value chain can be basically integrated into
two broad segments. The first segment, until
trading, refers to the production and
commercialization of green coffee. The
second segment comprises the production of
R&G and soluble coffee and refers to the
commercialization of coffee products that
are purchased by the end consumer.
1.4.1 Local Farmers and Production of
Green Coffee
The market for the production of green
coffee is very unattractive [4,5].
With the proliferation of new production
techniques the world has assisted to a
significant increase of coffee farmers, which
led to a continued oversupply and
consequent price decline.
Extremely competitive market
Aided by new technologies and an
increasing consumption in the developed
countries in the 50’s and beginning of the
60’s, the world production registered a
significant increase in the production levels
until 1965. However, in the following 20
years the market would stagnate with
excessive supply and the production levels
were maintained at approximately 65 million
bags. Figure 5 illustrates the production
volatility between 1950 and 1985.
Figure 5 – Production levels (in bags) between
1950 and 1985.
The fast growth in coffee production during
the late 50’s in Latin America and the
emergence of new coffee suppliers
encouraged by the very high prices in that
period, such as Vietnam4 and Indonesia,
turned coffee into a commodity that suffered
from long periods of oversupply followed by
very brief periods of short supply. The
agronomical properties of coffee production
were appropriate for the fast growth of small
and multiple cultivations – more than half of
the world’s coffee is produced on farms of
less than 5 ha.
For most producing countries coffee is a
relatively easy crop to grow and does not
require sophisticated skills in processing and
handling. On the other hand, the demand
for high level coffee that required more
sophisticated processes and equipments was
not significant until the late 70’s.
4
In 2001 Vietnam was the third world producer of
Coffee behind Brazil and Colombia.
Total World Production 1950–1985
Note: Each bag weighs 60Kg
Source: Coffee to 1991, EIU
0
20
40
60
80
1950 1956 1962 1968 1974 1980 1985
Mn
bags
Total World Production 1950–1985
Note: Each bag weighs 60Kg
Source: Coffee to 1991, EIU
0
20
40
60
80
1950 1956 1962 1968 1974 1980 1985
Mn
bags
Nespresso: A New Coffee Standard 7
While temporary periods of coffee shortage
occurred mainly as a result of frosts and
droughts in the tropics, the ongoing
existence of excessive stocks usually
guaranteed oversupply.
With a sustained oversupply prices started to
fall and a long period of price decline had
begun. Figure 6 shows the evolution of real
prices of coffee between 1900 and 1982. In
the late 70’s, as an effort to support the
declining prices, the International Coffee
Organization decided to impose export
quotas. At the same time a group of Latin
American producers, concerned with the
evolution of coffee prices formed what was
known by the Bogotá Group, later renamed
Pancafé. Although able to manipulate and
partially control the market for 18 months,
they would eventually disappear due to
strong pressure from consuming nations
such as the US.
Figure 6 – Evolution of real prices between 1900
and 1982.
Low Bargaining Power
Farmers have very low bargaining power as
they are essentially price takers (either from
global traders that follow market prices or
from selective direct purchases from
roasters). Moreover, farmers are usually
subject to very bad trading conditions with
major traders and exporters as they usually
control prices, demand high interest rates on
coffee loans and accumulate large payable
amounts.
Low product differentiation
One of the few differentiating factors in
coffee production is the access to state of the
art know–how and to more productive and
resistant coffee seeds. Requiring extensive
financing from multinational roasters,
advanced R&D programs are only
conducted by reputed farmers that maintain
good relationships with roasters. For new
entrants or small farmers, a sustained
relationship with a major roaster is difficult
to obtain, and their chances to differentiate
in coffee quality become slimmer.
Low barriers to entry
Green coffee is produced by approximately
5 million farmers around the world. Coffee
production is not a very capital intensive
activity and does not require very advanced
skills to produce low to medium quality
coffee. Figure 7 shows a typical cost
structure for a coffee farmer.
Figure 7 – Coffee is not a capital intensive
activity.
Coffee Real Price 1900–1982
Source: NestléCoffee Report 2003
Coffee Real Price 1900–1982
Source: NestléCoffee Report 2003
Coffee Real Price 1900–1982
Source: NestléCoffee Report 2003
40
25
35
60
15
25
100 100
0
25
50
75
100
Index
(%)
Washed Arabica Unwashed Robusta
Cost structure for coffee production in 1985
Labor
Other
inputs(1)
Overhead
Total
costs
Labor
Other
inputs(1)
Overhead
Total
costs
(1) Includes seeds, fertilizers, sprays, water and other materials
Source: The Economics of Coffee, 1986
40
25
35
60
15
25
100 100
0
25
50
75
100
Index
(%)
Washed Arabica Unwashed Robusta
Cost structure for coffee production in 1985
Labor
Other
inputs(1)
Overhead
Total
costs
Labor
Other
inputs(1)
Overhead
Total
costs
(1) Includes seeds, fertilizers, sprays, water and other materials
Source: The Economics of Coffee, 1986

Limited complements
A recent trend in 1985 that some roasters
were pursuing was the conjoint purchase of
other agricultural products to some coffee
farmers. As a complement to coffee
production, and benefiting from similar
growing conditions, coffee farmers also
started to grow peanuts, bananas, coconuts,
ginger, cassava, pineapples, and sugar cane.
However, this diversity often implied higher
cost structures (diseconomies of scope) that
eroded the potential margin benefits.
1.4.2 Multination Roasters and Production
of R&G and Instant Coffee
The market for R&G and instant coffee was
traditionally a very attractive market but
started to lose some of its attractiveness
during the 70’s. Stagnated consumption,
rising pressure from large retailers and
increasing competition from private labels
were some of the factors that were reducing
the market’s attractiveness to multinational
However, on the distribution side, roasters
started to feel an increasing pressure from
global retailers that were forcing them to
reduce their margins. This trend seemed to
be sustainable and would definitely
compromise roasters bargaining power with
major distribution channels.
High barriers to entry – importance of R&D
Coffee roasting is a considerable capital
intensive activity. Not only does it require
state–of–the–art facilities to improve
production yields and achieve higher–quality
blends, but it also implies advanced and
expensive R&D programs to develop
sustainable and superior coffee varieties.
Research is vital to get higher yields from
coffee cherries. Over the last two decades
several techniques, such as somatic
embryogenesis, molecular markers and
cryostorage, have helped roasters to obtain
higher yields from top–quality beans.
Large international roasters, such as Nestlé,
often develop advanced research centers that
lead to sound breakthroughs in coffee
production and processing. Nestlé Research
that aims the development of hybrid
varieties that offer unusual higher–yields
from lower water content and thus lower
weight losses during the roasting process.
All these programs are highly subsidized by
roasters and are developed in producing
countries’ research centers.
On process improvement, roasters also
invest a significant share of resources.
Nestlé, for example, has several R&D farms
around the world, the most important in
Thailand, Philippines and Ethiopia, to test
and develop new plantation and processing
systems. In these “scale laboratories”, Nestlé
is able to develop new equipments and
procedures that eventually lead to higher
quality beans or to higher yields processes.
Stagnating coffee demand
The last decades of the twentieth century
would witness the emergence of an
international and fashionable coffee culture,
transforming an ancient commodity into a
phenomenon of lifestyle and premium
consumption. International brands, such as
world leader Nescafé, would become global
Figure 8 – Coffee consumption per capita
betw een 1971 and 1985.
However several factors started to affect
coffee consumption in the early 70’s,
namely:
• Competition from other beverages,
specially from soft drinks and fruit
juices
• Adverse publicity from several health
studies revealing the risks of high
coffee consumption
Consumption per capita between 1971 and 1985
Source: Coffee to 1991, EIU
0
1
2
3
4
5
1971 1973 1975 1977 1979 1981 1983 1985
Kg per
year
Consumption per capita between 1971 and 1985
Source: Coffee to 1991, EIU
0
1
2
3
4
5
1971 1973 1975 1977 1979 1981 1983 1985
Kg per
year