1. Perform a comparative evaluation of both projects.
Regarding to the new product project, the inflation rate is not considered in the project since the
estimation of the growth of the sale revenue is the real growth rate. The real growth rate means the
inflation factor is concerned when forecasting the growth of the future. Besides, other expenditures
are considered regarding to the percentage of the revenue. Therefore, these factors also counted
the inflation rate factors. The existing indirect overhead cost is considered as the relevant cost for
the project 1. These costs are existing when conducting the project which means these costs are
classified as the relevvant cost. Moreover, the cost of the marketing analyzing conducting before
conducting the project is considered as irrelevant cost for the project 1. These marketing costs is
considered as the sunk cost as well. The remaining costs are considered as the relevant costs for
the project 1.
unit: million pounds
Project 1
Y0
Y1
Y2
Y3
Y4
Y5
Y6
Y7
Y8
Initial investment
2100
Revenue
4500
4839.75
5205.15113
5598.14003
6020.79961
6475.36998
6964.26041
7490.06207
The gross profit
540
580.77
624.618135
671.776804
722.495953
777.044397
835.711249
898.807449
Indirect annual operating
expenses
123.75
133.093125
143.141656
153.948851
165.571989
178.072674
191.517161
205.976707
Further overhead cost
90
90
90
90
90
90
90
90
Depreciation
262.5
262.5
262.5
262.5
262.5
262.5
262.5
262.5
The scrapt value
220.5
Net income before taxation
63.75
95.176875
128.976479
165.327953
204.423964
246.471723
291.694088
560.830742
Taxation
12.75
19.035375
25.7952958
33.0655906
40.8847927
49.2943446
58.3388176
112.166148
Net Income
51
76.1415
103.181183
132.262363
163.539171
197.177378
233.35527
448.664593
Depreciation
262.5
262.5
262.5
262.5
262.5
262.5
262.5
262.5
NCF
–2100
313.5
338.6415
365.681183
394.762363
426.039171
459.677378
495.85527
711.164593
PV
–2100
276.061579
262.5893
249.693871
237.361037
225.575353
214.320478
203.57943
257.109137
NPV
-173.70981
IRR
-1.938%
PPP
7.20515188
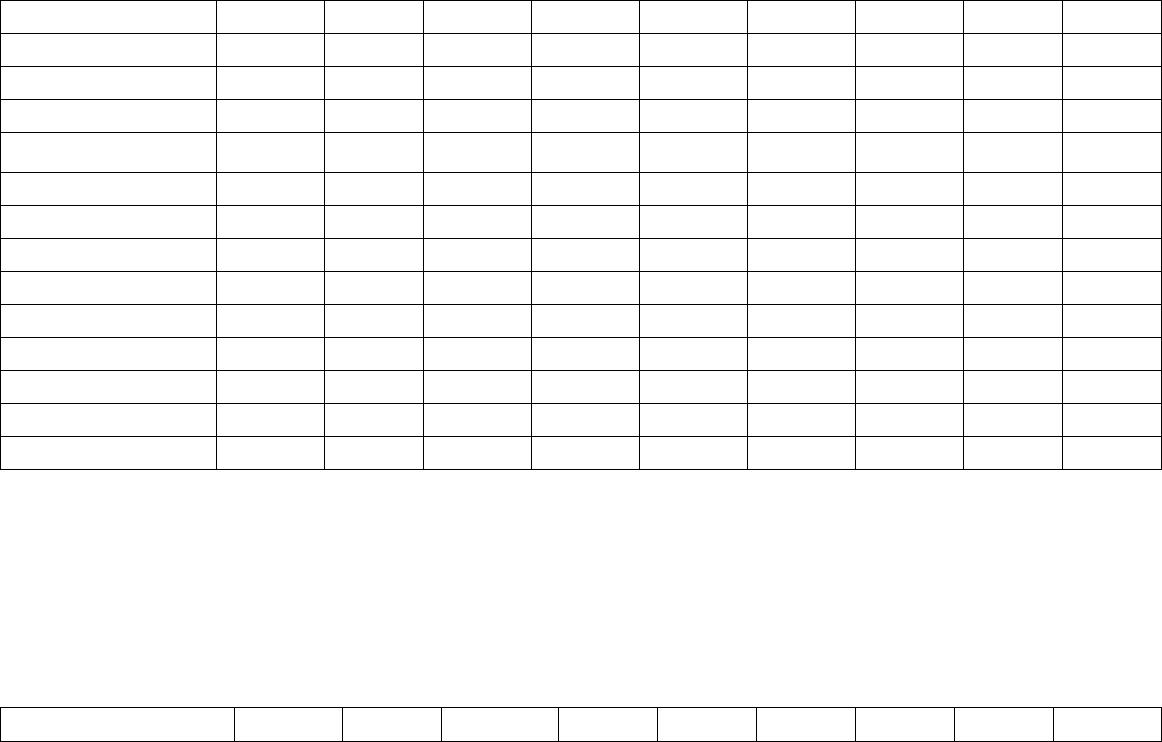
Regarding to the project 2, all information provided is relevant to the project 2. Therefore, these
information should consider in the project 2.
unit: million pounds
Project 2
Y0
Y1
Y2
Y3
Y4
Y5
Y6
Y7
Y8
Initial investment
2100
net after-tax cash flows
900
900
300
300
300
100
100
100
NCF
–2100
900
900
300
300
300
100
100
100
PV
–2100
792.52128
697.877755
204.845545
180.382726
158.841277
46.6241082
41.0562199
36.1532533
NPV
58.3021654
IRR
1.1562%
PPP
6.9894529
The growth of dividend per year
0.08730159
The cost of equity:
The dividend per share for next
year
0.215
The current market value of
stock
4.45
The growth rate of dividend
0.08730159
The cost of equity :
0.13561619
Basing on the information, the firm employ the equity to finance for the projects. Therefore, it is
required to count for the cost of equity. The cost of equity is calculated with the formulation below: