M&M Statistics/A Chi Square Analysis
Have you ever wondered why the package of M&Ms you just bought never seems to have
enough of your favorite color? Or, why is it that you always seem to get the package of mostly
brown M&Ms? What’s going on at the Mars Company? Is the number of the different colors of
M&Ms in a package really different from one package to the next, or does the Mars Company
do something to insure that each package gets the correct number of each color of M&M?
Here’s some information from the M&M website:
% color
Plain
Peanut
Crispy
Minis
Peanut
Butter
Almond
Brown
13%
12%
17%
13%
10%
10%
Yellow
14%
15%
17%
13%
20%
20%
Red
13%
12%
17%
12%
10%
10%
Green
16%
15%
16%
12%
20%
20%
Blue
24%
23%
17%
25%
20%
20%
Orange
20%
23%
16%
25%
20%
20%
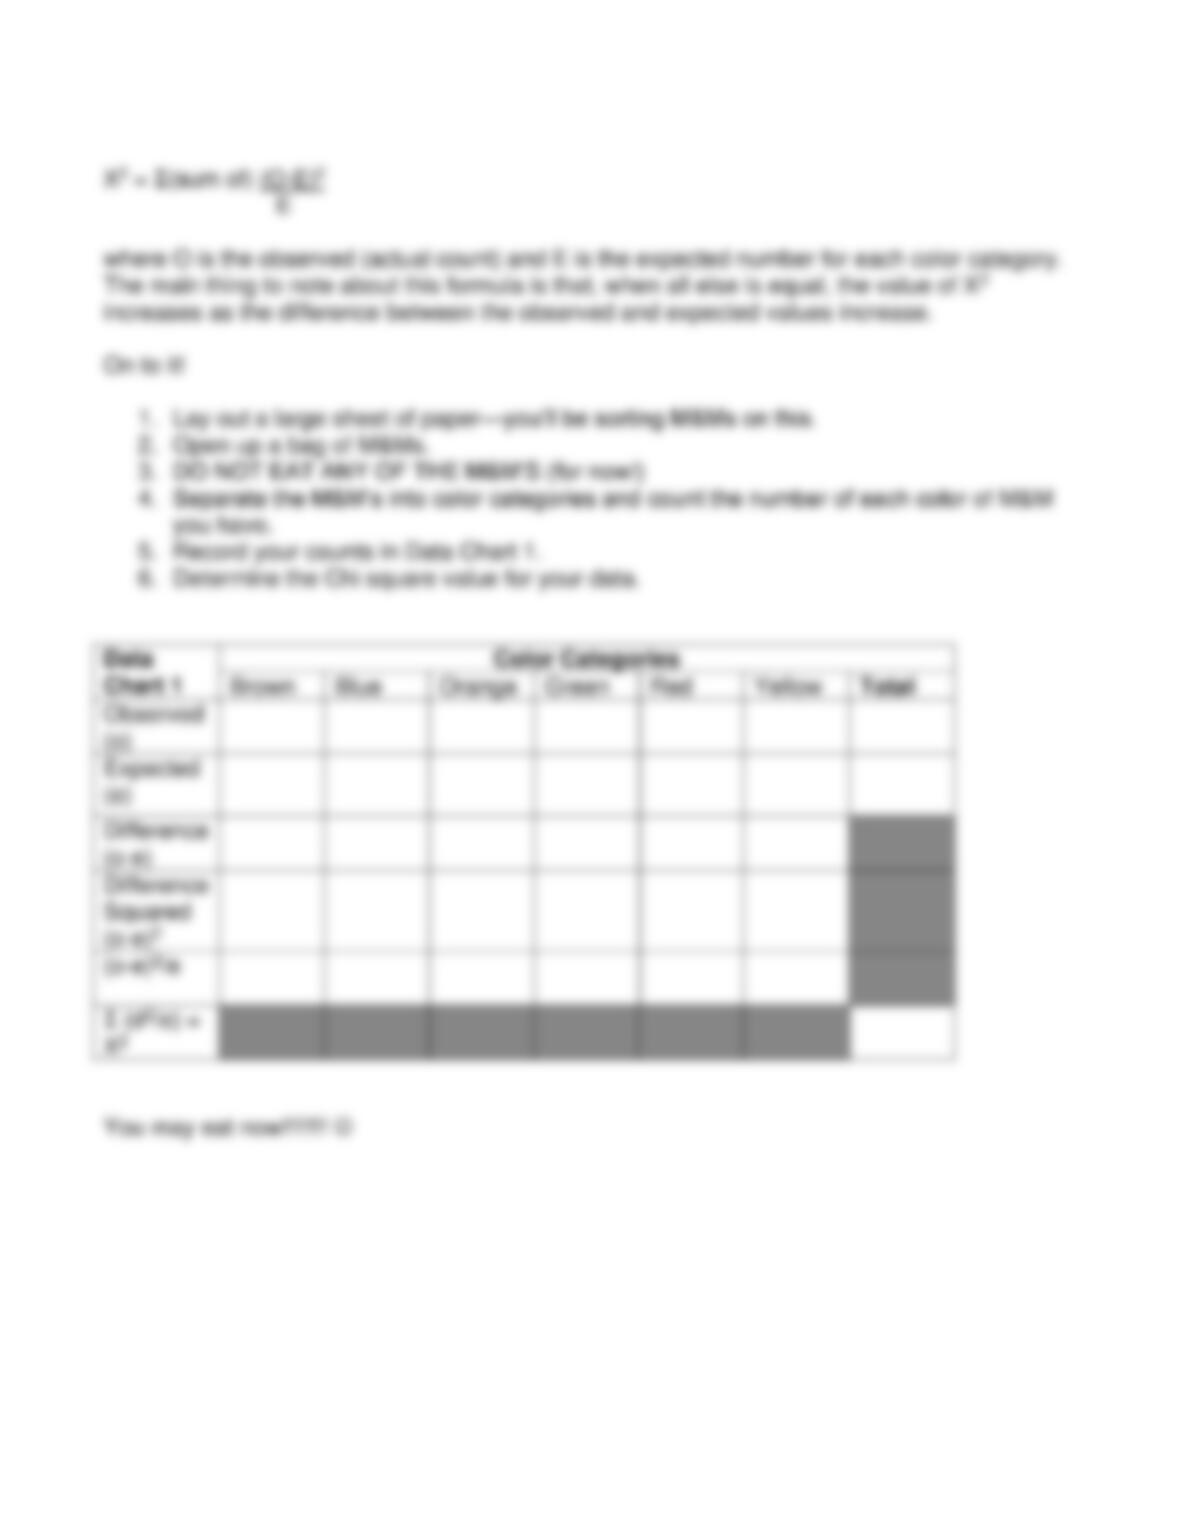
One way that we could determine if the Mars Co. is true to its word is to sample a package of
M&Ms and do a type of statistical test known as a “goodness of fit” test. This type of