Microeconomics Final Study Guide
Week Nine:
Chaing Chapter Nine: Monopolies
• Characteristics of monopolies:
o Just one seller
o No close substitutes for produce/services
o Significant barriers to entry
o Price makers; have market power
• MR < P because the industry’s demand is the monopolist’s demand
• Profit is maximized by producing where MR = MC and price is set based on demand curve
• Monopolies are not guaranteed economic profits because demand can be insufficient to cover costs
• Profit maximization rule
o Marginal Revenue < Price
• Marginal revenue will always be less than demand in a monopoly
• Natural monopolies exist when economies of scale are so large that the minimum efficient scale of
operation is roughly equal to market demand; regulation:
o Marginal cost pricing rule:
▪ Price = MC
▪ If MC < ATC, then P < ATC, so firm losses occur
▪ Make up firm loss with government subsidy
o Average cost pricing rule
▪ Price = ATC
▪ Normal economic profits
▪ Consumer surplus is lost
• Price discrimination:
o Needed:
▪ Market power
▪ Segregation of market with different willingness to pay
▪ No resale
o 1st Degree:
▪ based on individual differences
▪ examples: auctions, eBay, real estate purchase, bartering industries, cars, event
venues/paraphernalia, tend to be B2B etc.
o 2nd Degree:
▪ based on quantities
▪ examples: wholesalers, big box retailers, tend to be B2B
o 3rd Degree:
▪ based on group differences
▪ examples: discounts (age, occupation, local, etc.), outsiders (race, ethnicity), time,
scholarships, income, loyalty cards and coupons
• Antitrust laws preserve competition and prevent monopolies with their maximum market power from
arising in the first place
• Herfindahl-Hirschman Index (HHI) is the principle measure of concentration used by the Department of
Justice to evaluate mergers and judge monopoly power
o HHI = (S1)2 + (S2)2 + (S3)2 …
▪ Where S = percent market shares of each firm
• HHI < 1,500: industry is not concentrated
• 1,500 < HHI < 2,500: industry is moderately concentrated
• HHI > 2,500: industry is highly concentrated
Homework #8
• A monopolist sells 2,000 units for $20 each. Total costs of 2,000 units are $30,000. If the price falls to
$19, the number of units sold increases to 2,100. Total costs of 2,100 units are $30,075. When the
monopolist moves from a price of $20 to $19, the marginal revenue will:
o Decrease
• Which of the following regulatory schemes for a natural monopoly results in a normal profit for the
firm?
o Average cost pricing rule
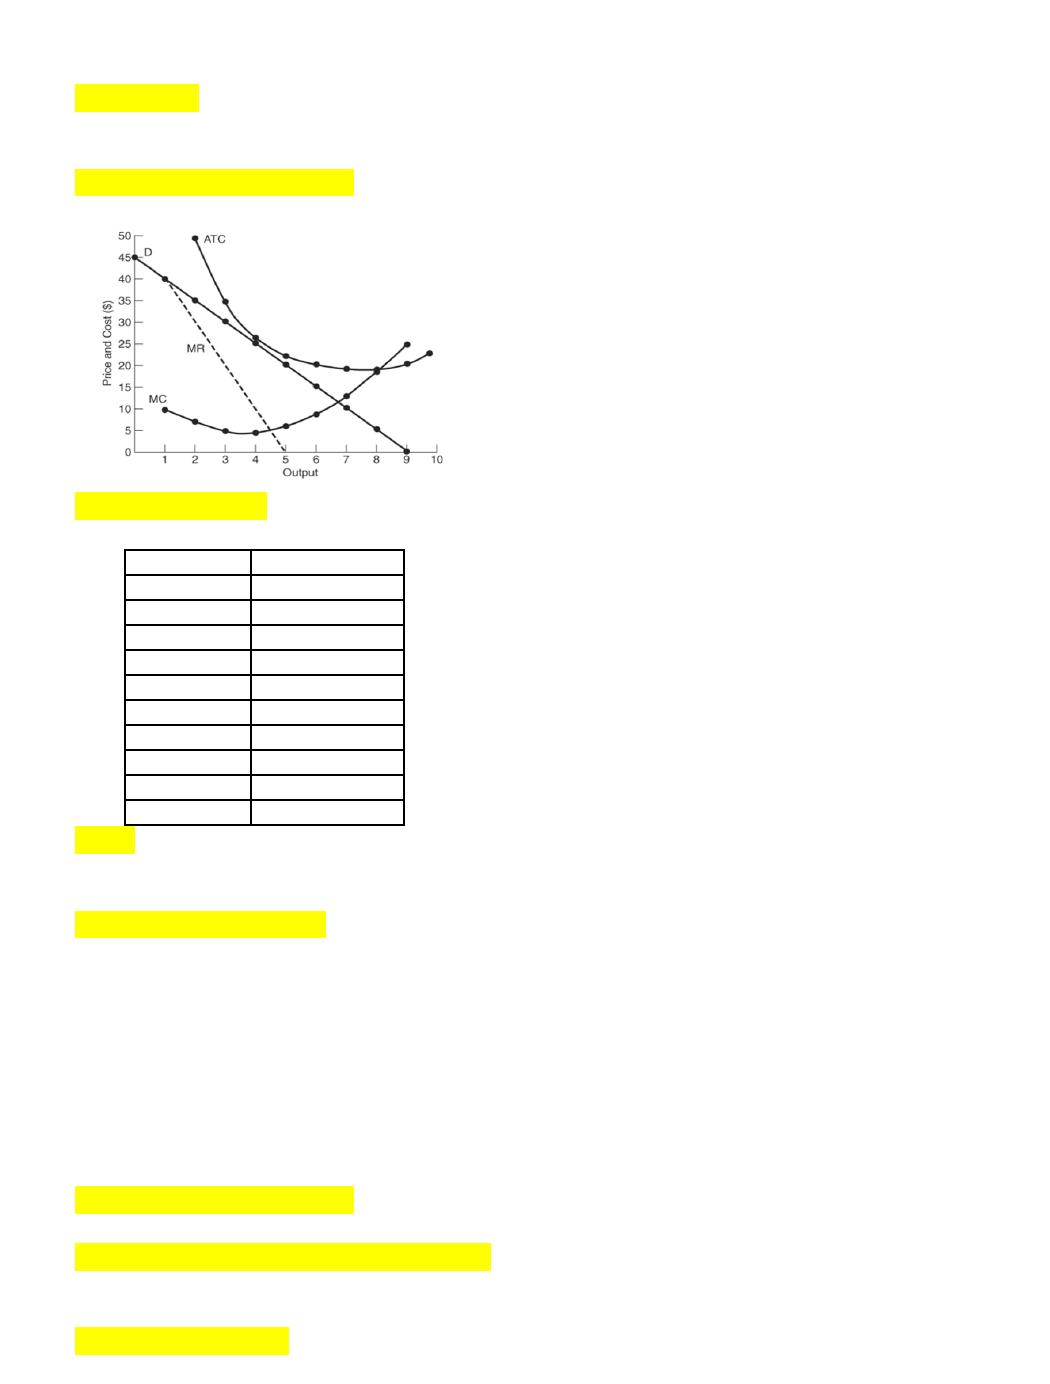
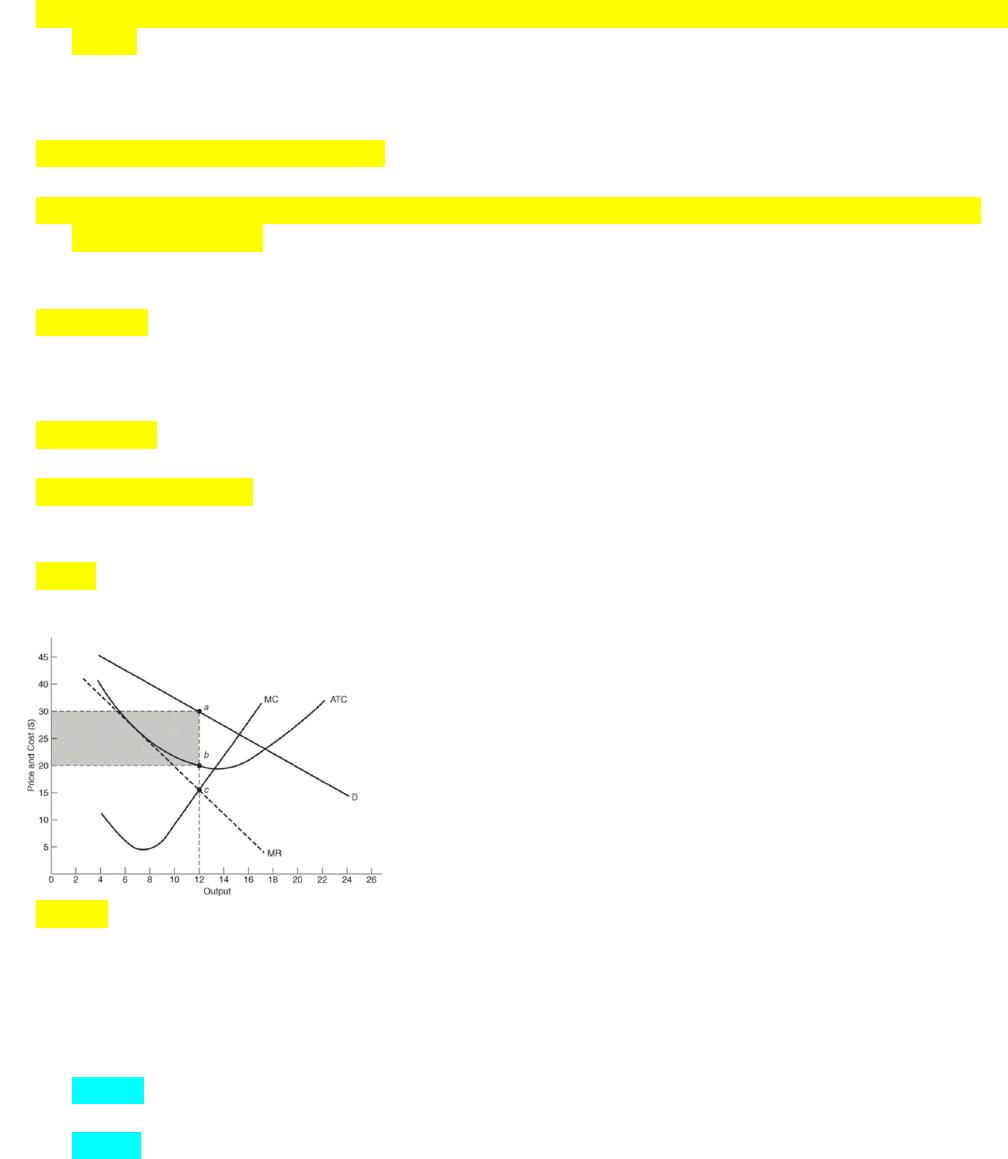
• The graph shows the cost and revenue curves for a monopolist. Referring to the graph, the monopolist:
o Will not survive
• From the information given in the table, the four-firm concentration ratio is:
Firm
Sales ($ million)
1
20
2
18
3
16
4
13
5
10
6
8
7
6
8
5
9
3
10
1
o 67
• If the electric power company hires an expensive lobby firm to persuade the utility commission to
increase its utility rate ceiling, this would represent:
o rent-seeking behavior.
• Suppose a monopolist faces the demand relationship shown in the table. If the firm is currently selling 2
units per day and wants to sell 3 units, what is the effect on total revenue?
o Total revenue rises by $5
• The demand curve facing a monopoly firm is:
o equivalent to the market demand curve.
• A constantly declining long-run average cost curve is a characteristic of what type of industrial
structure?
o Natural Monopoly
• Which of the following is NOT an example of 3rd-degree price discrimination?
Quantity Demanded
Price
1
$10
2
$8
3
$7
4
$5
5
$3
6
$2
o Customers who buy 20 rolls of toilet paper at once pay less per roll than if they bought one roll at
a time.
• Suppose a water utility company charges a residential customer $1.50 per 1,000 gallons for the first
30,000 gallons of water used, and $1.00 per 1,000 gallons for any amounts used in excess of 30,000
gallons of water. The water utility is practicing:
o 2nd-degree price discrimination.
• Price caps:
o can drive monopolies into bankruptcy if a large part of the regulated firm’s output is purchased
on the open market.
• If the monopolist charges the same price to each customer, to sell an additional unit of output requires
that the price be lowered on each unit sold. For the monopolist, this leads to:
o MR < P
• A monopolist has four distinct groups of customers. Group A has an elasticity of demand of 0.2, B has
an elasticity of demand of 0.8, C has an elasticity of demand of 1.0, and D has an elasticity of demand of
2.0. The group paying the highest price for the product will be:
o Group A
• If a monopoly firm sells more than one unit, then marginal revenue will be:
o Less than the price
• As a single seller in her area, Jasmine determined she could sell fifteen units at $12 per unit and sixteen
units at $11.25 per unit. Her marginal revenue for the sixteenth unit is:
o $0
• What is the equilibrium price for this monopolist, according to this graph?
o $30
Week Ten:
Chaing Chapter 15: Poverty and Income Distribution
• Distribution of income and wealth:
o Income is a flow measure reflecting the funds received by individuals or businesses over a
specific period
o Wealth is a measure of an individual’s or family’s assets and net of liabilities at a given time
• Functional distribution of income: splits income among the factors of production
o 2012 distribution:
▪ wages: 68.7%
▪ proprietor’s income: 9.7%
▪ rent: 4.3%
▪ corporate profits: 12.7%
▪ net interest: 4.6%
• The United States distribution of income has grown more unequal over the past three decades. Every
income quintile except the highest has declined in percentage of income.
• Lorenz Curve is a graphical measure of income inequality
o Cumulates households of various income levels on the horizontal axis
o Cumulates the share of total income on the vertical axis
• Gini Coefficient is a precise method of measuring the position of the Lorenz curve
o The lower the coefficient (closer to 0), the more equal the distribution
o The higher the coefficient (closer to 1), the more unequal the distribution
• Poverty thresholds state the income levels for various household sizes, below which people are living in
poverty; originally based on price of food
• The ratio of family income to the poverty threshold
o < 0.5 are considered severely poor
o > 0.5 but < 1 are considered poor
o > 1.0 but < 1.25 are considered near poor
• Causes of poverty:
o Lack of human capital
o Unwillingness to work/apathy
o No ability to relocate
o When costs go up, wages do not necessarily go uo
o Technological advancements