
PowerPoint Slides prepared by:
Andreea CHIRITESCU
Eastern Illinois University
PowerPoint Slides prepared by:
Andreea CHIRITESCU
Eastern Illinois University
Economic Growth
and Rising Living Standards
CHAPTER
1
© 2013 Cengage Learning. All Rights Reserved. May not be copied, scanned, or duplicated, in whole or in part, except for use as
permitted in a license distributed with a certain product or service or otherwise on a password-protected website for classroom use.
Meaning and Importance of Economic Growth
•Economic growth
–A rise in living standards
•Average standard of living
–Total output (real GDP) per person
•High real GDP per capita
–Associated with a higher quality of life
•Very low GDP per capita
–Lower quality of life for most people
2
© 2013 Cengage Learning. All Rights Reserved. May not be copied, scanned, or duplicated, in whole or in part, except for use as
permitted in a license distributed with a certain product or service or otherwise on a password-protected website for classroom use.
Table
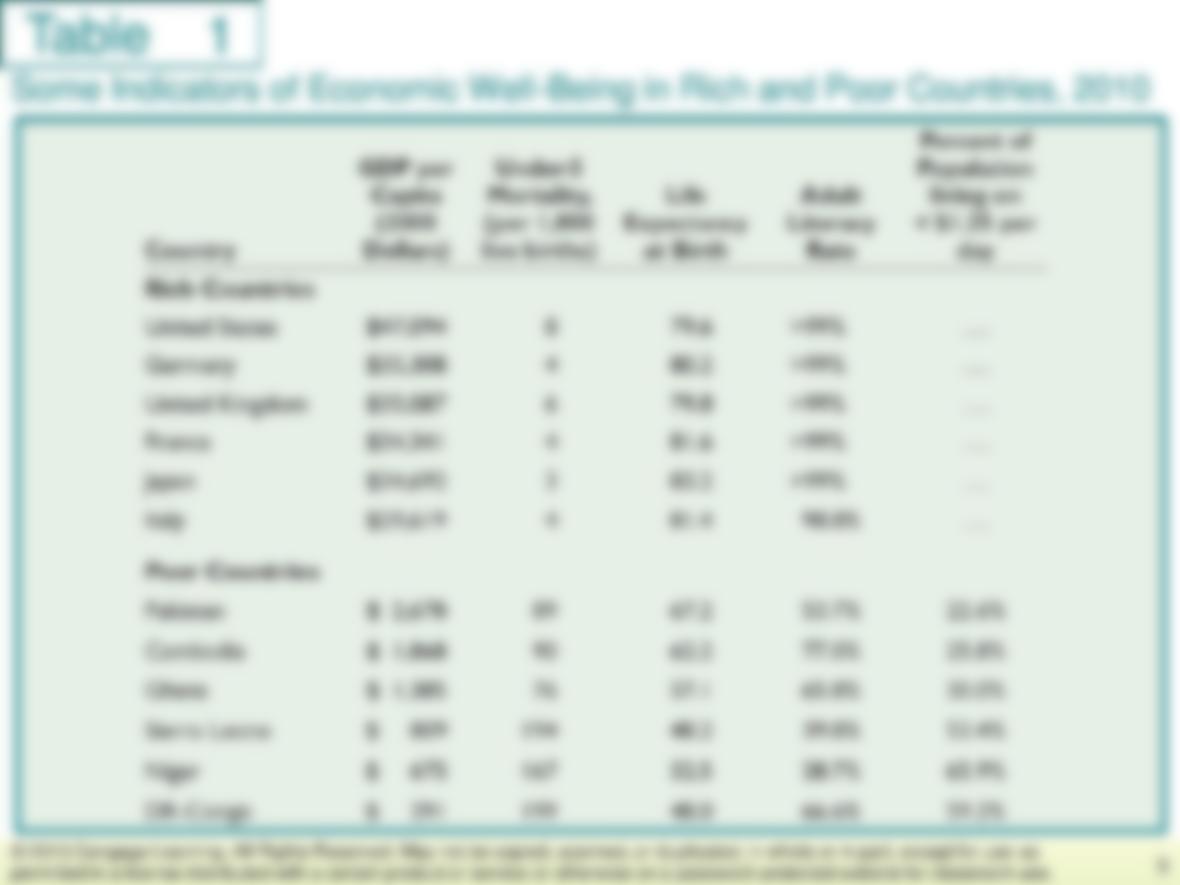
Some Indicators of Economic Well-Being in Rich and Poor Countries, 2010
3
© 2013 Cengage Learning. All Rights Reserved. May not be copied, scanned, or duplicated, in whole or in part, except for use as
permitted in a license distributed with a certain product or service or otherwise on a password-protected website for classroom use.
1

Meaning and Importance of Economic Growth
•Small growth rates in GDP
–Matter over time
•Small differences in GDP growth rate
–Matter over time
•The rule of 70
–If a variable is growing by X percent per
year
–It will double in approximately 70/X years
4
© 2013 Cengage Learning. All Rights Reserved. May not be copied, scanned, or duplicated, in whole or in part, except for use as
permitted in a license distributed with a certain product or service or otherwise on a password-protected website for classroom use.

Meaning and Importance of Economic Growth
•Growth prospects
–A country that was once poor can become
rich
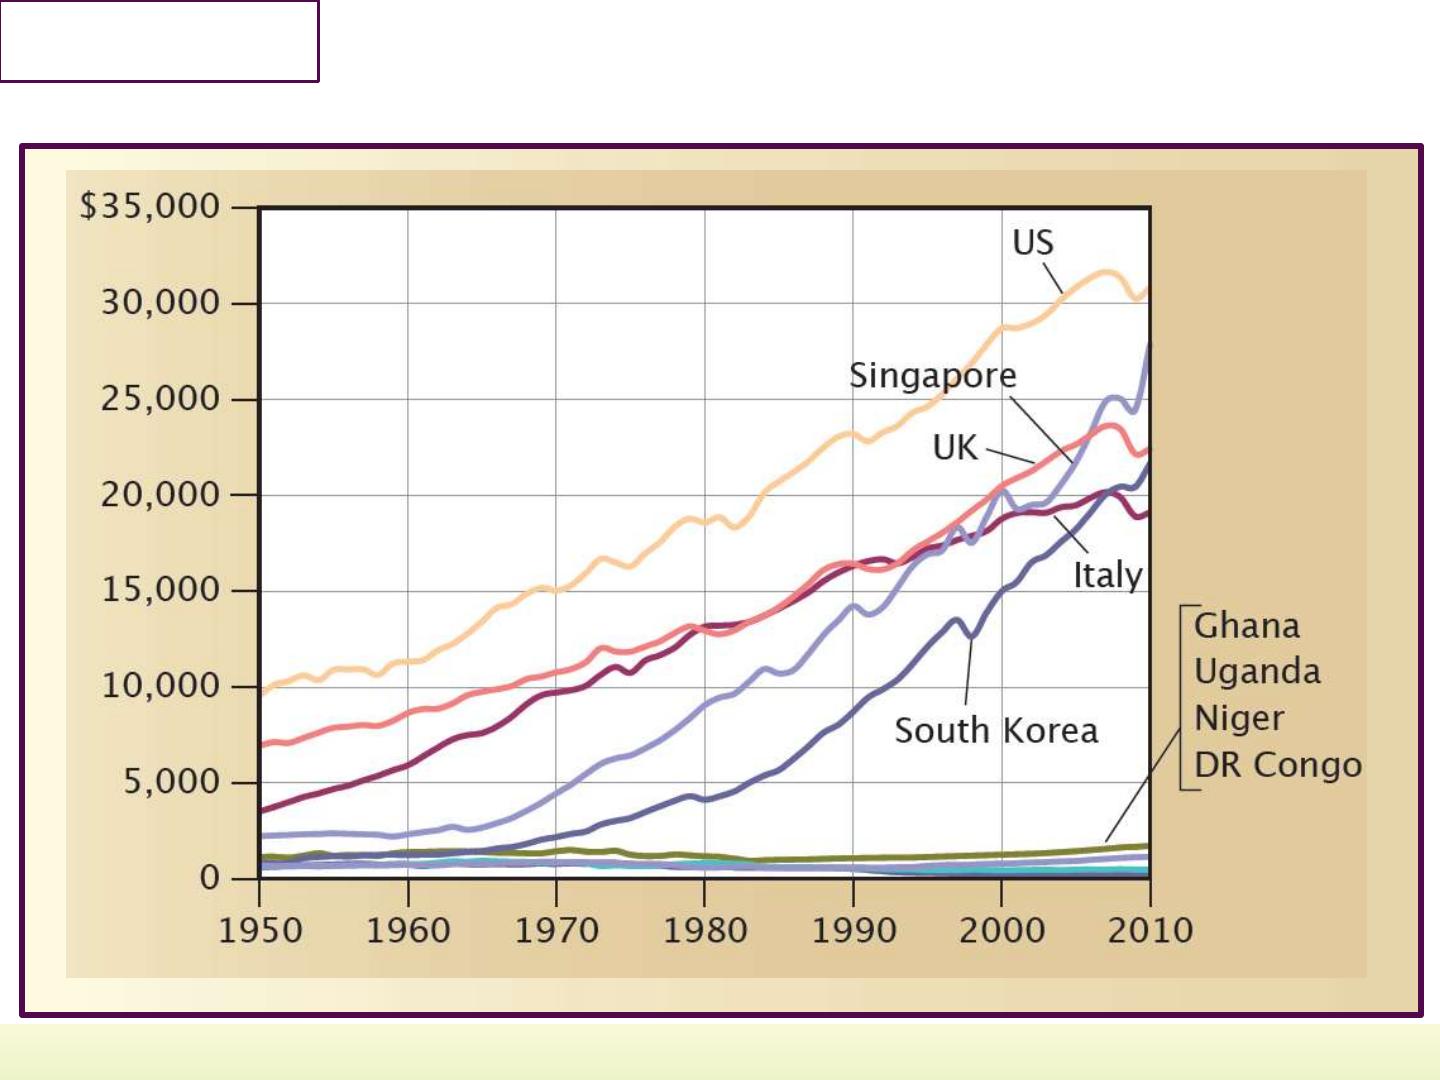
–Late 1960s: South Korea and Singapore
began growing rapidly
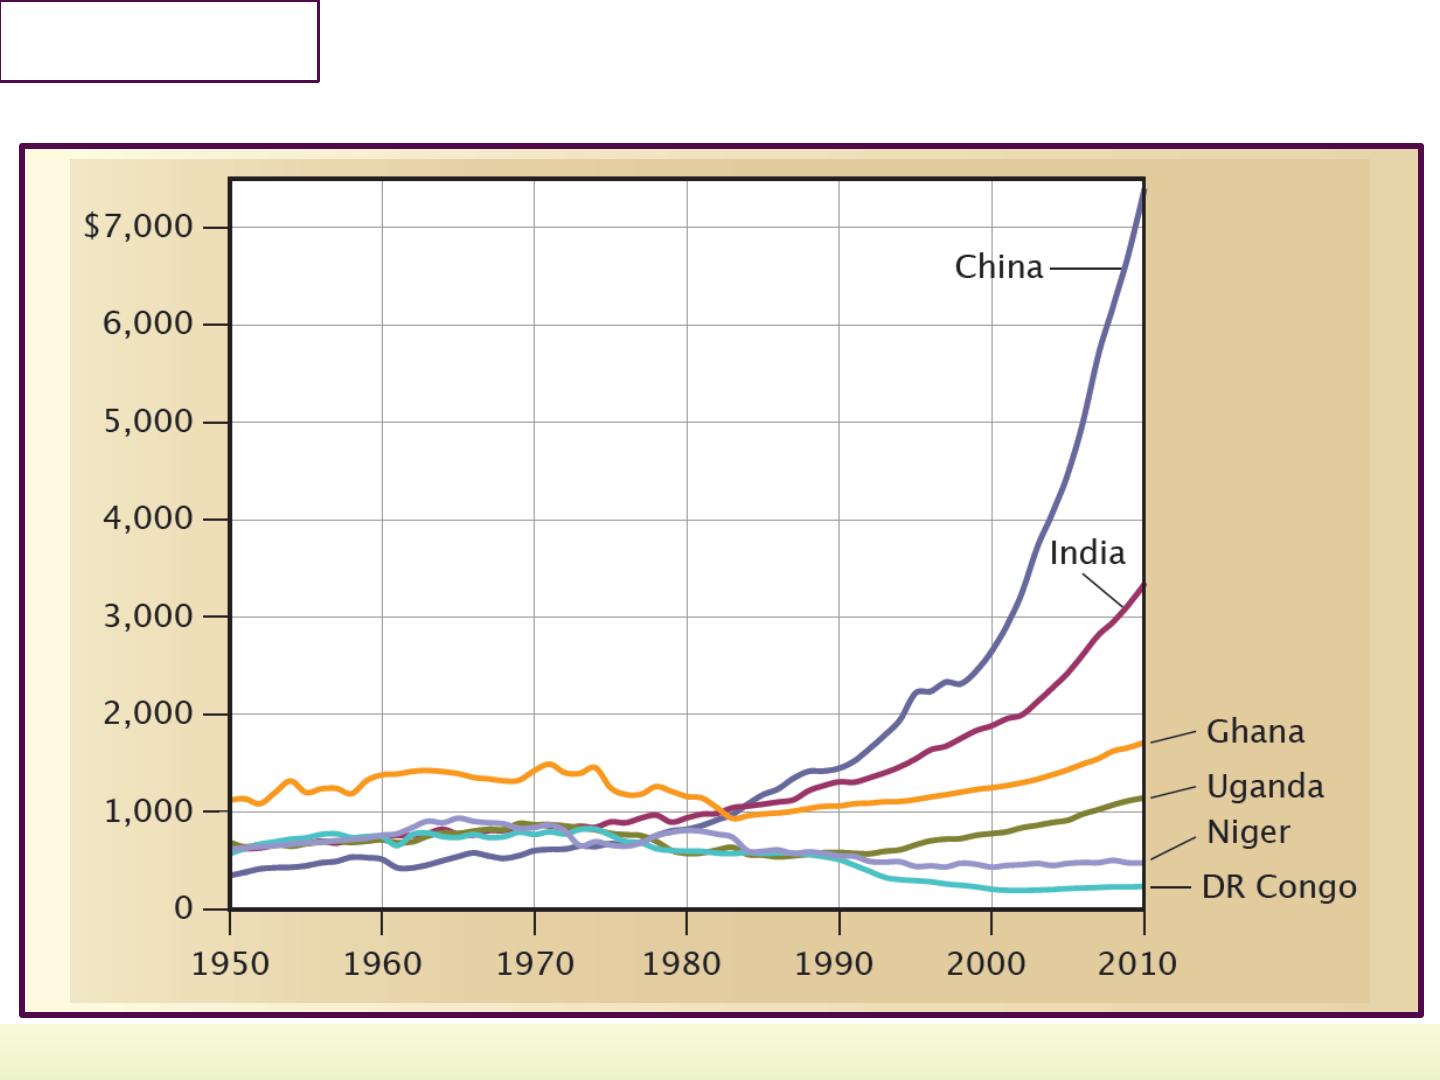
–1980s: China and India started
experiencing economic growth
5
© 2013 Cengage Learning. All Rights Reserved. May not be copied, scanned, or duplicated, in whole or in part, except for use as
permitted in a license distributed with a certain product or service or otherwise on a password-protected website for classroom use.

Meaning and Importance of Economic Growth
•Growth prospects
–Past two decades:
•Niger has stagnated
•The Democratic Republic of Congo has
deteriorated
•Ghana and Uganda began growing steadily in
the 1990s and haven’t stopped
6
© 2013 Cengage Learning. All Rights Reserved. May not be copied, scanned, or duplicated, in whole or in part, except for use as
permitted in a license distributed with a certain product or service or otherwise on a password-protected website for classroom use.
Figure
Real GDP per capita in 1990 U.S. dollars, selected countries
7
© 2013 Cengage Learning. All Rights Reserved. May not be copied, scanned, or duplicated, in whole or in part, except for use as
permitted in a license distributed with a certain product or service or otherwise on a password-protected website for classroom use.
1
Figure
Real GDP per capita in 1990 U.S. dollars: another perspective
8
© 2013 Cengage Learning. All Rights Reserved. May not be copied, scanned, or duplicated, in whole or in part, except for use as
permitted in a license distributed with a certain product or service or otherwise on a password-protected website for classroom use.
2

What Makes Economies Grow?
•Determinants of real GDP
1. The amount of output the average worker
produces in an hour
2. The number of hours the average worker
spends at the job
3. The fraction of the population that is
working
4. The size of the population
9
© 2013 Cengage Learning. All Rights Reserved. May not be copied, scanned, or duplicated, in whole or in part, except for use as
permitted in a license distributed with a certain product or service or otherwise on a password-protected website for classroom use.

What Makes Economies Grow?
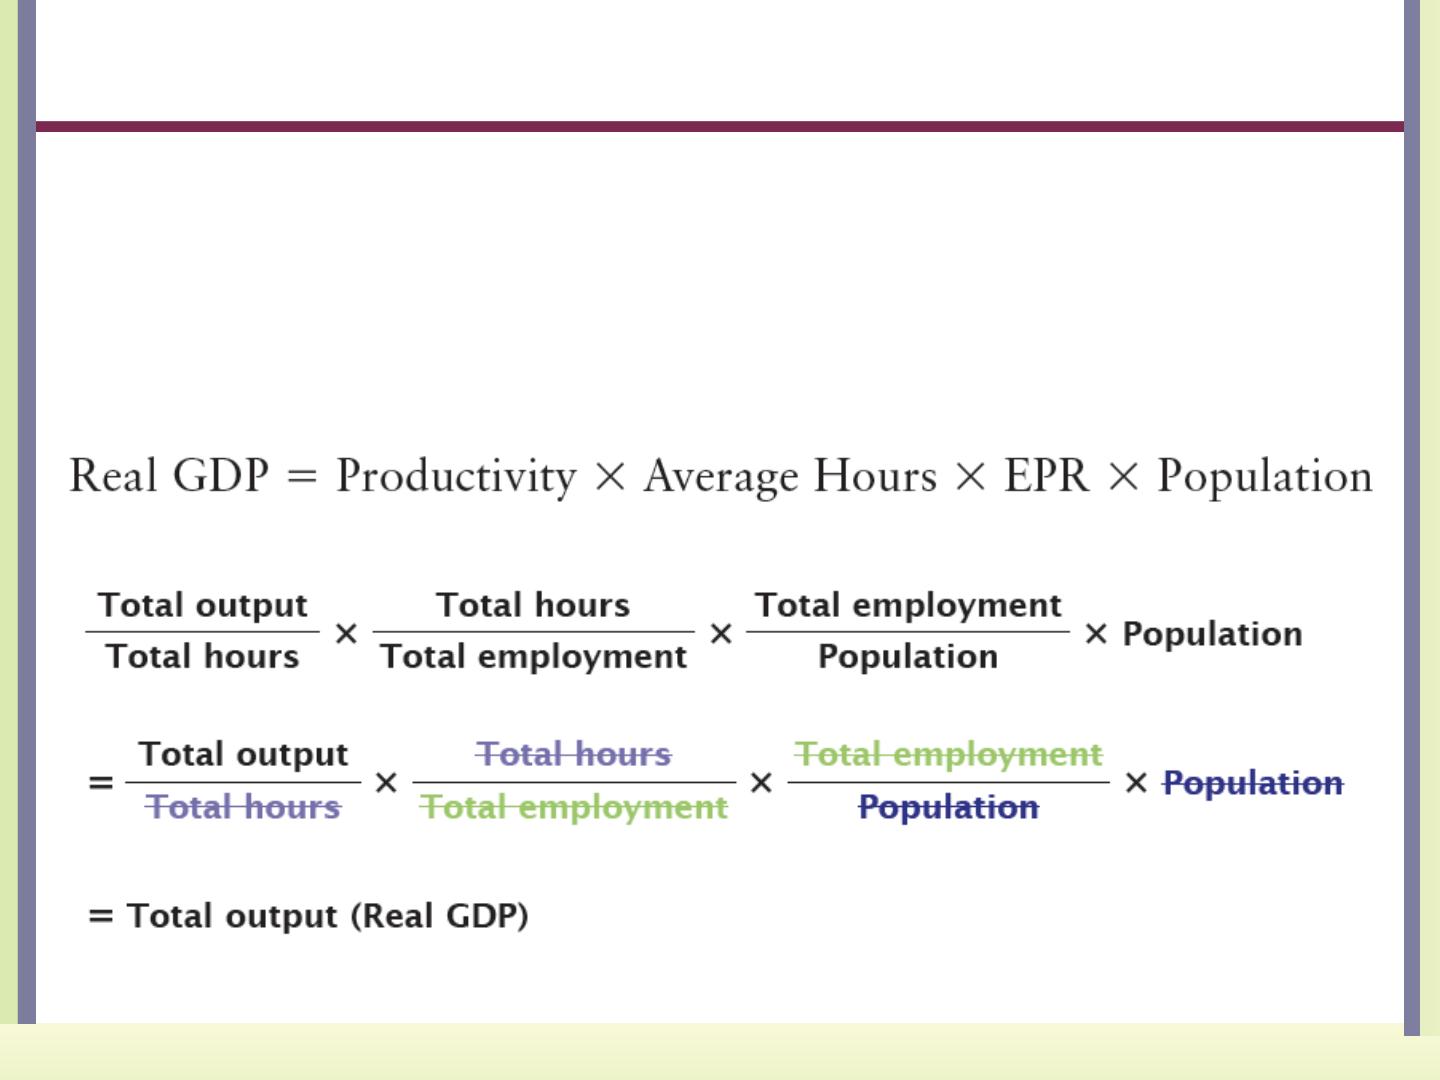
•Labor productivity
–Output produced by the average worker in
an hour
•Output per hour
–Total output divided by total hours worked
•Average hours
–Total hours divided by total employment
10
© 2013 Cengage Learning. All Rights Reserved. May not be copied, scanned, or duplicated, in whole or in part, except for use as
permitted in a license distributed with a certain product or service or otherwise on a password-protected website for classroom use.
What Makes Economies Grow?
•Employment–population ratio (EPR)
–Total employment divided by total
population
11
© 2013 Cengage Learning. All Rights Reserved. May not be copied, scanned, or duplicated, in whole or in part, except for use as
permitted in a license distributed with a certain product or service or otherwise on a password-protected website for classroom use.
What Makes Economies Grow?
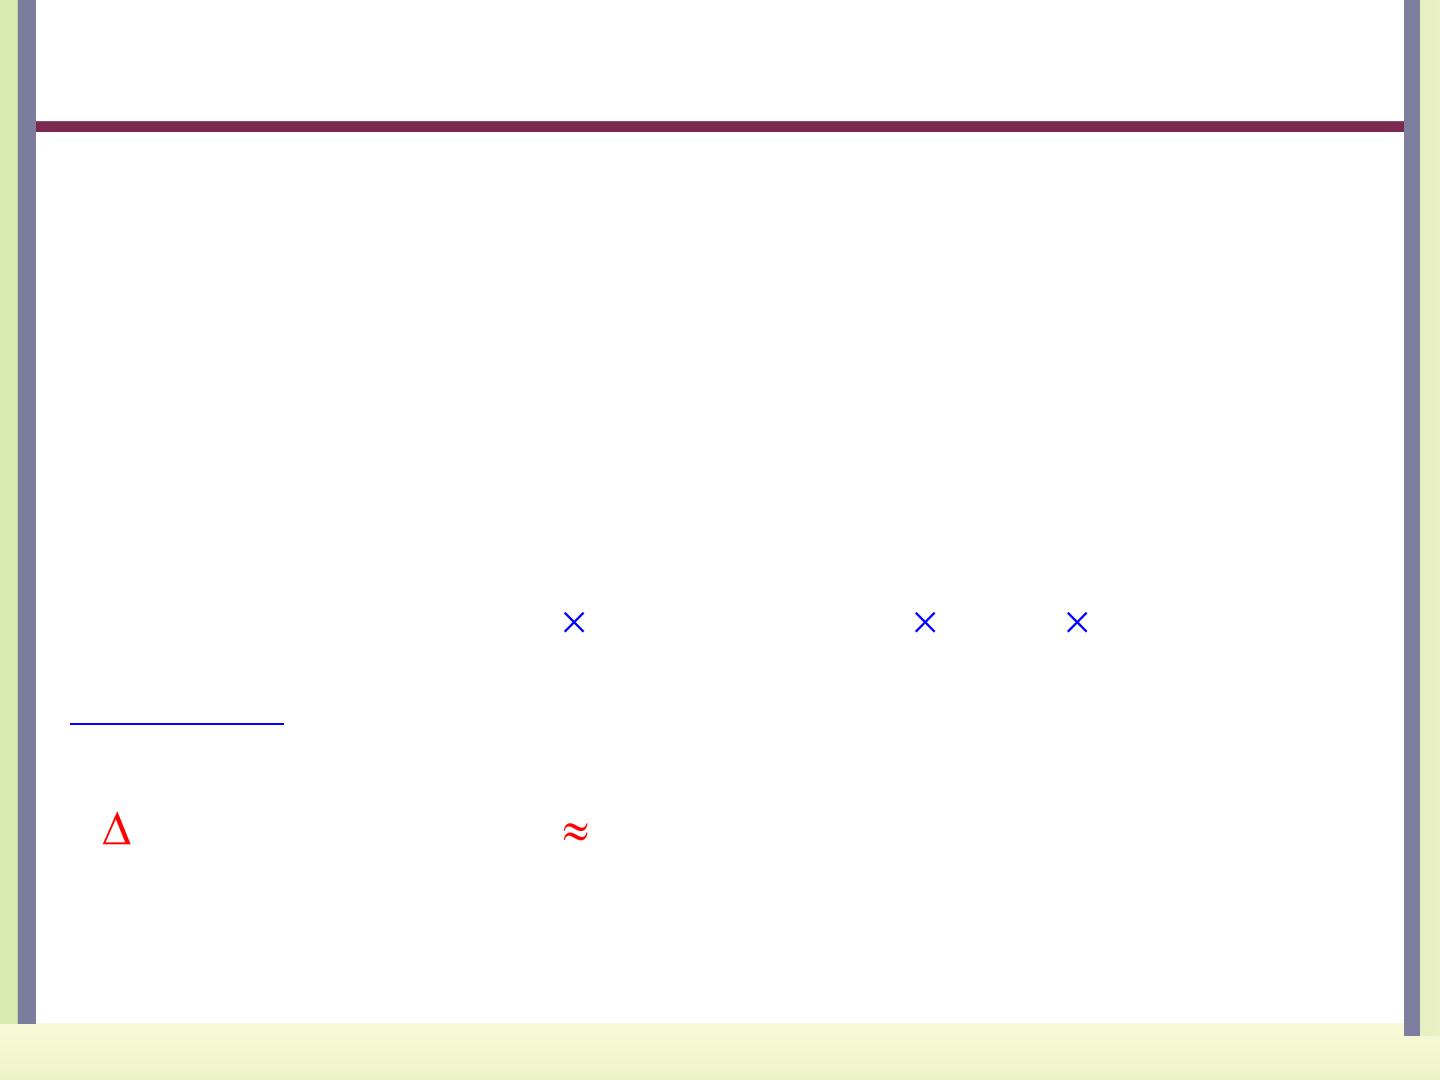
•Growth equation
–Percentage growth rate of real GDP per
capita is the sum of the growth rates of
productivity, average hours, and the
employment-population ratio
12
© 2013 Cengage Learning. All Rights Reserved. May not be copied, scanned, or duplicated, in whole or in part, except for use as
permitted in a license distributed with a certain product or service or otherwise on a password-protected website for classroom use.
Real GDP = Productivity Average Hours EPR Population
Real GDP =Productivity × Average H
% Real GDP per capita %Δ Productivity + %Δ Average Hours +
o
ur
s ×
EPR
Popula
t
n
io
+ %Δ EPR
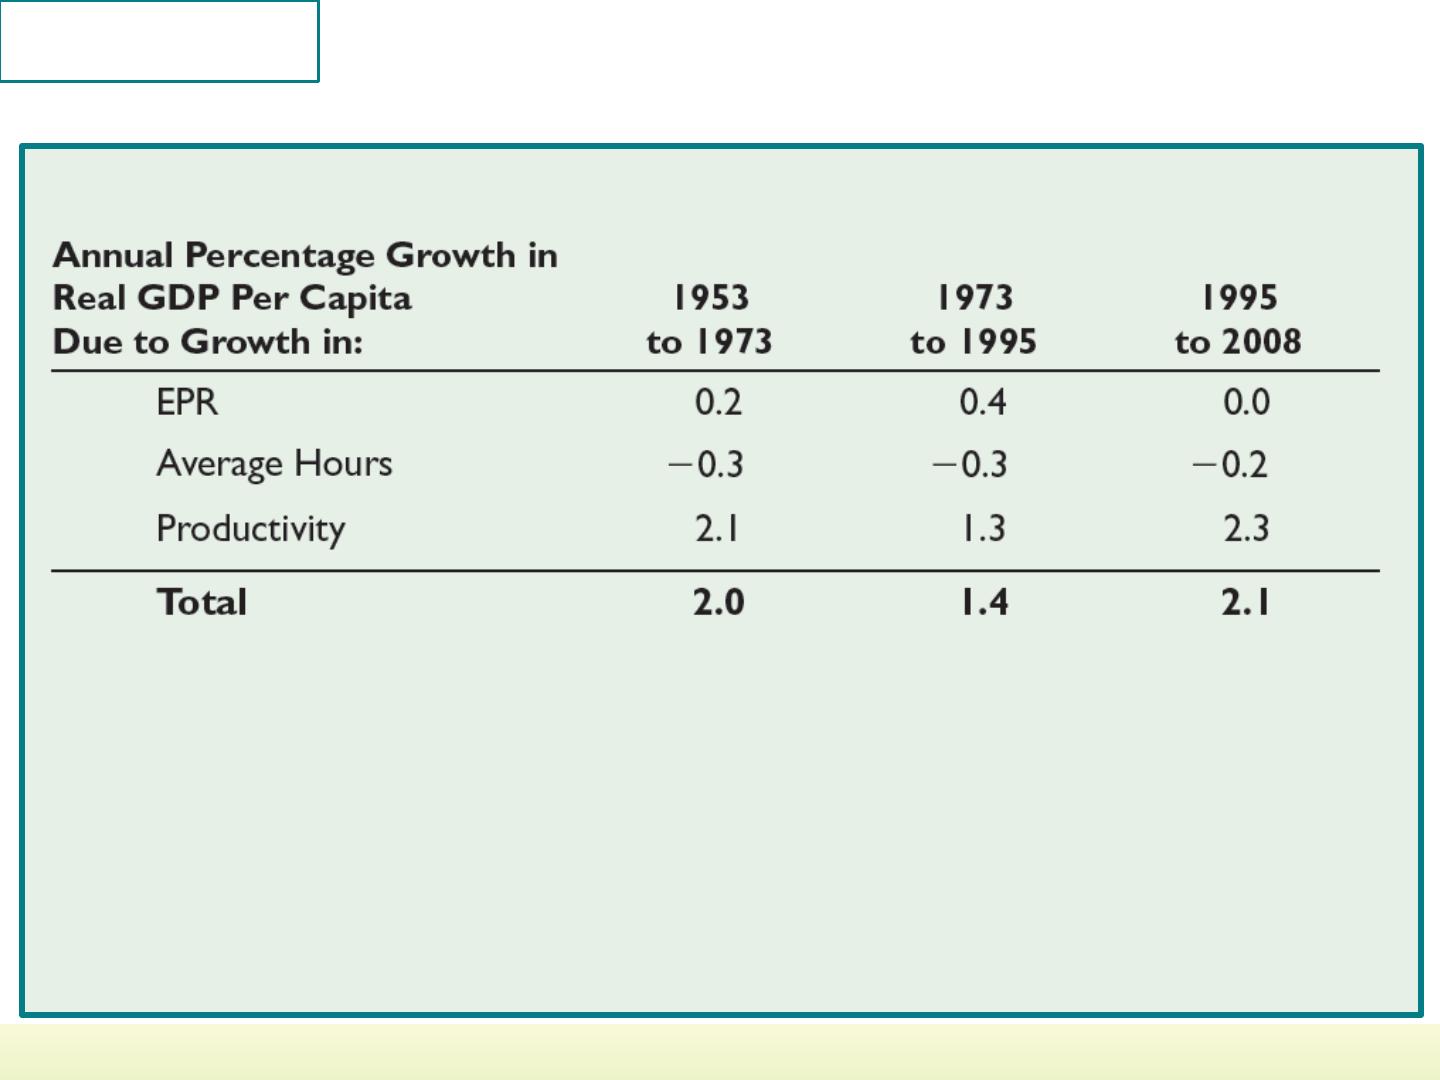
Table
Factors Contributing to Growth in U.S. Real GDP Per Capita
13
© 2013 Cengage Learning. All Rights Reserved. May not be copied, scanned, or duplicated, in whole or in part, except for use as
permitted in a license distributed with a certain product or service or otherwise on a password-protected website for classroom use.
2

Growth in the EPR
•Employment-population ratio, EPR
–Increases only when total employment
rises at a faster rate than the population
•With a given population
–Greater total employment means an
increase in the EPR, and a rise in real
GDP per capita
14
© 2013 Cengage Learning. All Rights Reserved. May not be copied, scanned, or duplicated, in whole or in part, except for use as
permitted in a license distributed with a certain product or service or otherwise on a password-protected website for classroom use.

Growth in the EPR
•Causes for total employment to rise
–An increase in labor supply
–An increase in labor demand
•Higher labor supply
–Higher employment
•Higher EPR (for a given population)
–The market-clearing wage drops
–Higher GDP
•Higher real GDP per capita (for a given
population)
15
© 2013 Cengage Learning. All Rights Reserved. May not be copied, scanned, or duplicated, in whole or in part, except for use as
permitted in a license distributed with a certain product or service or otherwise on a password-protected website for classroom use.
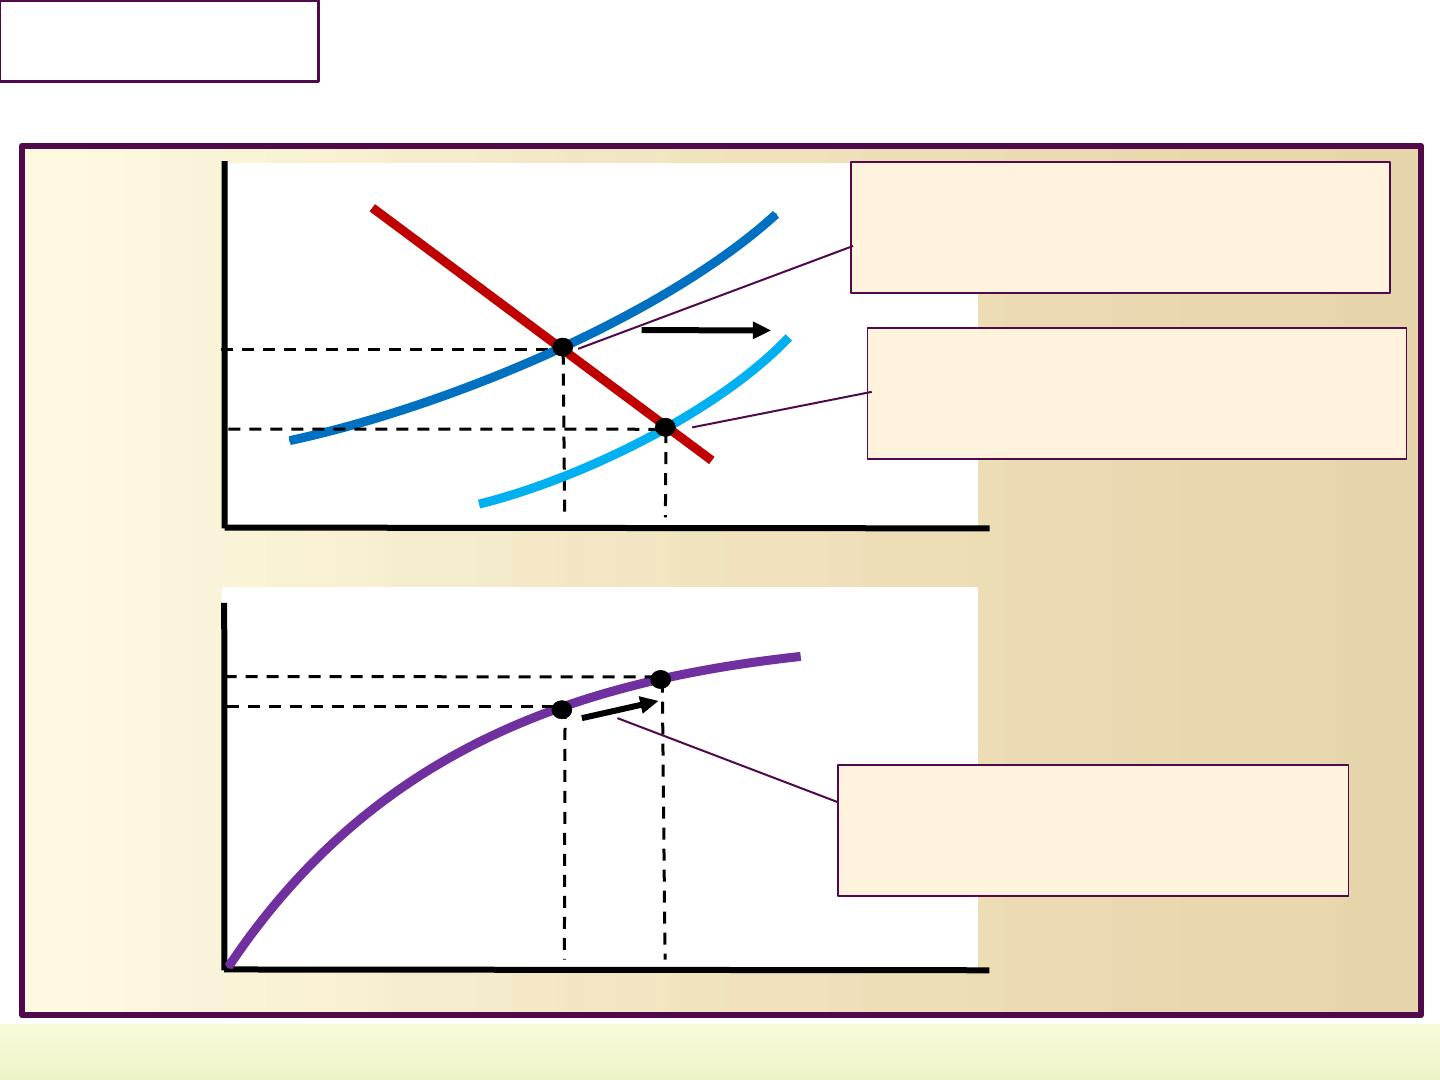
Figure
An Increase in Labor Supply
16
© 2013 Cengage Learning. All Rights Reserved. May not be copied, scanned, or duplicated, in whole or in part, except for use as
permitted in a license distributed with a certain product or service or otherwise on a password-protected website for classroom use.
3
Millions of Workers
Real
Hourly
Wage
LD
$25
150
At point A, labor supply and
demand determine an employment
level of 150 million workers.
Millions of Workers
Real
Output
150
$10 trillion
L1S
A
E
L2S
B
180
$20
An increase in labor supply raises
employment to 180 million (at point
B) although with a lower wage rate.
180
F
$11.5 trillion
With more people working, real
GDP rises from $10 trillion to
$11.5 trillion.

Growth in the EPR
•Higher labor demand
–Higher employment
–Higher market wage
•Simultaneous increase in labor demand
and supply
–Labor demand increasing faster than labor
supply
–Higher wage rate and employment
–Higher EPR
17
© 2013 Cengage Learning. All Rights Reserved. May not be copied, scanned, or duplicated, in whole or in part, except for use as
permitted in a license distributed with a certain product or service or otherwise on a password-protected website for classroom use.
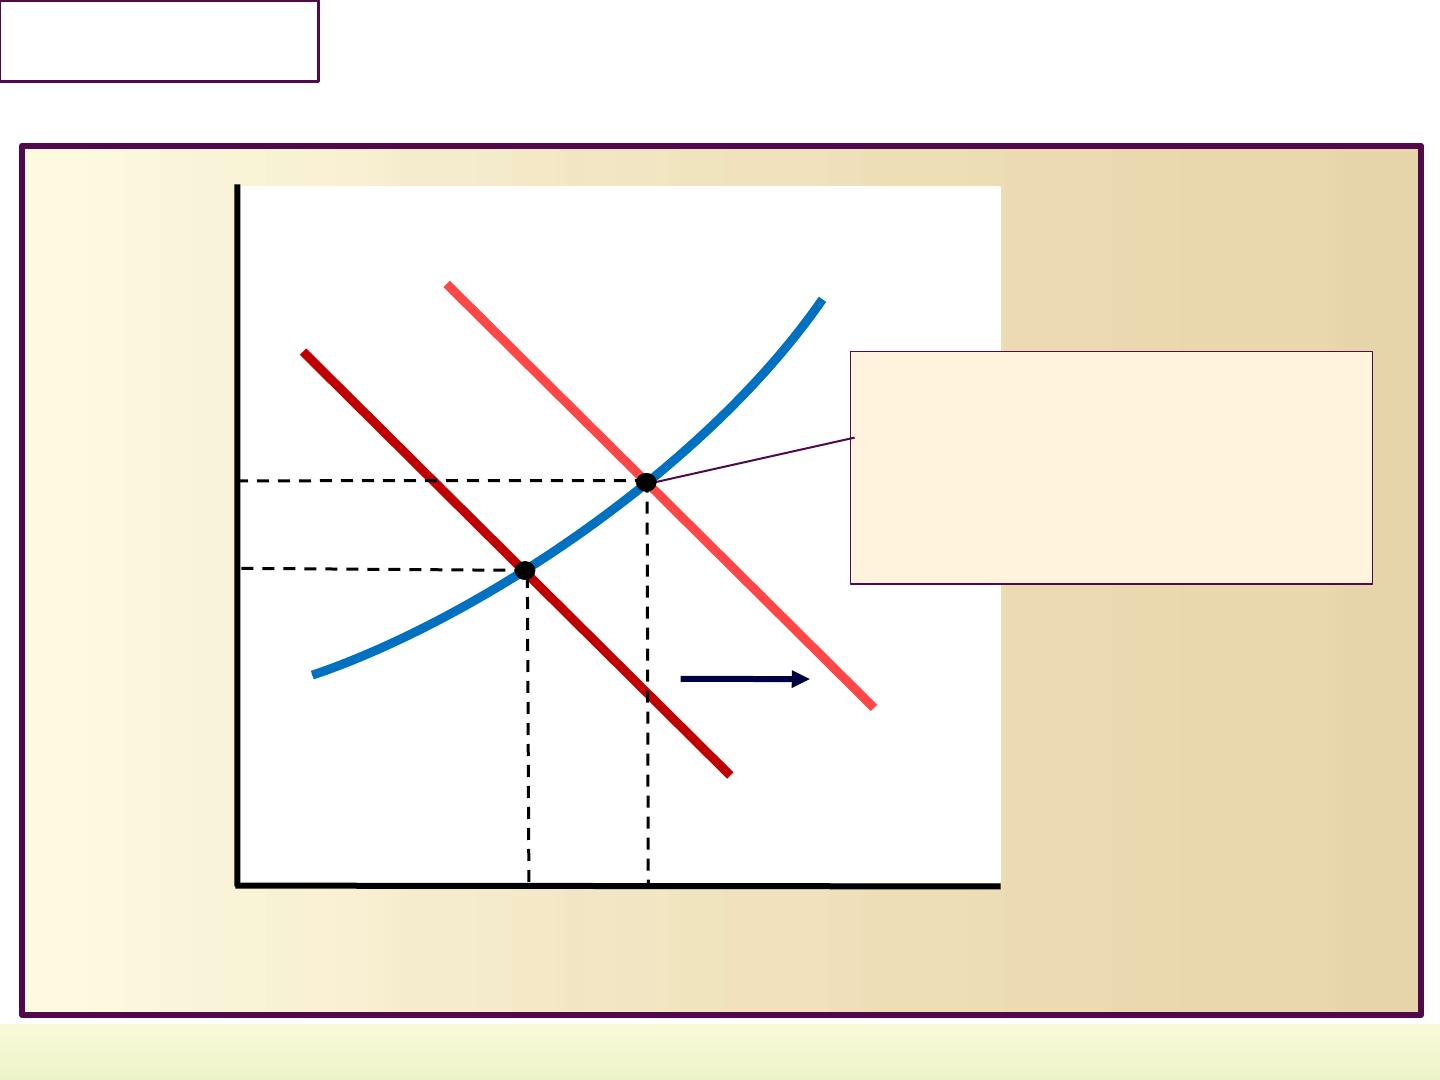
Figure
An Increase in Labor Demand
18
© 2013 Cengage Learning. All Rights Reserved. May not be copied, scanned, or duplicated, in whole or in part, except for use as
permitted in a license distributed with a certain product or service or otherwise on a password-protected website for classroom use.
4
Millions of Workers
Real
Hourly
Wage
L1D
$28
150
LS
A
180
$25
If firms demand more labor,
employment will increase—
from 150 million to 180
million—while the wage rate
rises
L2D
B

Growth in the EPR
•Government policy and the EPR
–Increasing the growth of labor supply
•Decrease in income tax rates
–Increase the reward for working
•Cut in certain benefit programs
–Increasd hardship of not working
–Increasing the growth of labor demand
•Increase the skills of the workforce
•Subsidize employment more directly
© 2013 Cengage Learning. All Rights Reserved. May not be copied, scanned, or duplicated, in whole or in part, except for use as
those same workers could
produce $12 trillion of real
GDP.
22
© 2013 Cengage Learning. All Rights Reserved. May not be copied, scanned, or duplicated, in whole or in part, except for use as
permitted in a license distributed with a certain product or service or otherwise on a password-protected website for classroom use.
Millions
of Workers
150
$10 trillion A
27
© 2013 Cengage Learning. All Rights Reserved. May not be copied, scanned, or duplicated, in whole or in part, except for use as
permitted in a license distributed with a certain product or service or otherwise on a password-protected website for classroom use.
per Year
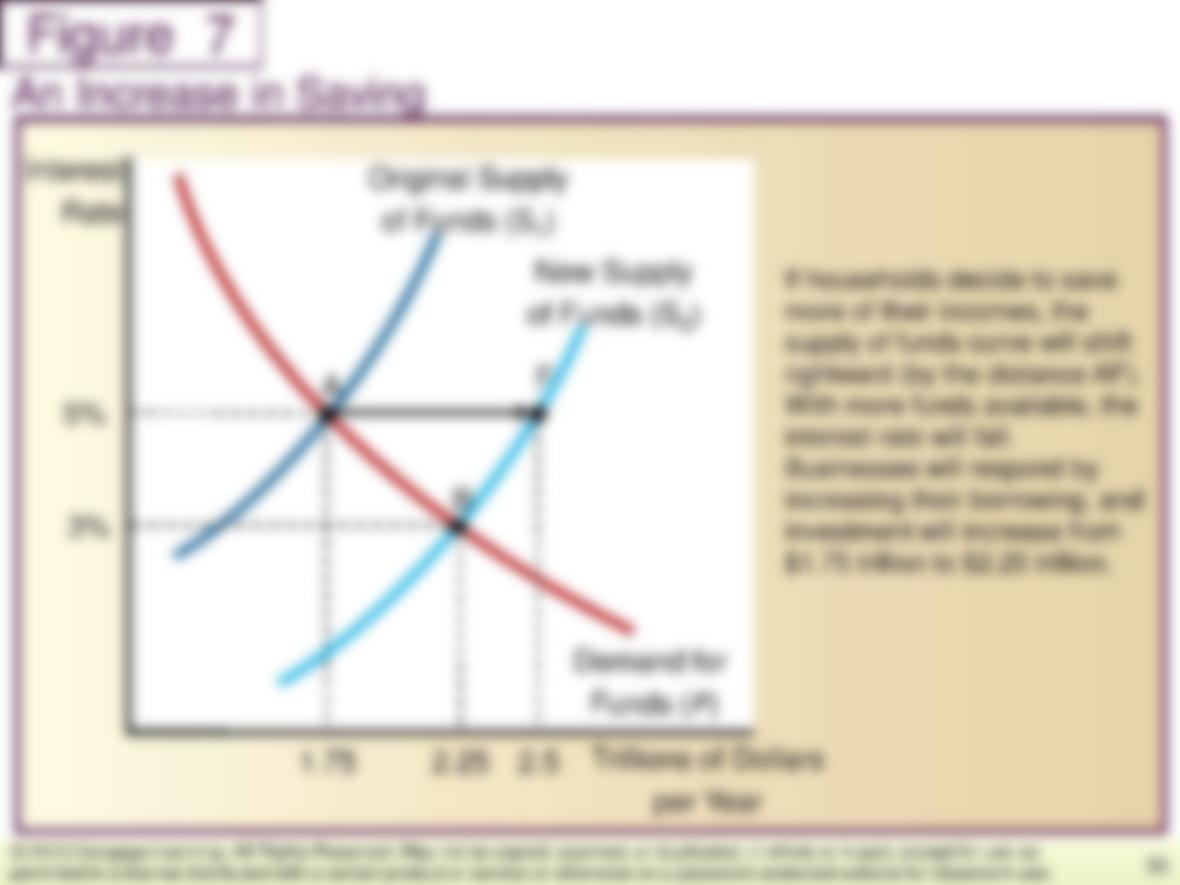
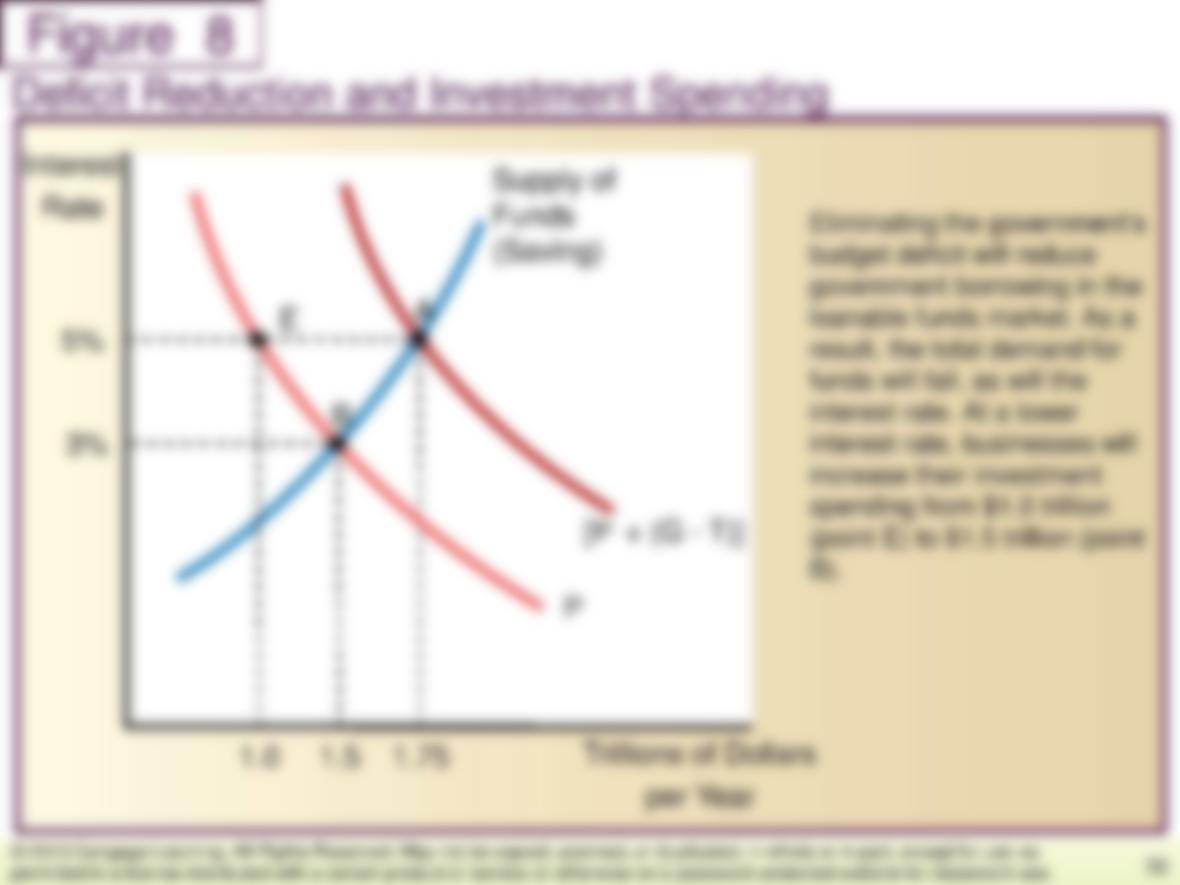
investment will increase from
$1.75 trillion to $2.25 trillion.
30
© 2013 Cengage Learning. All Rights Reserved. May not be copied, scanned, or duplicated, in whole or in part, except for use as
permitted in a license distributed with a certain product or service or otherwise on a password-protected website for classroom use.
Trillions of Dollars
per Year
1.75
3%
Demand for
Funds (Ip)
2.25
2.5
32
© 2013 Cengage Learning. All Rights Reserved. May not be copied, scanned, or duplicated, in whole or in part, except for use as
permitted in a license distributed with a certain product or service or otherwise on a password-protected website for classroom use.
per Year




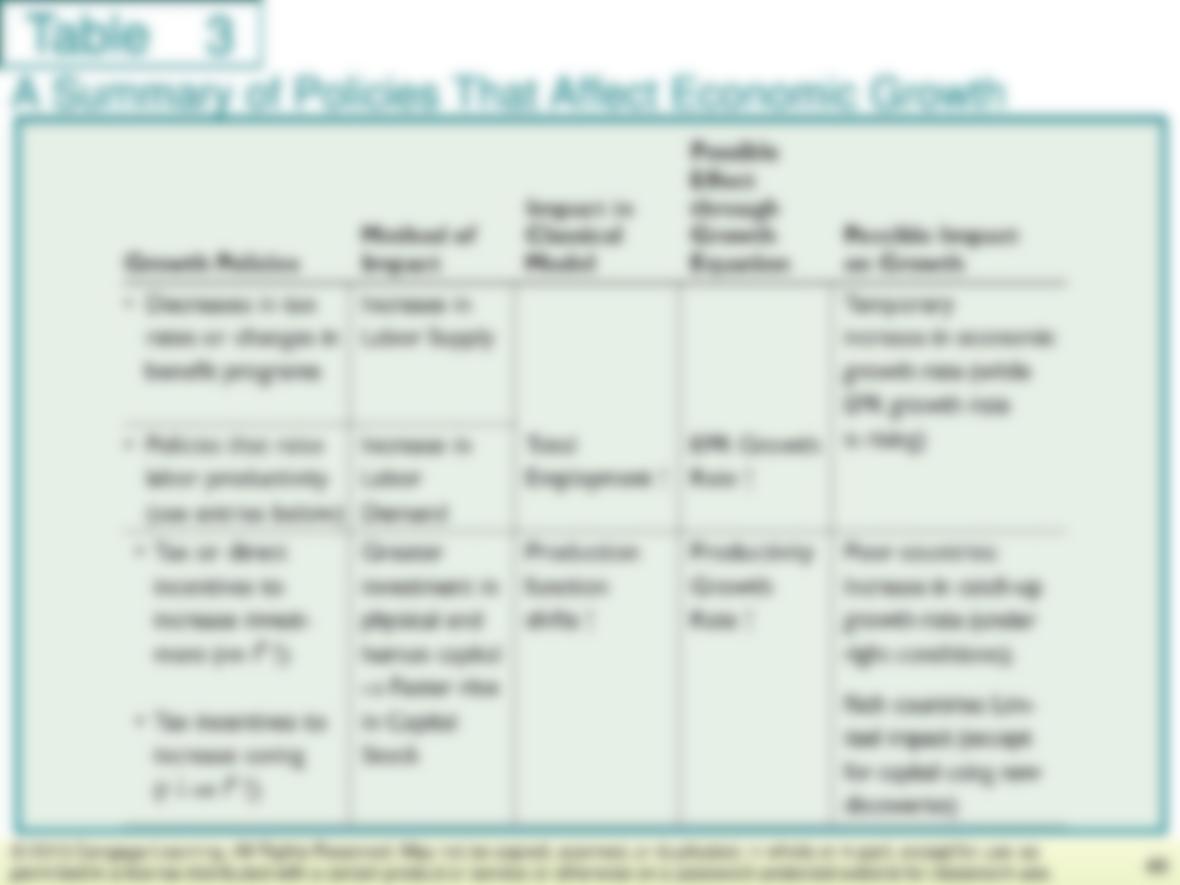
A Summary of Policies That Affect Economic Growth
46
© 2013 Cengage Learning. All Rights Reserved. May not be copied, scanned, or duplicated, in whole or in part, except for use as
permitted in a license distributed with a certain product or service or otherwise on a password-protected website for classroom use.
A Summary of Policies That Affect Economic Growth
47
© 2013 Cengage Learning. All Rights Reserved. May not be copied, scanned, or duplicated, in whole or in part, except for use as
permitted in a license distributed with a certain product or service or otherwise on a password-protected website for classroom use.
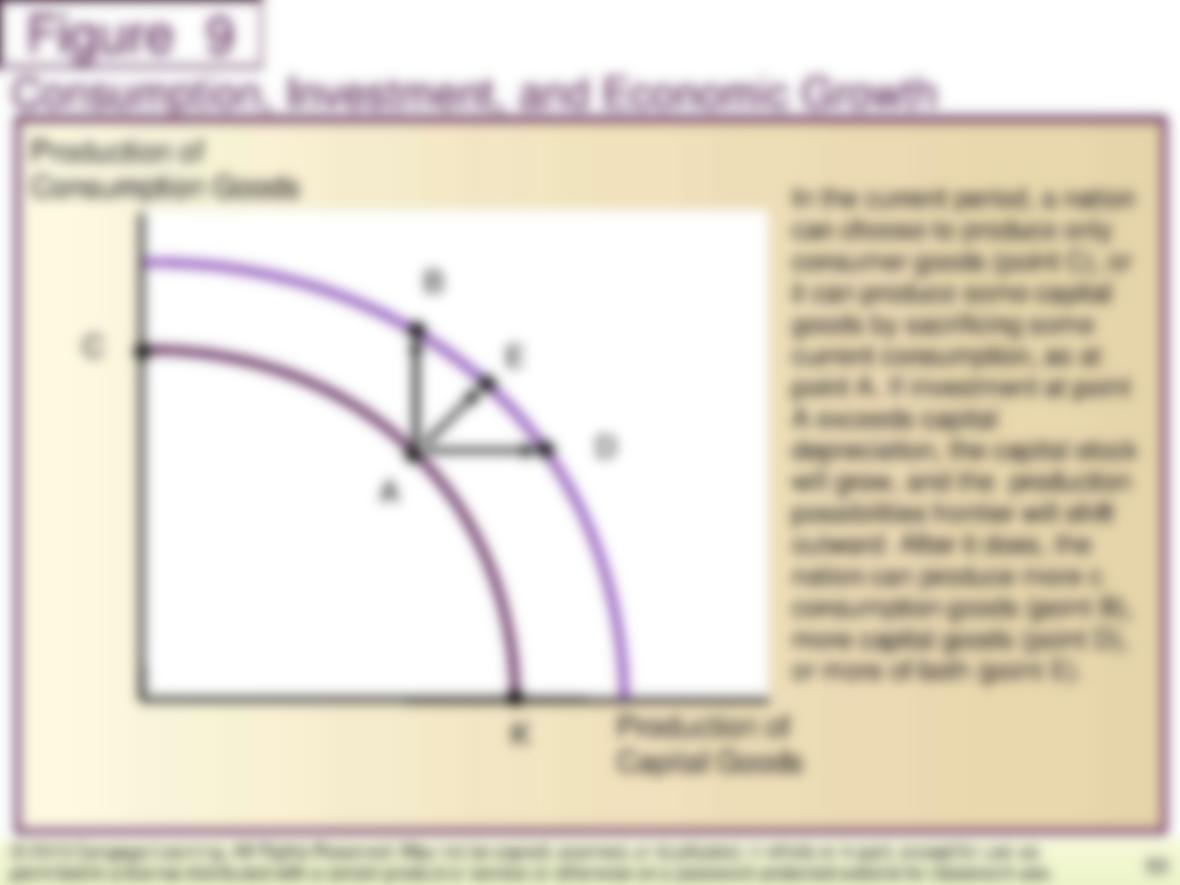
it can produce some capital
goods by sacrificing some
current consumption, as at
point A. If investment at point
A exceeds capital
depreciation, the capital stock
will grow, and the production
possibilities frontier will shift
outward. After it does, the
nation can produce more c
consumption goods (point B),
more capital goods (point D),
or more of both (point E).
50
© 2013 Cengage Learning. All Rights Reserved. May not be copied, scanned, or duplicated, in whole or in part, except for use as
permitted in a license distributed with a certain product or service or otherwise on a password-protected website for classroom use.
Production of
Capital Goods
A
C
K
D
E
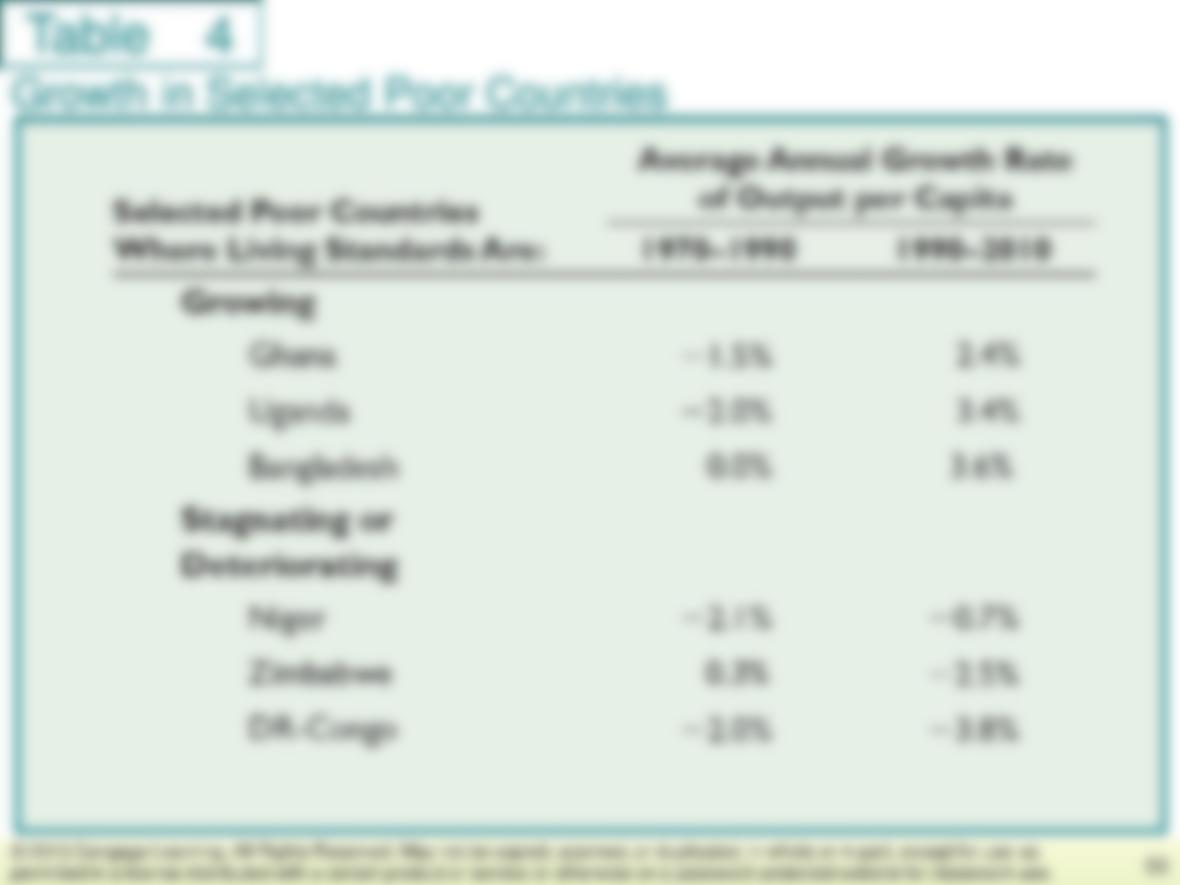
Growth in Selected Poor Countries
53
© 2013 Cengage Learning. All Rights Reserved. May not be copied, scanned, or duplicated, in whole or in part, except for use as
permitted in a license distributed with a certain product or service or otherwise on a password-protected website for classroom use.
55
© 2013 Cengage Learning. All Rights Reserved. May not be copied, scanned, or duplicated, in whole or in part, except for use as
permitted in a license distributed with a certain product or service or otherwise on a password-protected website for classroom use.
Capital Goods

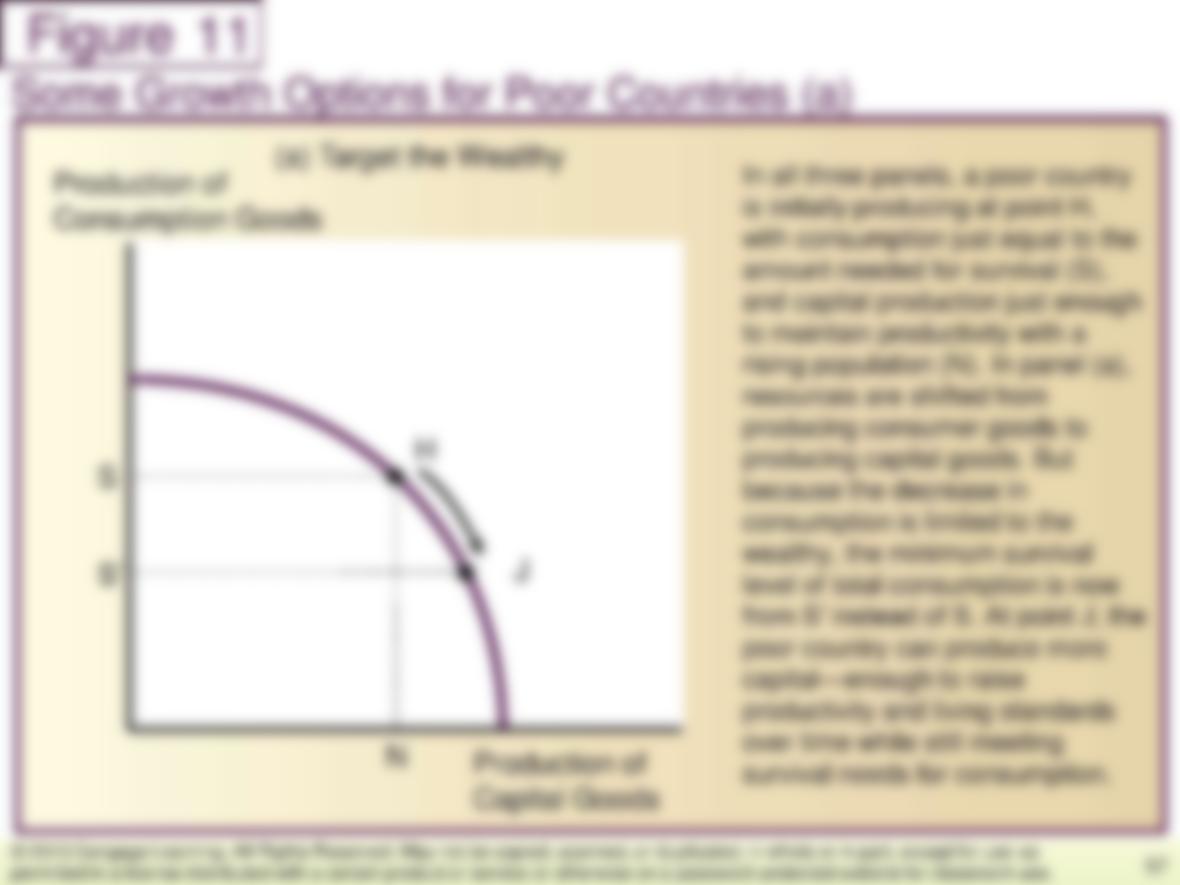
level of total consumption is now
from S′ instead of S. At point J, the
poor country can produce more
capital—enough to raise
productivity and living standards
over time while still meeting
survival needs for consumption.
57
© 2013 Cengage Learning. All Rights Reserved. May not be copied, scanned, or duplicated, in whole or in part, except for use as
permitted in a license distributed with a certain product or service or otherwise on a password-protected website for classroom use.
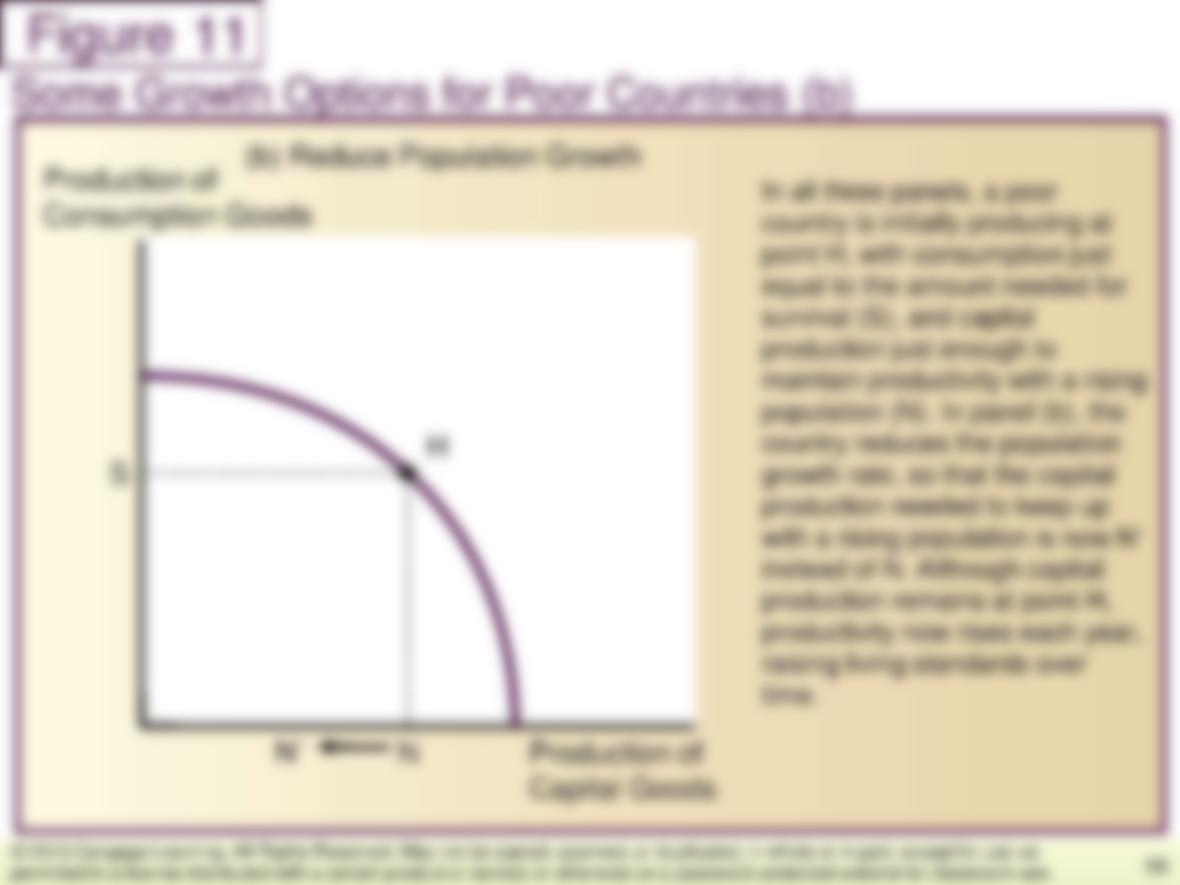
Production of
Capital Goods
N
58
© 2013 Cengage Learning. All Rights Reserved. May not be copied, scanned, or duplicated, in whole or in part, except for use as
permitted in a license distributed with a certain product or service or otherwise on a password-protected website for classroom use.
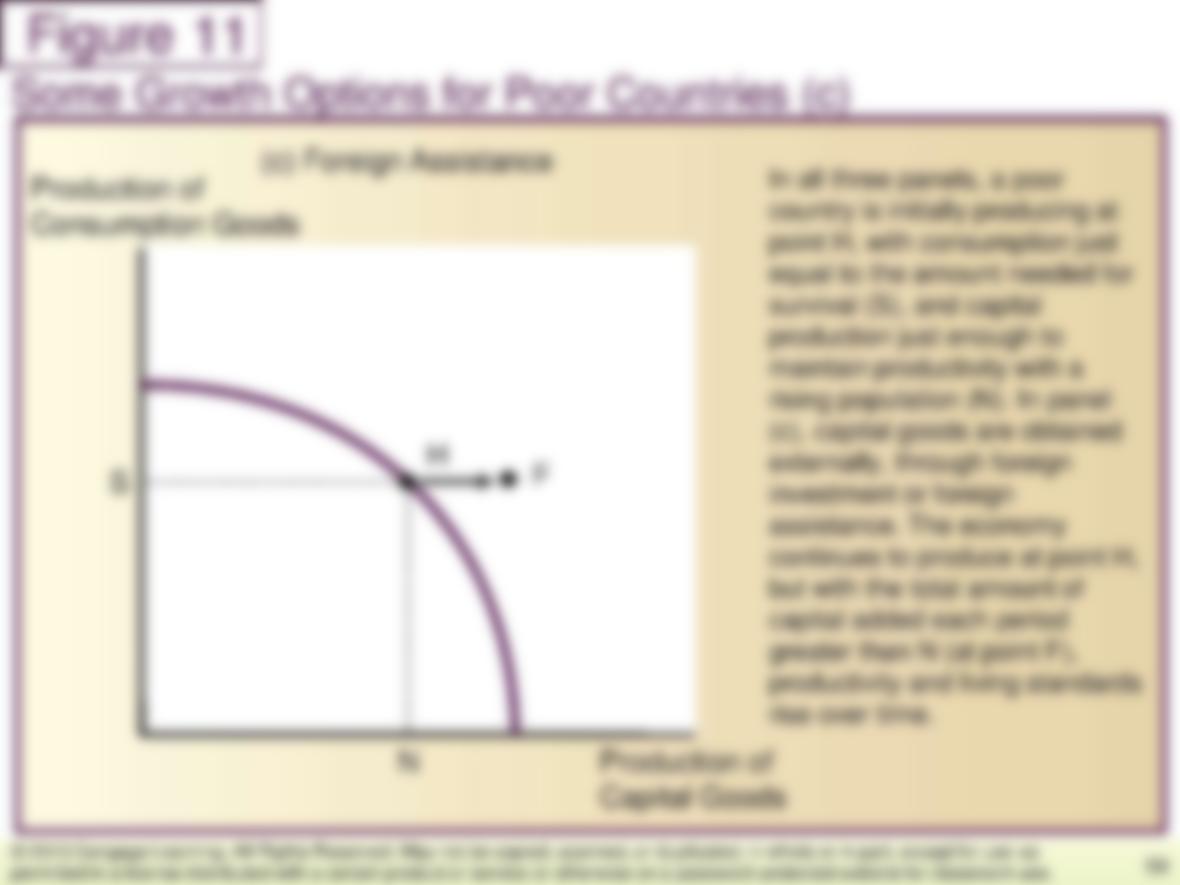
Capital Goods
59
© 2013 Cengage Learning. All Rights Reserved. May not be copied, scanned, or duplicated, in whole or in part, except for use as
permitted in a license distributed with a certain product or service or otherwise on a password-protected website for classroom use.
Capital Goods