Micro Economics
C1
Micro niveau
it’s always about costs and benefits.
– Understanding the basic concets of micrroeconmics
how markets work, how consumers and procucers make their decisions
– Understanding why market can fail and the influence of government interventron on the
economy
– Applying these basics concepts and calculate prices and output in different makret structures
……………
See course guide for the relevant chapters
7 van de 9 quiz moeten boven de 55% zijn → effort requirements anders geen examen toegang.
Voorbereiding voor de (niet verplichte) hoorcolleges, lees de hoofdstukken van de week.
Je mag maar max 2 tutorials(werkcollege) missen. Anders bel voor 9:30 secratary.
3 meetings per week:
– Practice group Tuesday (free)
– Lectures Wednesday (free)
– Tutorials Friday (compulsary)
Scarcity: having more of one good thing usually means having less of another. (limited income,
limited time, limited resources,
➔ Budget restrictions
➔ Time restrictions
➔ Space restrictions
Samenvatting hoofdstuk 1 Introduction: Markets and Prices
Economics studies the allocation of scarce resources.
Microeconomics in particular deals with the constituting individual entities of an economy, that is the
consumers, firms, workers etc. Describes and analyses the trade-offs these entities face. Investigates
the role of prices and how they are determined.
Important themes in microeconomics are
-Trade-offs
-Prices -Markets
-Theories and Models
-Positive analysis (cause and effect) versus Normative analysis (what ought to be)
Individual economic units can be divided in two broad groups according to function- buyers and
sellers. Together, buyers and sellers interact to form markets. A market is the collection of buyers
and sellers that, through their actual or potential interactions, determine the price of a
product/products. On a competitive market a single price will prevail (individual buyers do not
influence price significantly), while on noncompetitive markets different prices are charged by
distinct firms. A market includes more than one industry. An Industry is a collection of firms that sell
the same or closely related products, in effect this is the supply side of the market.
Definitions related to markets:
Market: collection of buyers and sellers that, through their actual or potential interactions determine
the price of a product or set of products.
cartel: a group of producers that acts collectively
arbitrage: practice of buying at a low price at one location and selling at a higher price in another.
extend of a market: boundaries of a market, both geographical and in terms of range of products
produced and sold within it.
market price: price prevailing in a competitive market.
perfectly competitive market: market with many buyers and sellers, so that no single buyer or seller
has a significant impact on price.
market definition: determination of the buyers sellers, and range of products that should be
included in a particular market.
Definitions related to prices:
nominal price: absolute price of a good, unadjusted for inflation
real price: price of a good relative to an aggregate measure of prices; adjusted for inflation
CPI-consumer price index: measure of the aggregate price level
PPI-producer price index: measure of the aggregate price level for intermediate products and
wholesale goods
Positive analysis: analysis describing relationships of cause and effect.
normative analysis: analysis examining questions of what ought to be.
Samenvatting hoofdstuk 2 Supply, Demand, & Equilibrium
The supply-demand model combines two important concepts:
supply curve: Relationship between the quantity of a good that producers are willing to sell and
the price of the good. QS =QS(P)
The supply curve slopes upward. The higher the price, the more that firms are able and willing to sell.
The response of quantity supplied to changes in price can be represented by movements along the
supply curve. The response of supply to changes in other supply-determining variables (costs, wages
etc.) is shown graphically as a shift of the supply curve itself.
demand curve: Relationship between the quantity of a good that consumers are willing to buy and
the price of the good. QD =QD(P)
The demand curve slopes downward. Consumers usually are ready to buy more if the price is lower.
Price changes results in movement along the curve, change in variables such as consumer income
result in a shift of the supply curve itself.
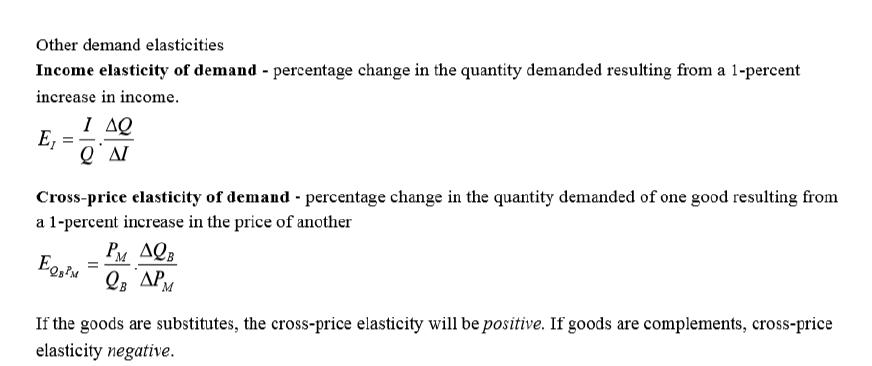
Changes in price of related goods also affect demand. Goods are substitutes when an increase in the
price of one leads to an increase in the quantity demanded of the other. Goods are complements
when an increase in the price of one leads to a decrease in the quantity demanded of the other.
The market mechanism
The supply and demand curve intersect at the equilibrium, or market-clearing, price and quantity.
At this price, the quantity supplied and quantity demanded are equal. The market mechanism is the
tendency in a free market for the price to change until the market clears.
Surplus = a situation in which the quantity supplied exceeds quantity demanded
Shortage = situation in which the quantity demanded exceeds the quantity supplied
Elasticities of supply and demand
Elasticity: is a measure of the sensitivity of one variable with respect to changes in another variable.
The number tells us the percentage change that will occur in one variable in response to a 1-percent
change in another variable.
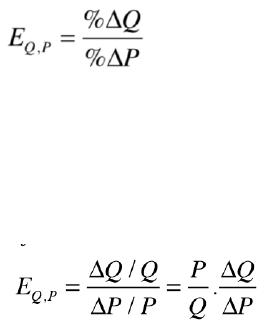
The price elasticity of demand: measures the sensitivity of quantity demanded to price changes. →
%∆Q = ‘percentage change in quantitiy demanded’
%∆P = ‘percantage change in price’
The percentage change in a variable is just the absolute change in the variable divided by the original
level of the variable. We can also write price elasticity of demand as follows:
If elasticity < -1 the product is price elastic.
If 0 > elasticity > -1 we say the product is price inelastic.
Existence of close substitutes leads to a price elastic demand, while if there are no close substitutes
available demand will be price inelastic.
The price elasticity of demand must be measured at a particular point on the demand curve and will
generally change as we move along the curve.
Point elasticity of demand: price elasticity at a particular point on de demand curve.
Arc elasticity of demand: price elasticity calculated over a range of prices.
Price elasticity of supply: percentage change in quantity supplied resulting from a 1-percent increase
in price.
Infinitely elastic demand: principle that consumers will buy a much of a good as they can get at a
single price, but for any higher price the quantity demanded drops to zero, while for any lower price
the quantity demanded increases without limit.
Completely inelastic demand: principle that consumers will buy a fixed quantity of a good regardless
of its price.
LEES/BEGRIJP 2.6
Samenvatting H3– Consumer Behavior
Consumer behavior is best understood in three distinct steps:
1. Consumer preferences,
consumenten hebben voorkeur voor bepaalde producten dit kan zowel grafisch als algebraisch
worden weergegeven.
2. Budget constraints,
consumenten hebben vaak een gelimiteerd budget
3. Consumer choices,
combinatie van voorkeuren en budget limitaties bepalen ‘the combination of goods that maximize
their satisfaction’ wat er word gekocht.
3.1 Consumer Preferences
Market basket (or bundle) = group of items/ list with specific quantities of one or more goods.
Consumers usually select market baskets that make them as well of as possible
We nemen aan dat consumers preference consistent zijn en ‘sense maken’

3 basic assumptions about people’s preferences:
1. Completeness, consumer is in staat to compare and rank all possible baskets.
2. Transitivity, consumer is consistent → als A>B en B>C dan is A ook >C.
3. More is better than less
Indifference curve: curve representing all combinations of market baskets that provide a consumer
with the same level of satisfaction. = een grafische weergave van consumer preferences
→ grafiek met punten (baskets) en 1 lijn, deze lijn geeft alle punten weer waar de satisfaction gelijk
is. Alles boven deze lijn heeft nog meer voorkeur alles eronder geeft juist minder satisfaction. Zie vb
en beschrijving op blz 94.
Indifference map: graph containing a set of indifferent curves showing the market baskets among
which a consumer is indifferent.
→ de hoogst gelegen curve geeft meeste satisfaction, curves kunnen niet kruisen (anders geen
tranisitivity).
Marginal rate of subsititution (MRS): maximum amount of a good that a consumer is willing to give
up in order to obtain one additional unit of another good.
→
change unit Yaxis bijv amount clothes = ∆C
change unit Xaxis bijv amount food = ∆F
MRS= – ∆C / ∆F
Adding 4th assumption regarding consumer preferences:
4. Diminishing marginal rate of substitution:
indifference curves are usually convex.
convex: the slope increases, i.e. becomes less negative.
in other words, an indifference curve is convex if the MRS diminishes along the curve.
Is this logic? Yes, as more and more of one good is consumed, we can expect that a consumer will
prefer to give up fewer and fewer units of a second good to get additional units of the first one. →
consumers generally prefer balanced market baskets.
Substitutes: two goods are substitutes when an increase in the price of one lead to an increase in the
quantity demanded of the other.
Perfect substitutes: two goods for which the marginal rate of substitution of one for the other is
constant; indifference curve is lineair
→ vb appelsap vs sinaasappelsap
Complements: goods are complements when an increase in the price of one leads to a decrease in
the quantity demanded of the other.
Perfect complements: two goods for which the MRS is zero or infinite; the indifference curves are
shaped as right angles (hoek 90graden)
→ vb rechter schoen vs linkerschoen.
Bad: good for which less is preferred rather than more. More = goods, less= bads.
→ hoe weergeven in grafiek? We draaien the bad om tot een good. Dus bijv: niet minder air
pollution maar preference for clean air.

Utility: numerical score representing the satisfaction that a consumer gets from a given market
basket.
Utility function: formula that assigns a level of utility to individual market baskets. Voorbeelden van
functies: u(F,C)= FC u(F,C)=F+2C u(F,C)=4FC
It is important to stress that the utility function is simply a way of ranking different market baskets;
the magnitude(vermenigvuldiging) of the utility difference between any two market baskets does not
really tell us anything. You know that one is preferred above another but not how much. Vb: als U1=
50 en U2= 100 betekent dit dat U2 is preferred above U1, Maar geeft niet 2x zoveel satisfaction.
Ordinal utility function: utility function that generates a ranking of market baskets in order of most
to least preferred.
*interpersonal comparisations of utility are impossible because numerical values are arbitrary.
Cardinal utility function: utility function describing by how much one market basket is preferred to
another.
3.2 Budget Constraints
Budget constraints: constraints that consumers face as a result of limited incomes.
Budget line: all combinations of goods for which the total amount of money spent is equal to income.
* we negeren de optie om te sparen en gaan uit van 2 goods.
➔ As a result, the combination of food an clothing she can buy will all lie on this line (P is Price):
PFF + PCC = l
Vb budget line: F+2C= $80
→ slope = ∆C/∆F = – ½ = – PF/PC = – ½
Lees bovenste alinea pag 106, begrijp ik niet
Effects on budget line:
– Income changes→ lijn verschuift parallel aan 1e budget lijn omhoog/omlaag.
– Price changes → a change in the price of one good causes the budget line to rotate about
one intercept, inward when price increases, outward when price falls.
3.3. Consumer Choice
The maximizing market basket must satisfy two conditions:
1. It must be located on the budget line.
2. It must give the consumer the most preferred combination of goods and services.
➔ Consumer chooses the market basket on the highest indifference curve that touches the
consumer’s budget line.
Maximal satisfaction when slope is equal to MRS → MRS = PF/PC
Marginal benefit: benefit from the consumption of one additional unit of good.
Marginal cost: cost of one additional unit of good.
Corner solution: situation in which the marginal rate of substitution of one good for another in a
chosen market basket is not equal to the slope of the budget line. → when the consumer’s marginal
rate of substitution is not equal to the price ration for all levels of consumption, a corner solution
arises. The consumer maximizes satisfaction by consuming only one of the two goods.
3.4 Revealed preference
Waarom een vierkant? Deze paragraaf begrijp ik niet helemaal.
The theory of revealed preference shows how the choices that individuals make when prices and
income vary can be used to determine their preferences. When an individual chooses basket A even
though he or she could afford B, we know that A is preferred to B.
3.5 Marginal Utility and Consumer Choice
Marginal utility (MU): toegevoegde voldoening verkregen van het consumeren van een extra unit
van een product.
Diminishing marginal utility: principe dat als meer van een product is geconsumeerd, de consumptie
van een extra aantal een kleinere toevoeging aan de utility zal opleveren.
Alle punten op een indifference curve genereren hetzelfde niveau utility:
MUf*∆F + MUc*∆C = 0
–(∆C/∆F) = MUf/MUc
MAAR –(∆C/∆F)= MRS van F voor C
Dus