Materials and methods
Data acquisition
Rice production data from 1987–2016 were obtained from the Philippine government statistic
authority for each political region and nationwide. Area harvested (hectares) and production
(metric tonnes) data were collected from each political region and for the whole country for each
quarter and year, for both irrigated and rainfed rice production. Missing data (where survey data
was not complete) were linearly interpolated for each region (harvested area and production for
rainfed systems) on the quarterly data (less than 1% of the data were missing). No values were
missing for irrigated systems. Yield (tonnes per hectare) was calculated by dividing production
by area for each quarter from 1987–2016.
To explore the ecological tolerance of rice we obtained the locality information of accessions
stored in gene banks worldwide from for tropical localities (from 23.5°S-23.5°N). From geo-
referenced coordinates, we obtained surface temperature data for tropical rice from the
WorldClim database at 30 arc seconds resolution, which were used to explore the climatic space
inhabited by tropical rice.
Yield normalization
We created continuous time series of production and yield (rainfed and irrigated) for each
aggregated political region. To remove the effect of yield increases due to breeding methods, we
removed a ~7 year (27 quarters) running mean from each continuous time series and afterwards
removed the residual total mean to construct an anomalous time series with zero mean. The
results were qualitatively stable to the choice of the running mean window size (a 5 year window
was also tested, data not shown). These normalization timescales are commonly used in the
literature and correspond to a normal life cycle of a rice genotype used in farming.
Climate data
To calculate climate anomalies, we removed both the annual cycle (1987–2016 climatology) and
the linear trend from each of the climate variables used. ENSO variability was characterized
using the Niño3.4 (N3.4) index, which is calculated as the area averaged sea surface temperature
anomalies from HadISST1in the region 170°W-120°W and 5°S-5°N. Soil moisture data were
obtained from CPC (version 2) at 0.5° horizontal resolution. Surface air temperature (2m) was
obtained from the ERA-Interim reanalysis on a 0.125° horizontal grid. For the global warming
projections (see below), the present-day reference temperatures were obtained from the CRU TS
version 3.23 dataset, which presents monthly data from the period 1901–2014 on a 0.5°
horizontal grid. To evaluate crop-climate relationships at the different spatial scales, climate data
were either spatially averaged for the entire Philippines (here defined by the geographical region
117°E-128°E, 4°N-22°N) or the respective regions.
Climate projections
Future climate projection data were obtained from the CMIP5 database for the business-as-usual
scenario RCP 8.5. Monthly output was obtained from eighteen climate models and interpolated
using bilinear interpolation to a 0.5° resolution common grid. For the 2°C and 4°C warming
targets, we first constructed the canonical global warming temperature pattern for each of the
eighteen models by taking the difference in monthly climatology between the 2080–2099 and

1980–1999 time periods, normalized by the global, annual mean temperature change. The future
climate projections are then calculated by adding the change in each (2°C or 4°C warmer) model
climatology to the observed (1911–2010) climate history, thus preserving the present-day
interannual temperature variability.
Correlation analysis
We utilize standard correlation analysis to investigate the relationships between the respective
climate variables and rice production and yield. For these relationships, we consider seasonal
anomalies to be independent from anomalies in the same season of the previous and following
years, which leads to an effective sample size of 30 (number of years). For all spatial maps that
show temporal correlation coefficients in shading for the different geographical regions, an
absolute value of the correlation coefficient of ~0.31 is statistically significant at the 90%
confidence level using a two-tailed t-test (df = 28). Thus, we are not showing any correlations
below an absolute value of 0.3 (white shading) in these maps.
Results
National-level data
Irrigated rice production in the Philippines has almost tripled over the past thirty years, while
rainfed rice production has seen a much smaller growth. Over this period, yields for both
production systems have increased steadily. Besides this long-term trend, annual rice yields at
the national level have been fairly stable over this period, with irrigated paddy rice production
having only six yield anomalies exceeding one standard deviation (absolute anomaly of 0.09 [t
ha-1], which corresponds to ~2.5% of the annual long-term mean in irrigated), while rainfed
upland rice crops exhibited eight yield anomalies exceeding one standard deviation (absolute
value of 0.07 [t ha-1], which corresponds to ~2.9% of the annual long-term mean in rainfed.
Relative anomalies in total rice production are larger than those in yield, implying that the effects
of climate variability are compounded through both yield and harvested area changes. As a result
of the frequent occurrence of natural disasters in the Philippines, production losses are often
manageable and built into farm management. Notable exceptions are 1998 –with two typhoons–
and 2010 –with four typhoons, an earthquake and a flood–which both saw large negative
production anomalies.
Aggregating the yield and production data on an annual time scale potentially masks seasonal
modulations of both the large-scale climate variability and crop-climate relationships. As a
result, quarterly production and yield anomalies show more variability than the annual data.
Rainfed and irrigated rice production anomalies are substantially less correlated with production
in the quarterly data (R = 0.65, significant at the 99% confidence level with df = 28) than in the
annual time series (R = 0.86, significant at the 99% confidence level with df = 28). About 10%
of variance in anomalous rice production on the national level is related to soil moisture
variability, which is strongly negatively correlated with the Niño3.4 index. This reduction of rice
production during El Niño events is qualitatively similar to the results of global analyses. While
the correlation coefficients between soil moisture anomalies and rice production anomalies are
approximately the same for irrigated (R = 0.33, significant at the 90% confidence level with df =
28) and rainfed (R = 0.34, significant at the 90% confidence level with df = 28) rice production,

when looking at yield anomalies the correlation is higher for rainfed than for irrigated systems.
This shows that, as expected, irrigation can counter much of the plant physiological response to
soil moisture changes (as measured by rice yield), but decisions on planting area (as included in
rice production) remain sensitive to water availability.
ENSO impacts on soil moisture
On a regional scale as well as on the national level, the correlation between the Niño3.4 index
and soil moisture anomalies in the Philippines is negative, i.e., El Niño events lead to dry
conditions in all parts of the country. Interestingly, the correlation between ENSO and soil
moisture decreases in the third and fourth quarters. One factor might be that in the summer
season rainfall variability is dominated by tropical cyclone activity. While tropical cyclone
activity can be modulated by large-scale climate variability such as ENSO, it can be considered a
mostly stochastic process on climate timescales. This wet season (Quarters 3 and 4) is also the
season when most rice is planted, indicating that wet-season rice production may be largely
decoupled from ENSO variability.
Regional crop-climate relationships
Rice in the Philippines is in the field for 90–110 days, so that planting decisions are made about
three months before harvest. Looking at the lagged correlation between rice production and soil
moisture (soil moisture leading by one quarter, in most seasons, soil moisture anomalies in the
previous quarter are significantly correlated with production variability, with higher soil moisture
usually associated with increased rice production. Locally, seasonal correlations can be much
higher than the national-level data. A notable exception to this is Quarter 4, when correlations
between these two variables are small, or even negative. Production in this quarter is the highest
of the year and represents the wet-season crop. Mean soil moisture conditions during the
preceding quarters are high, so that variability in soil moisture does not affect rice planting or
yield that much, while the typhoons that often impact the summer season (Q2-Q3) can lead to
detrimental flooding in these quarters. This is in accordance with an analysis of Luzon Island in
the Northern Philippines eight of eighteen regions, an area where both mean production and
mean yields are high.
Total rice production in any given region is a function of the crop area harvested, the crop yield
per unit area, and the number of crops harvested per year. Climate variability influences all of
these variables. In Quarter 3, when correlations between soil moisture and total rice production
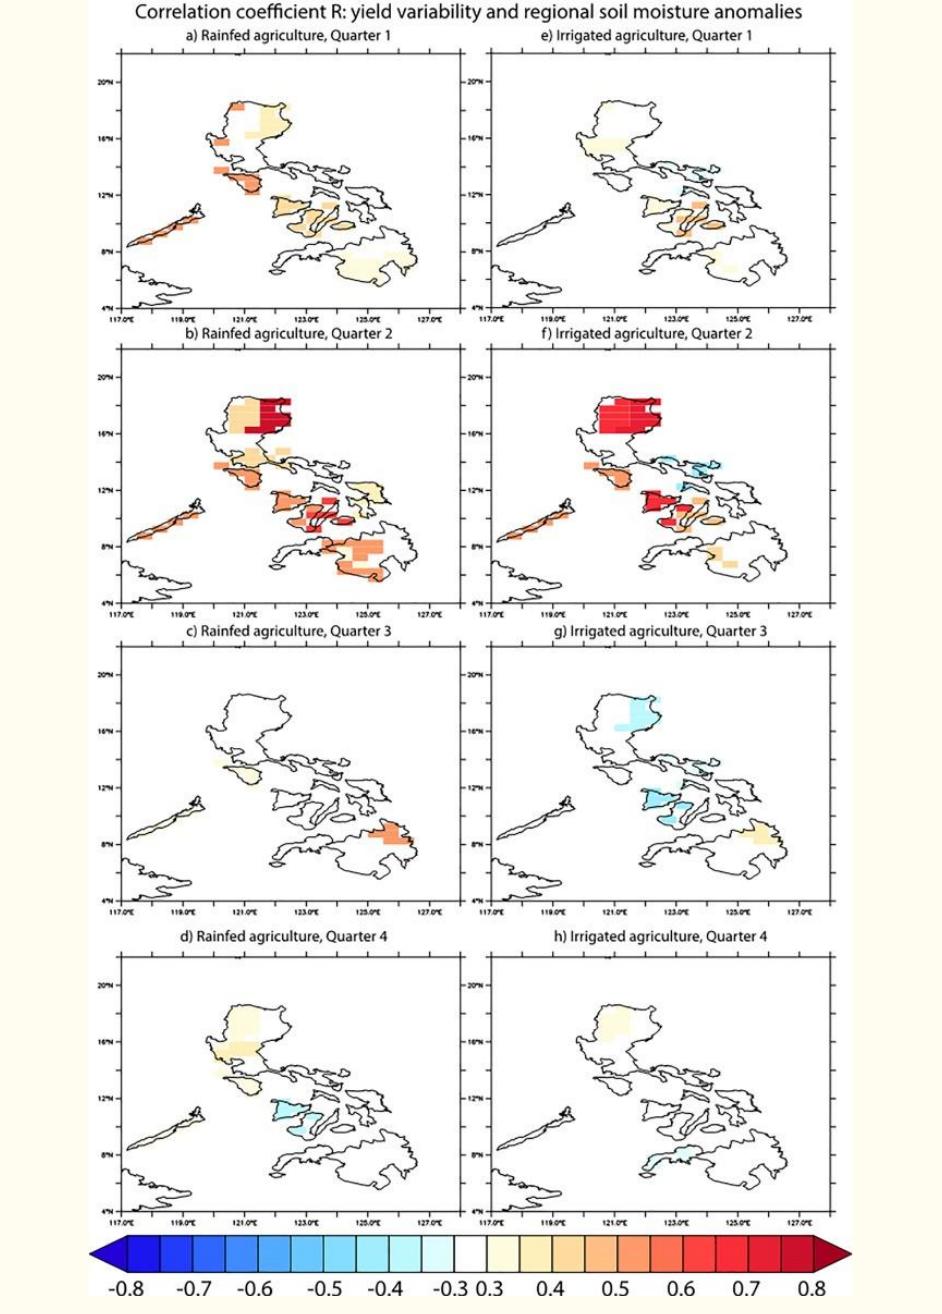
are strongly positive in most regions (Fig 3), there were few locations with significant
correlations between previous-quarter soil moisture and rice yield (Fig 4). This means that in this
season, soil moisture anomalies might mostly drive planting decisions (i.e., which areas are
brought into production), without strongly affecting plant development. During the dry season
(Quarters 1 and 2) on the other hand, there are also significant regional correlations between soil
moisture and rice yields, implying that climate variability in this season affects both plants and
planting decisions. Mean climatological soil moisture conditions thus strongly affect the rice
production response to climatic forcing. In contrast to soil moisture, in most regions temperature
variability has a much lower correlation with rice yields. In some regions however, ENSO-
induced temperature and precipitation changes have an effect in the same direction: El Niño
events usually result in dry and hot conditions in the Philippines, which both are associated with
a decrease in yield (S4 Fig). As we have seen, ENSO is driving a significant part of soil moisture

variability in the Philippines which is correlated with rice production variability. Therefore, the
predictive skill for ENSO that is seen in operational seasonal forecast models [44] up to several