MACROECONOMICS MODULE 2 HOMEWORK ASSIGNMENT (CH. 14B pp. 383-390)
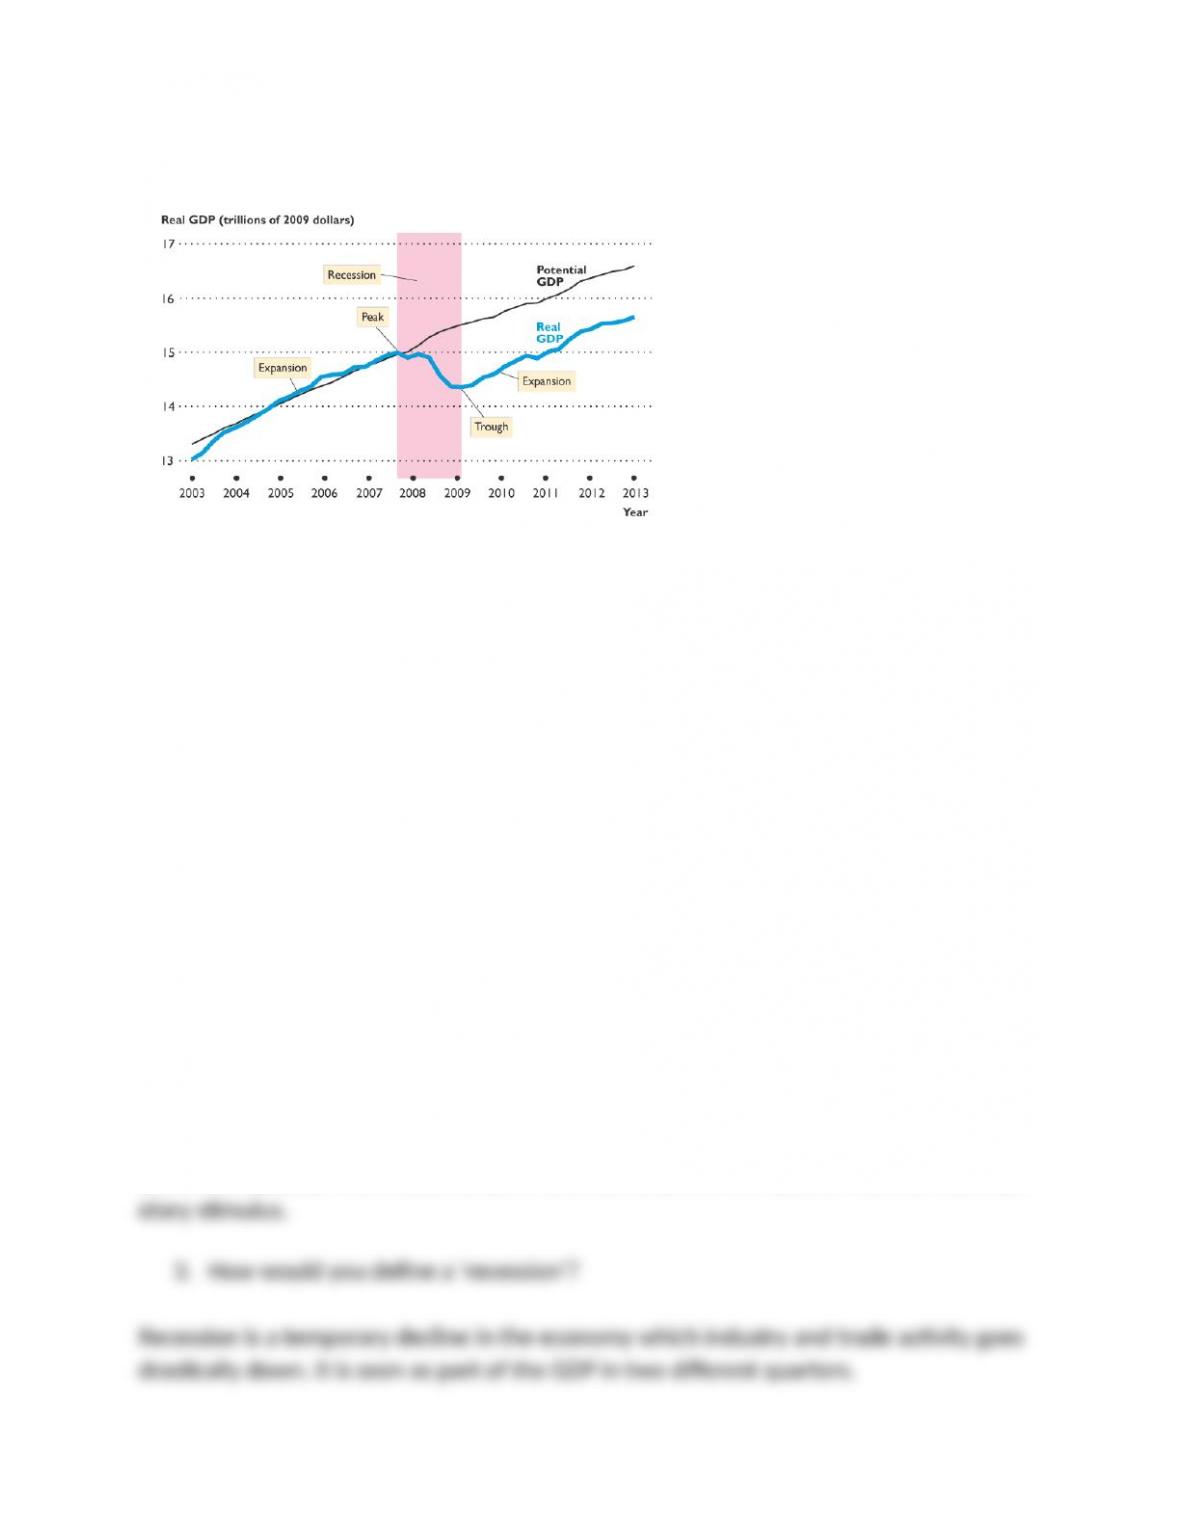
Figure 14.3
1. Referring to Figure 14.3 above, explain what is occurring in the years 2008-2010
and then in 2005-2007 in terms of real GDP and potential.
in 2005-2007 the economy was going up which includes GDP which also means that pro-
duced and final goods and services in the economy increased it was expanding through
out the year. then in 2008-2010 the GDP went down. Through stands for the stage in a
business cycles economy that marks the finish of a period of business that is declining
and the transi(on to expansion which is what happened later in 2008-2010
2. From 2010 onward it appears that US real GDP is recovering. A/er referring to
Figure 14.3 once again, what conclusion might you make about this recovery es-
pecially in terms of potential GDP?
well the potential means that it is slowly growing back up but based o1 the graph where
it states potential GDP it shows how the GDP could have progressed if it stayed at the
same rate starting in 2003 but because it declined it su1ered and did not come through
its outcome and its true potential. potential GDP is all based o1 concept which in return
can be seen in different ways. It had potential to make more money through the years.
We cannot see the true confident about the estimate of potential GDP and (ll several
years have passed. This is used to see if the economy is in the need of more or less mon-