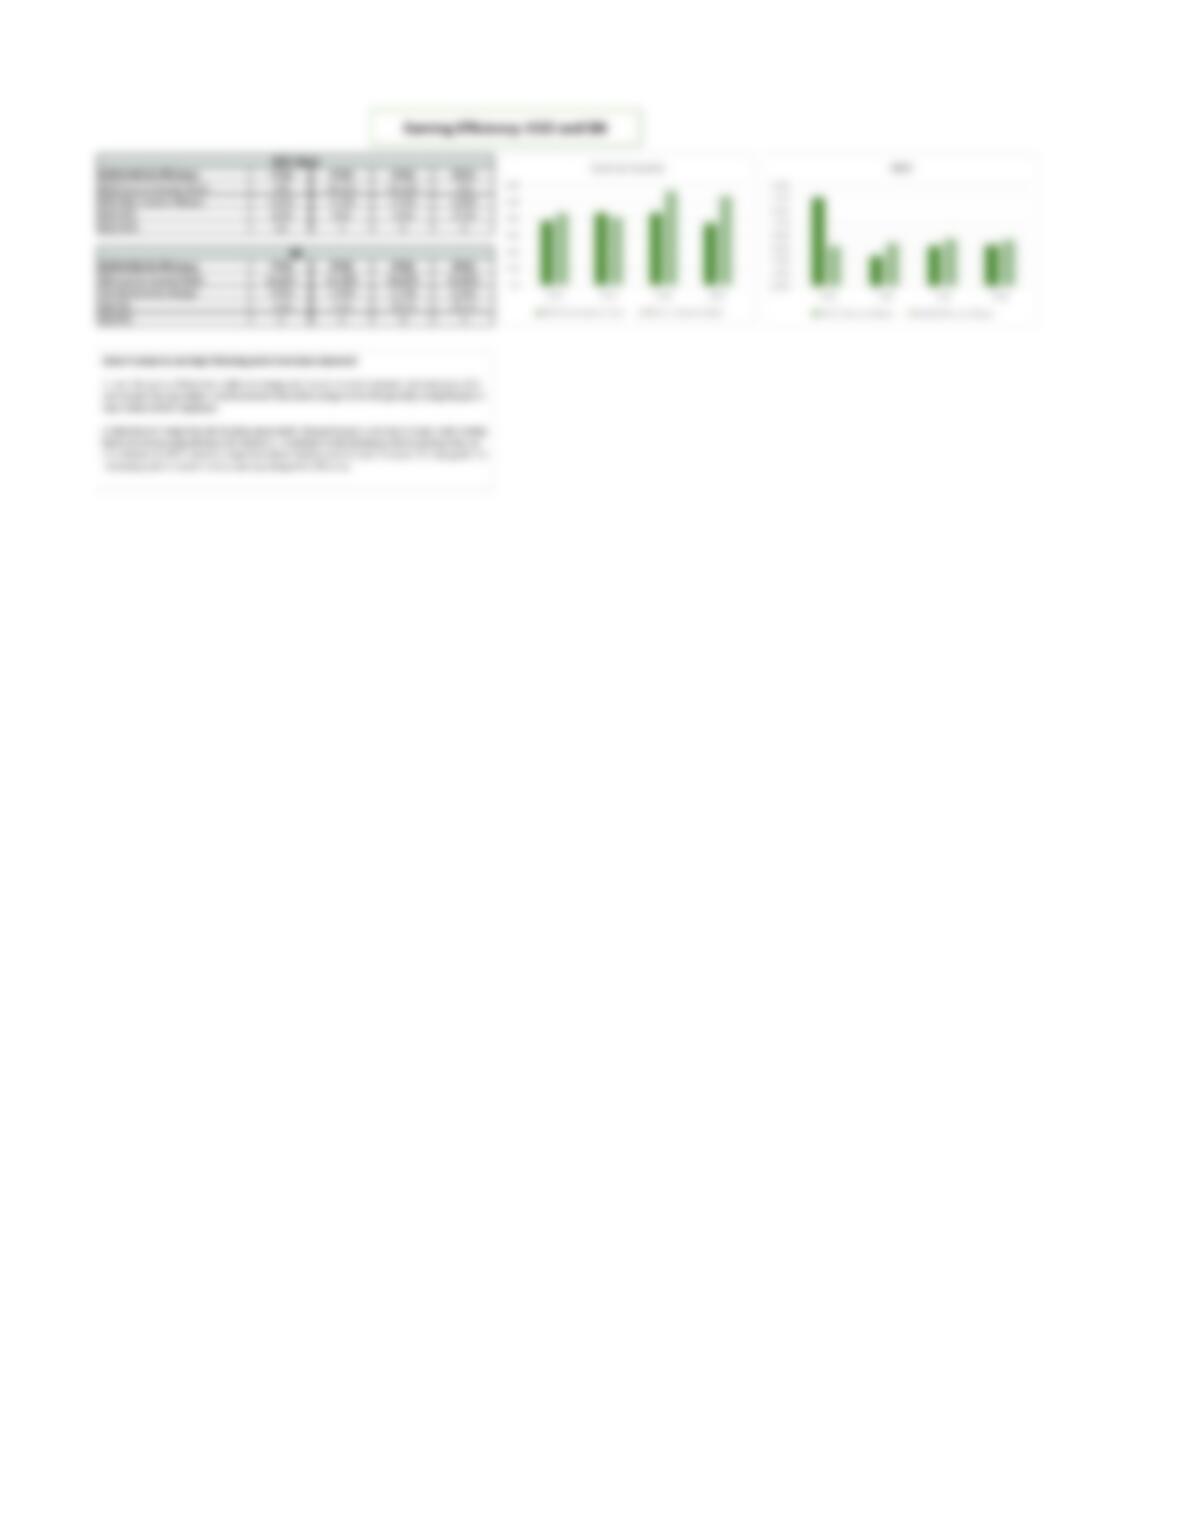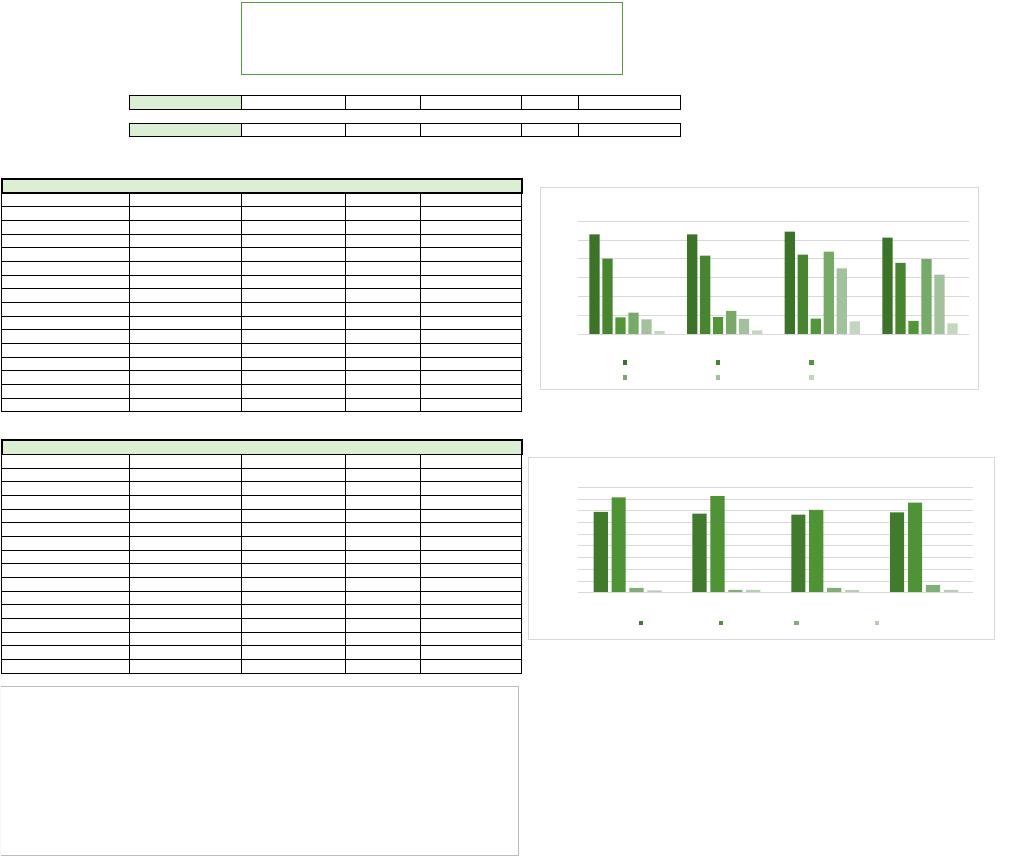
ROE= PAT/ASSETS * ASSETS/EQUITY
ROA= INCOME/ASSETS – EXPENSE/ASSETS – PROVISION/ASSETS
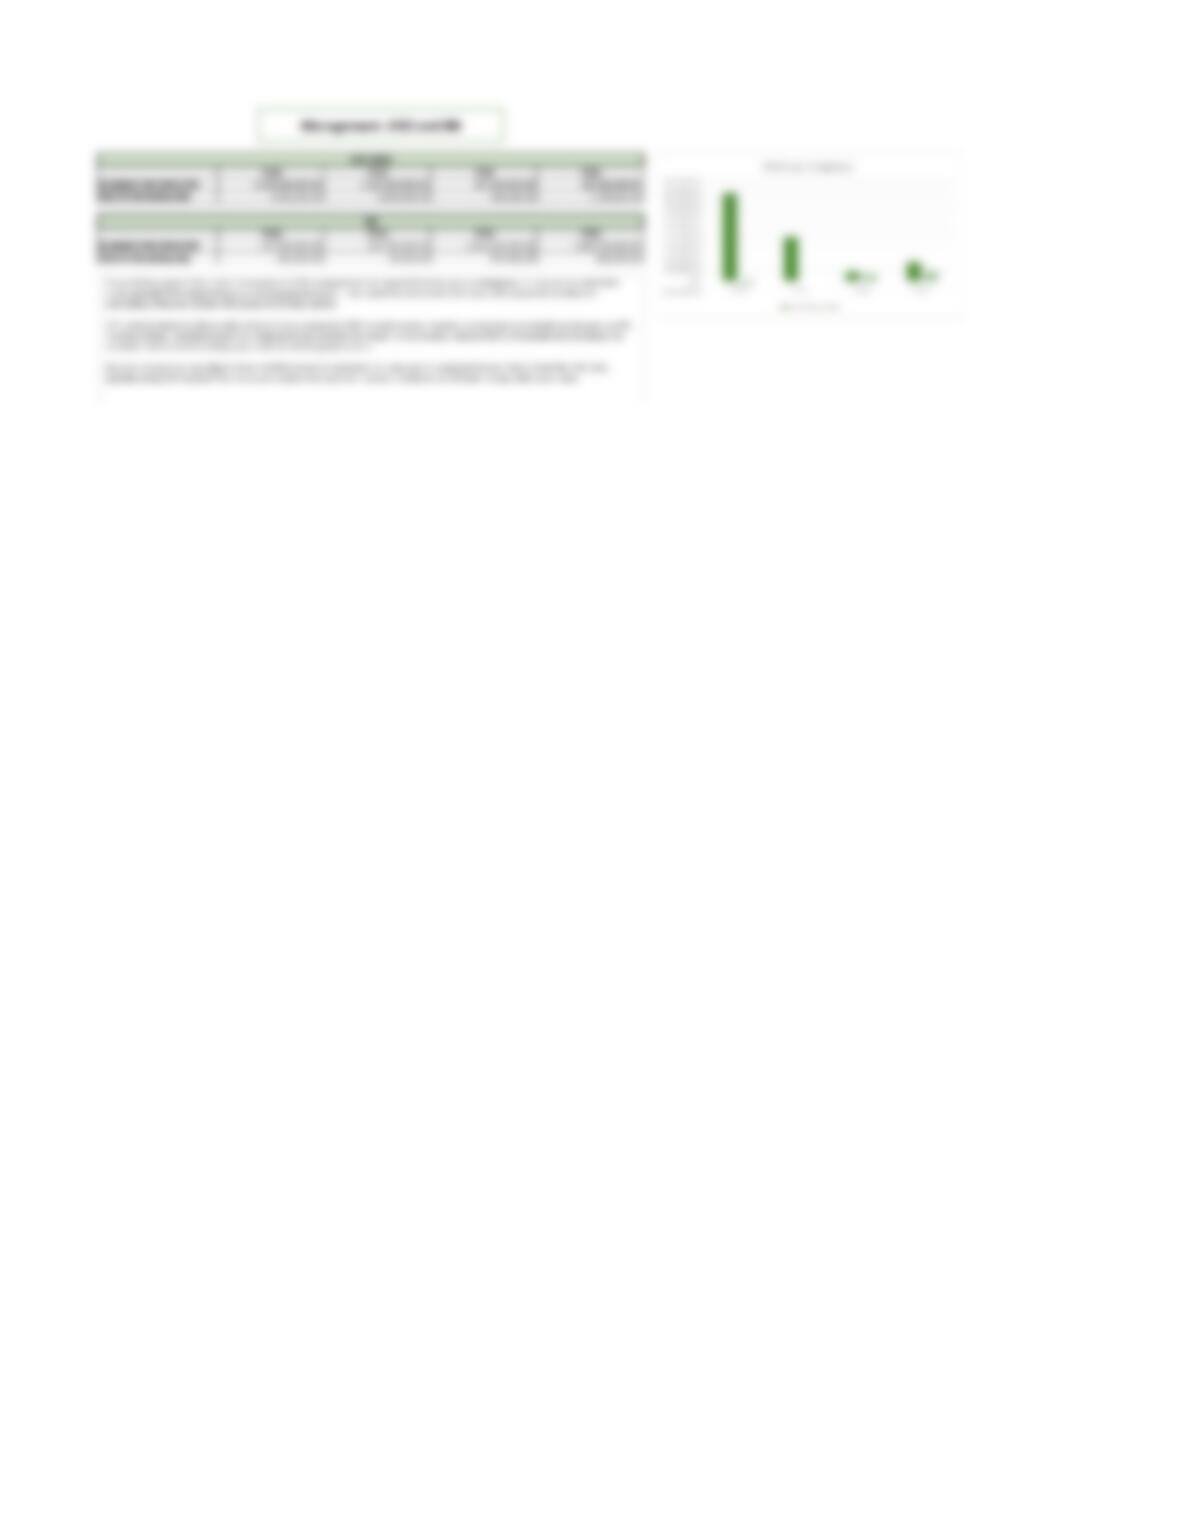
Value in Cr
FY18 FY19 FY20 FY21
Equity 1,285.81 1,289.46 1,294.76 1,383.41
Total Assets 1,124,281.04 1,238,793.89 1,377,292.23 1,573,812.24
PAT:
+INCOME 118,969.10 131,306.50 149,786.10 161,336.48
-EXPENDITURE 90,017.68 103,436.42 116,183.42 118,930.76
-PROVISIONS 19,851.88 22,180.92 22,377.21 22,041.76
ROA Breakup
ICICI Income/Assets 10.58% 10.60% 10.88% 10.25%
ICICI Expenditure/Assets 8.01% 8.35% 8.44% 7.56%
ICICI Provision/Asset 1.77% 1.79% 1.62% 1.40%
ICICI ROA 0.81% 0.46% 0.82% 1.29%
ICICI ROE 13.80% 13.50% 13.30% 13.70%
Value in Cr
FY18 FY19 FY20 FY21
Equity 512.51 519.02 892.46 892.46
Total Assets 3,616,444.00 3,888,467.00 4,197,492.34 4,845,618.55
PAT:
+INCOME 81,602.45 95,461.65 368,010.65 385,337.89
-EXPENDITURE 55,870.08 62,836.87 292,905.36 306,439.76
-PROVISIONS 11,182.74 15,138.06 56,928.46 54,618.41
ROA Break-up
SBI Income/Assets 2.26% 2.45% 8.77% 7.95%
SBI Expenditure/Assets 1.54% 1.62% 6.98% 6.32%
SBI Provision/Asset 0.31% 0.39% 1.36% 1.13%
SBI ROA 0.40% 0.45% 0.43% 0.50%
SBI ROE 16.26% 16.45% 14.13% 15.36%
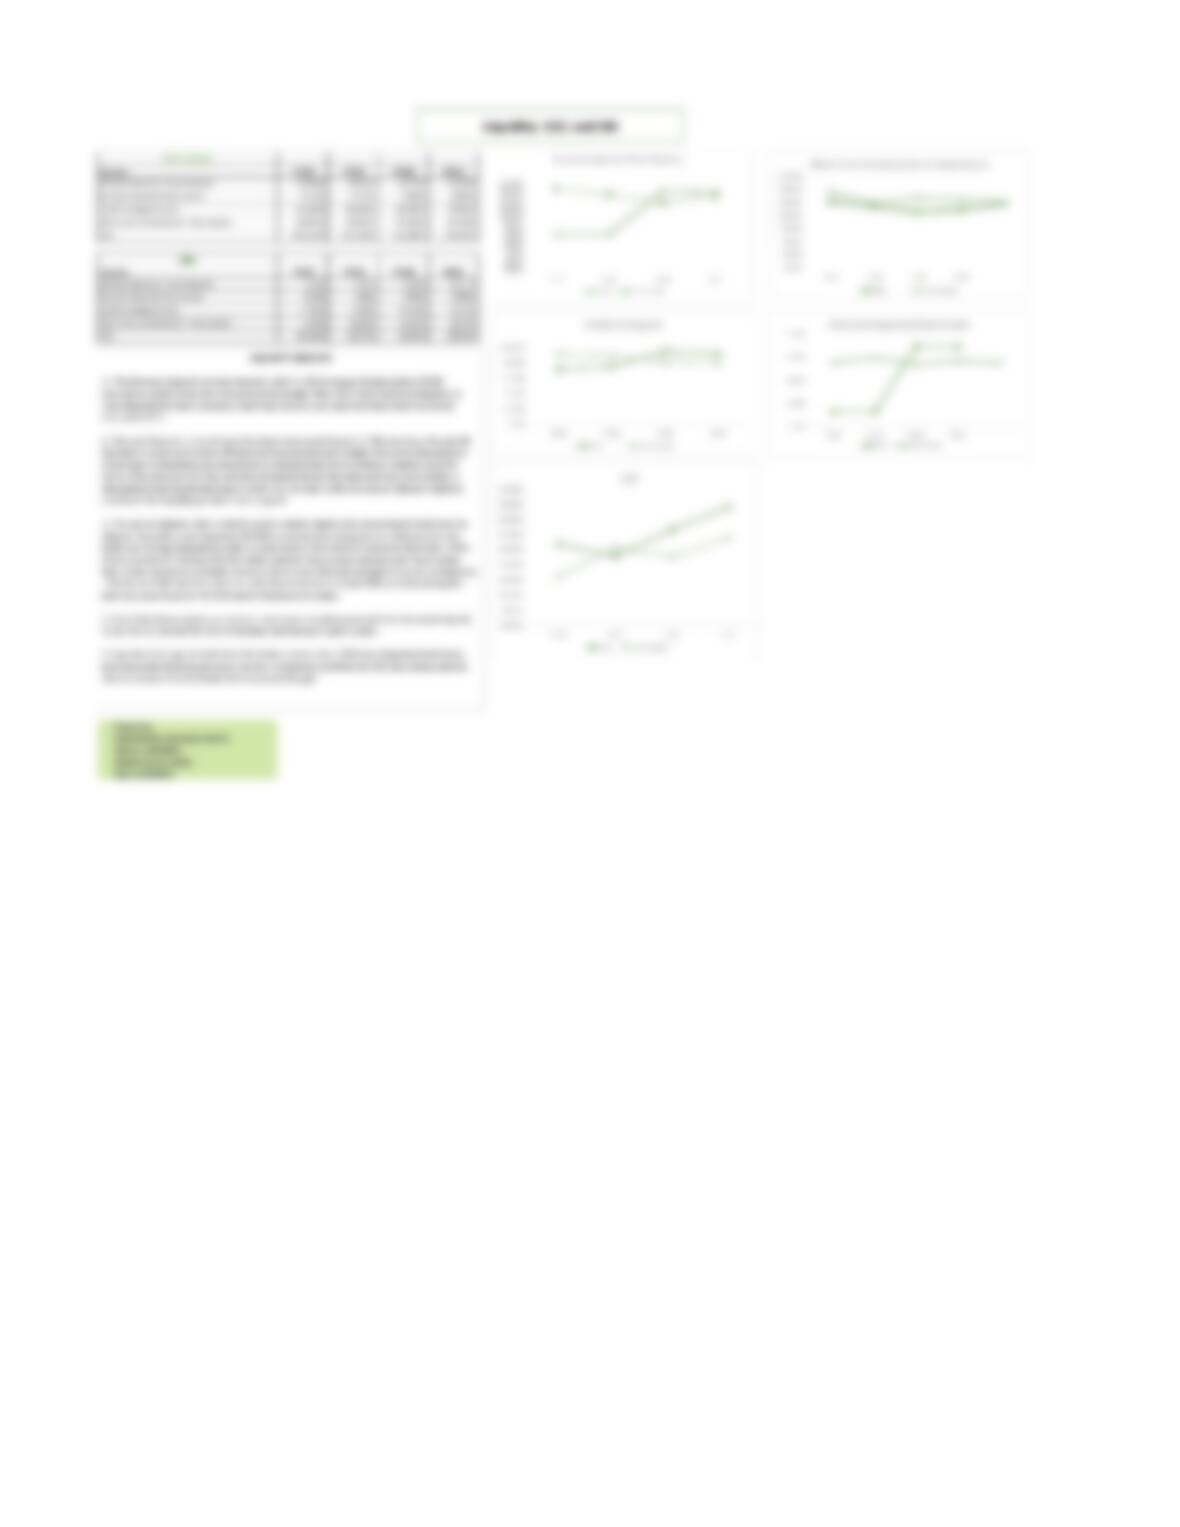
ICICI Bank
SBI Bank
0.00%
2.00%
4.00%
6.00%
8.00%
10.00%
12.00%
FY18 FY19 FY20 FY21
RoA Breakup Analysis
ICICI Income/Assets ICICI Expenditure/Assets ICICI Provision/Asset
SBI Income/Assets SBI Expenditure/Assets SBI Provision/Asset
0.00%
2.00%
4.00%
6.00%
8.00%
10.00%
12.00%
14.00%
16.00%
18.00%
FY18 FY19 FY20 FY21
RoA-RoE Analysis
ICICI ROE SBI ROE ICICI ROA SBI ROA
DuPont Analysis: ICICI bank and SBI
Submitted by Khushboo Mehta
Roll no: 301/2020, PGDM Finance, 2020-22
Interpretations
Over the years, ROA of ICICI bank has increased whereas that of SBI has reduced. ROA breakup is as follows :
1. While ICICI bank’s income as percent of assets has been relatively stable over time, that of SBI has increased continuously,
however there are huge differences in their ratios, so ICICI has outperformed.
2. The expenditure as a percentage of assets is also stable in case of ICICI as compared to that of SBI which has increased
drastically specially over the COVID period, which again supports the claims of ICICI’s overperformance.
3. the provisioning for ICICI bank agian is same throughout, while for SBI it has increased which provides it a better cussion in
terms of risk.
whereas, when it comes to creating returns for equity holder;
1. SBI Has been outperforming ICICI bank due to the leverage effect of debt component in its capital structure which can be
understood from the tables made above. thus, providing overall boost to the equity multiplier.
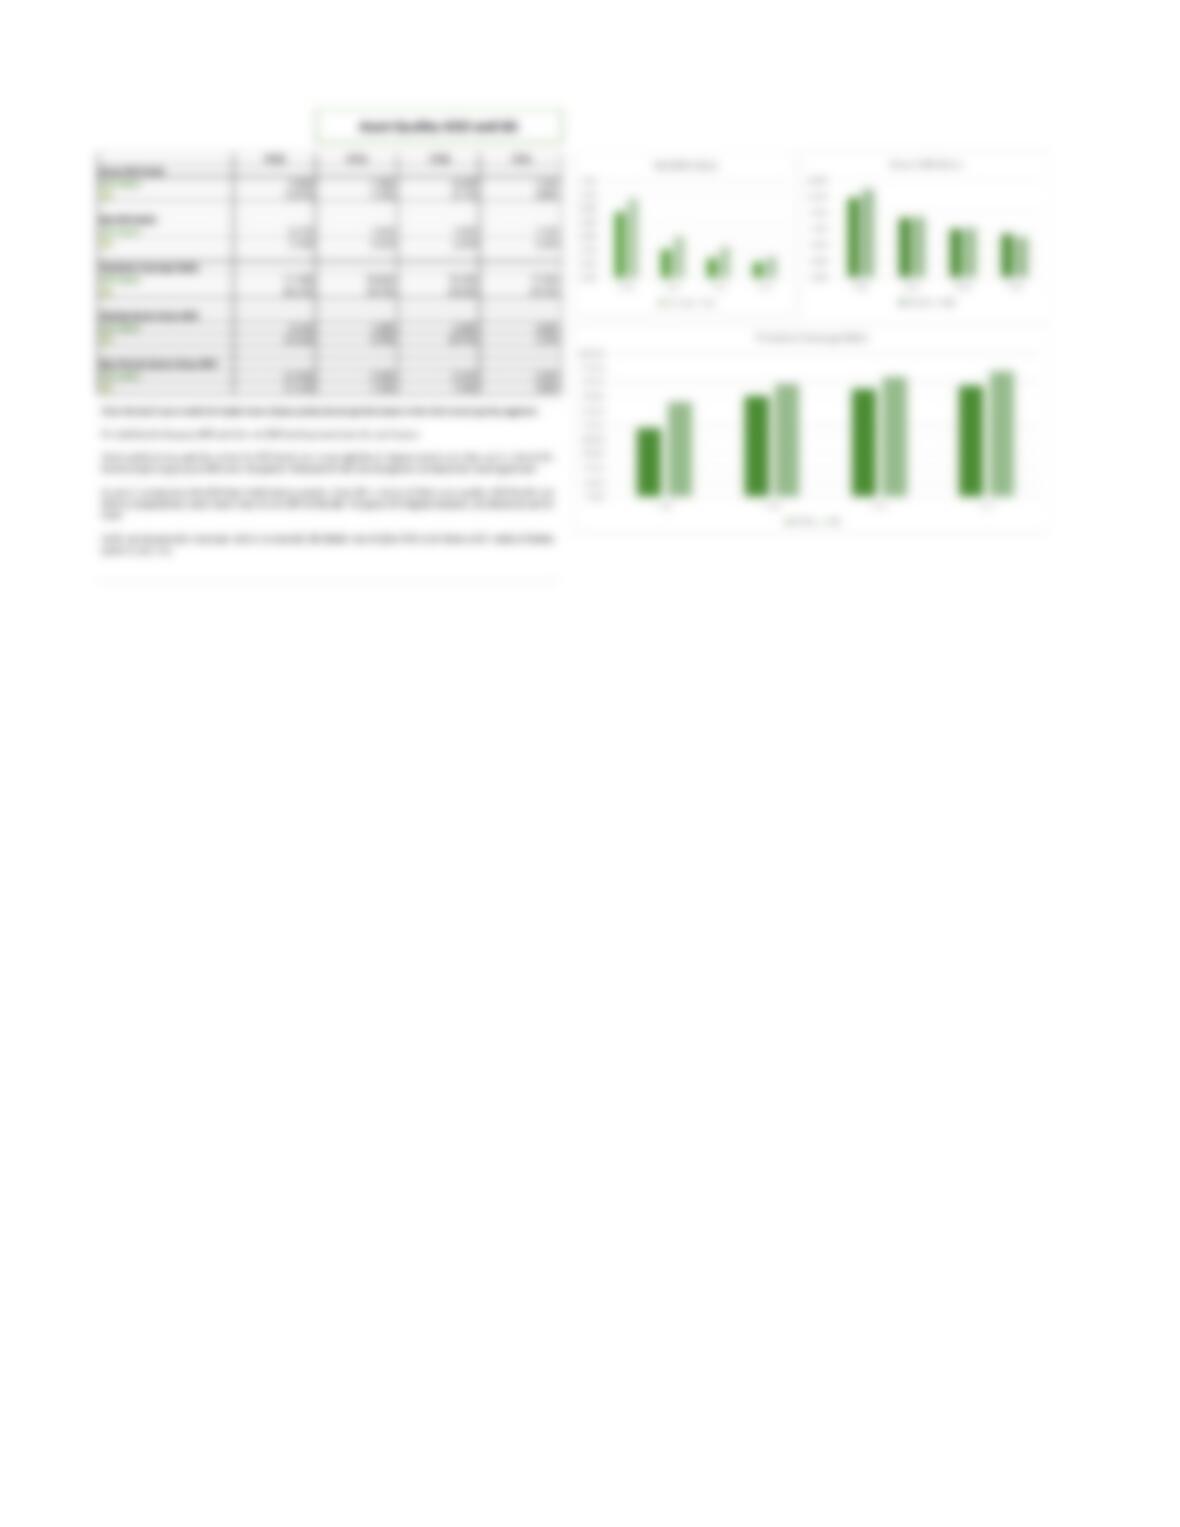
Particulars
FY18 FY19 FY20 FY21
Common Equity Tier 1 Capital 14.43% 14.43% 13.39% 16.80%
Tier 1 capital 15.92% 15.92% 14.72% 18.06%
Tier 2 capital 2.50% 2.50% 1.39% 1.06%
Total CRAR 18.42% 18.42% 16.11% 19.12%
Particulars
FY18 FY19 FY20 FY21
Common Equity Tier 1 Capital 9.68% 9.62% 9.77% 10.02%
ICICI BANK
SBI BANK
Capital Adequacy: ICICI AND SBI
5.00%
10.00%
15.00%
20.00%
25.00%
Capital Adequacy