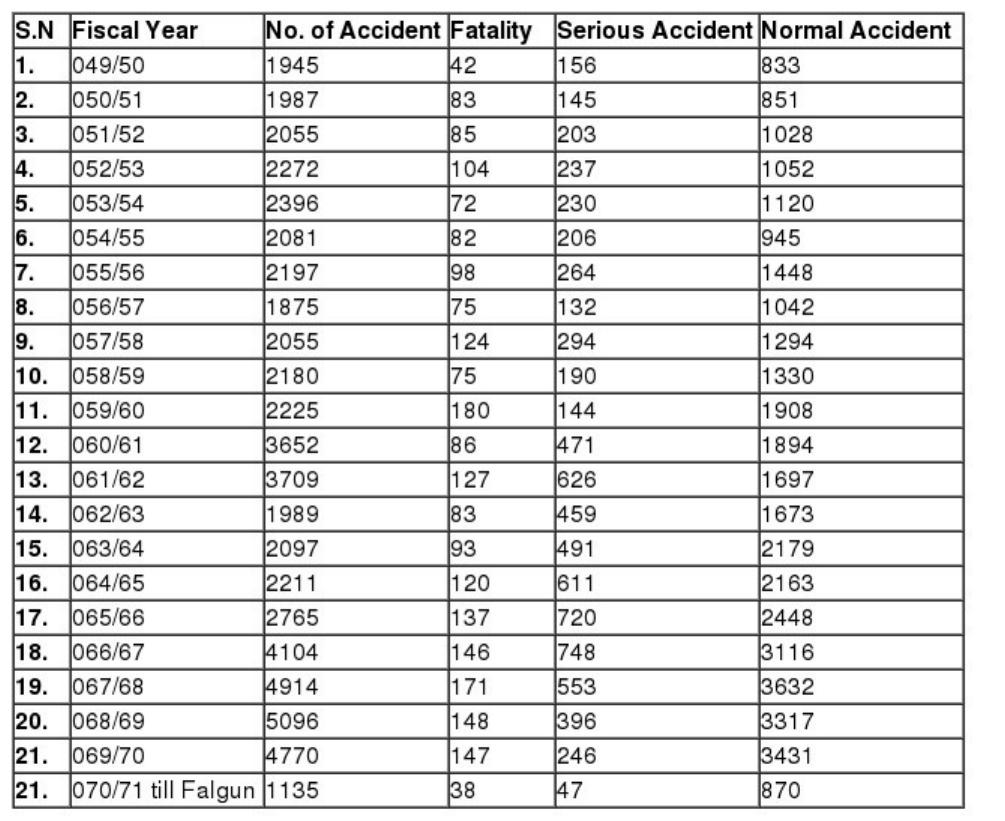
The data shows the number of accident in Nepal at different year
Figure: – 1 Total Number of Accident
From the Above data we can find that total number of accident fluctuation higher in 49/50
since it was taken as origin but it goes on reducing till 59/60 and from 60/61 the trend of
accident has been increasing for last two year and after that it has been decreasing and
from 66/67 again the accident has been shown increase till 68/69 and reduce by 11% in
69/70.
Figure: – 2 Total Number of fatality
The above data show the no of people death cause of accident where we can see the
highest number of fatality was in the year 59/60 and second highest at 67/68 but it has
been reduced in the 69/70.
Some people in the Nepal take the drinks as a culture and in the name of the culture they
use to drink and drive which create a lots of accident in Nepal almost 80% of the accident
occurs due to Madak Padartha Sewan (MA PA SE) to control the accident rate
Metropolitan Traffic Police Division introduce new campaign called MA PA SE from
evening of 18th Mangshir 2068. After this policy the accident rate of Kathmandu valley
has been reduced and also the government has earned huge amount of tax revenue from the
people who was fined due to the MA PA SE the fine was started with Rs. 1000 and now it
has been increase to Rs 1500 also the people are provided the class regarding the cause and