L.L. Bean, Inc. Case Study
Questions
How significant of a problem is the mismatch between supply and demand at L.L. Bean?
What order quantity should L.L. Bean use for the selected item:
Assuming that L.L. Bean manages to derive the correct forecast, what do you think of their
ordering process?
What do you think about L.L. Bean’s forecasting process? Can they do better?
How significant of a problem is the mismatch between supply and demand at L.L.
Bean?
Very significant in the fact that the percentage of mismatch between supply and demand is
almost equal to the industry’s net profit average.
Mismatch cost = 21M
Annual sales = 599M
Mismatch cost as percent of sales = 4%
· Net profit average between 2 – 5% of sales for companies in the sport apparel industry.
What order quantity should L.L. Bean use for the selected item:
Any item with a retail value of $45, cost of $25, and liquidation value of $15 and an
annual sales forecast of 12,000 units (1,000/month)…
Based on the data from the previous year, the average A/F ratio was 1.10 with an average
standard deviation of .353, making the expected demand of the item 13,161 units and the
standard deviation 4230 units; based on the annual sales forecast of 12,000 units.
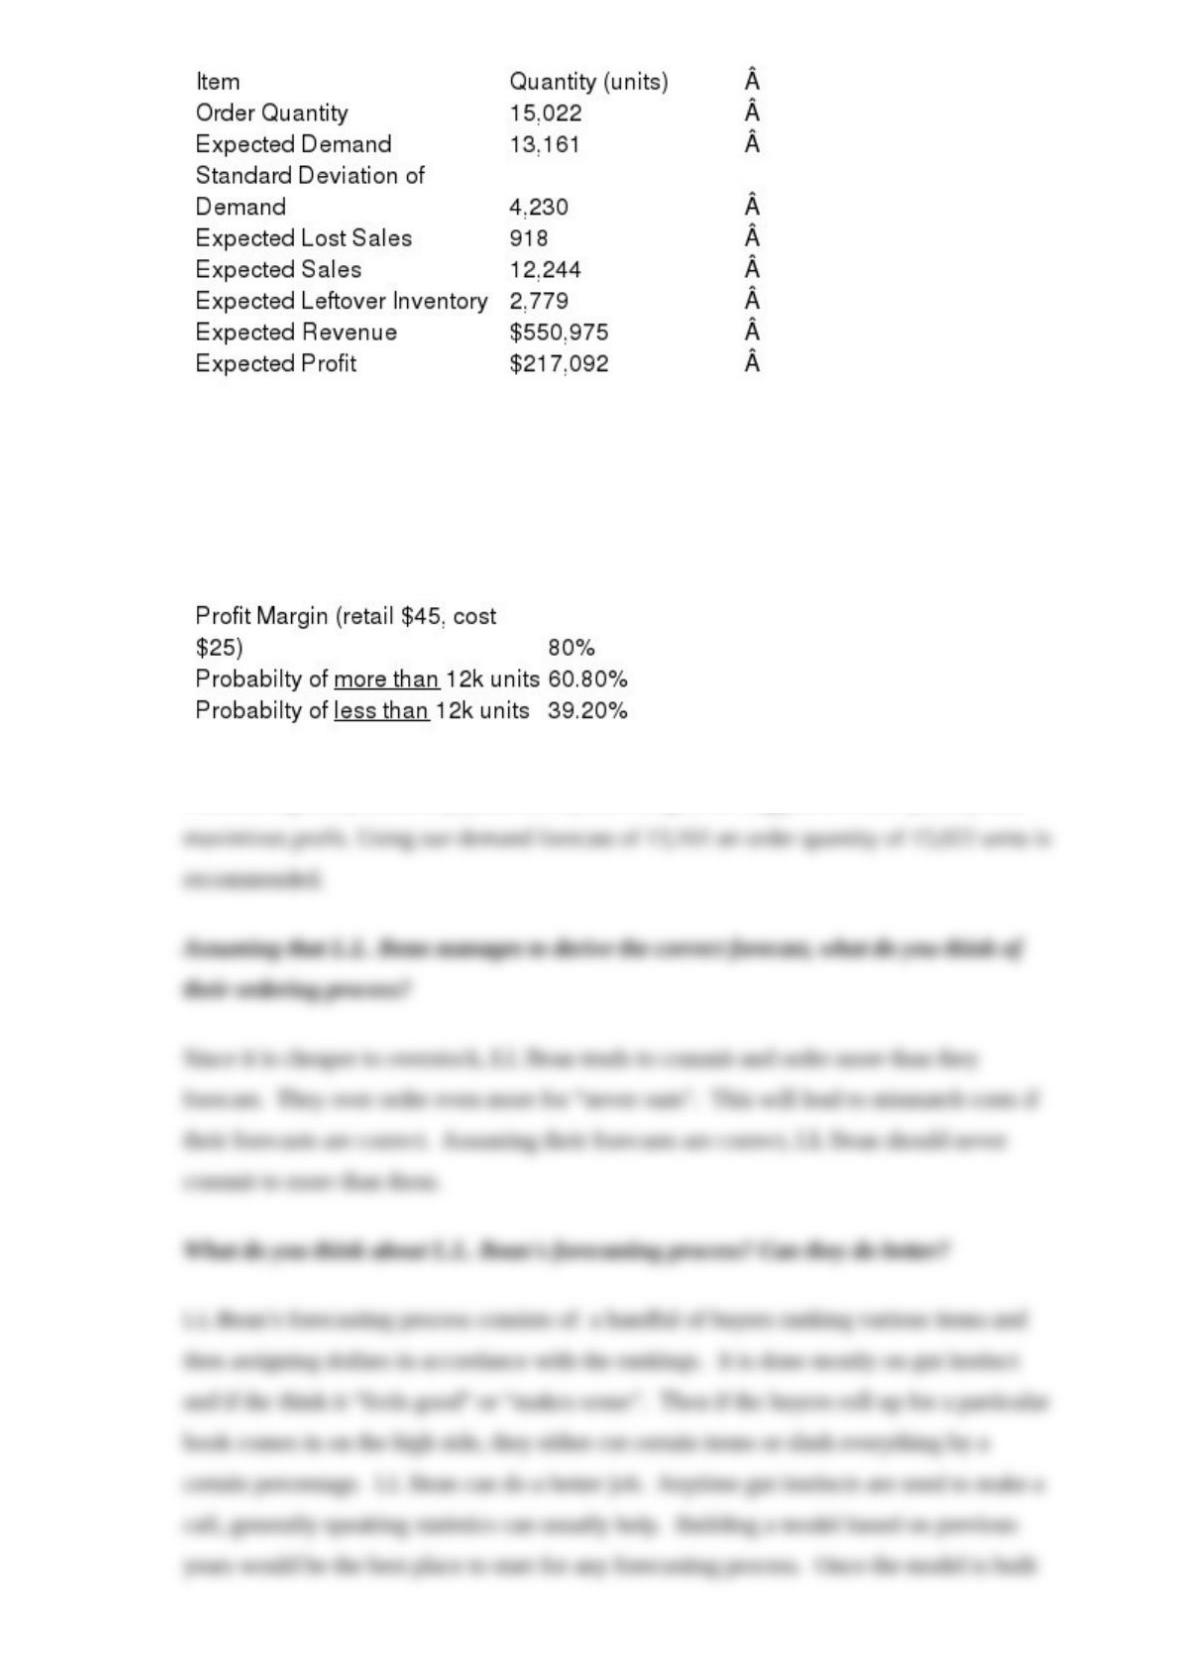
The suggested increase in ordering quantity verses the sales forecast is supported by the
normal distribution function indicating an approximate 60% chance that demand would be
greater than the forecasted sales.
Considering this product enjoys an 80% profit margin, we suggest an order quantity that