Introduction to linear regression
1.Choose another traditional variable from mlb11 that you think might be a good predictor
of runs. Produce a scatterplot of the two variables and fit a linear model. At a glance, does there
seem to be a linear relationship?
CODE:
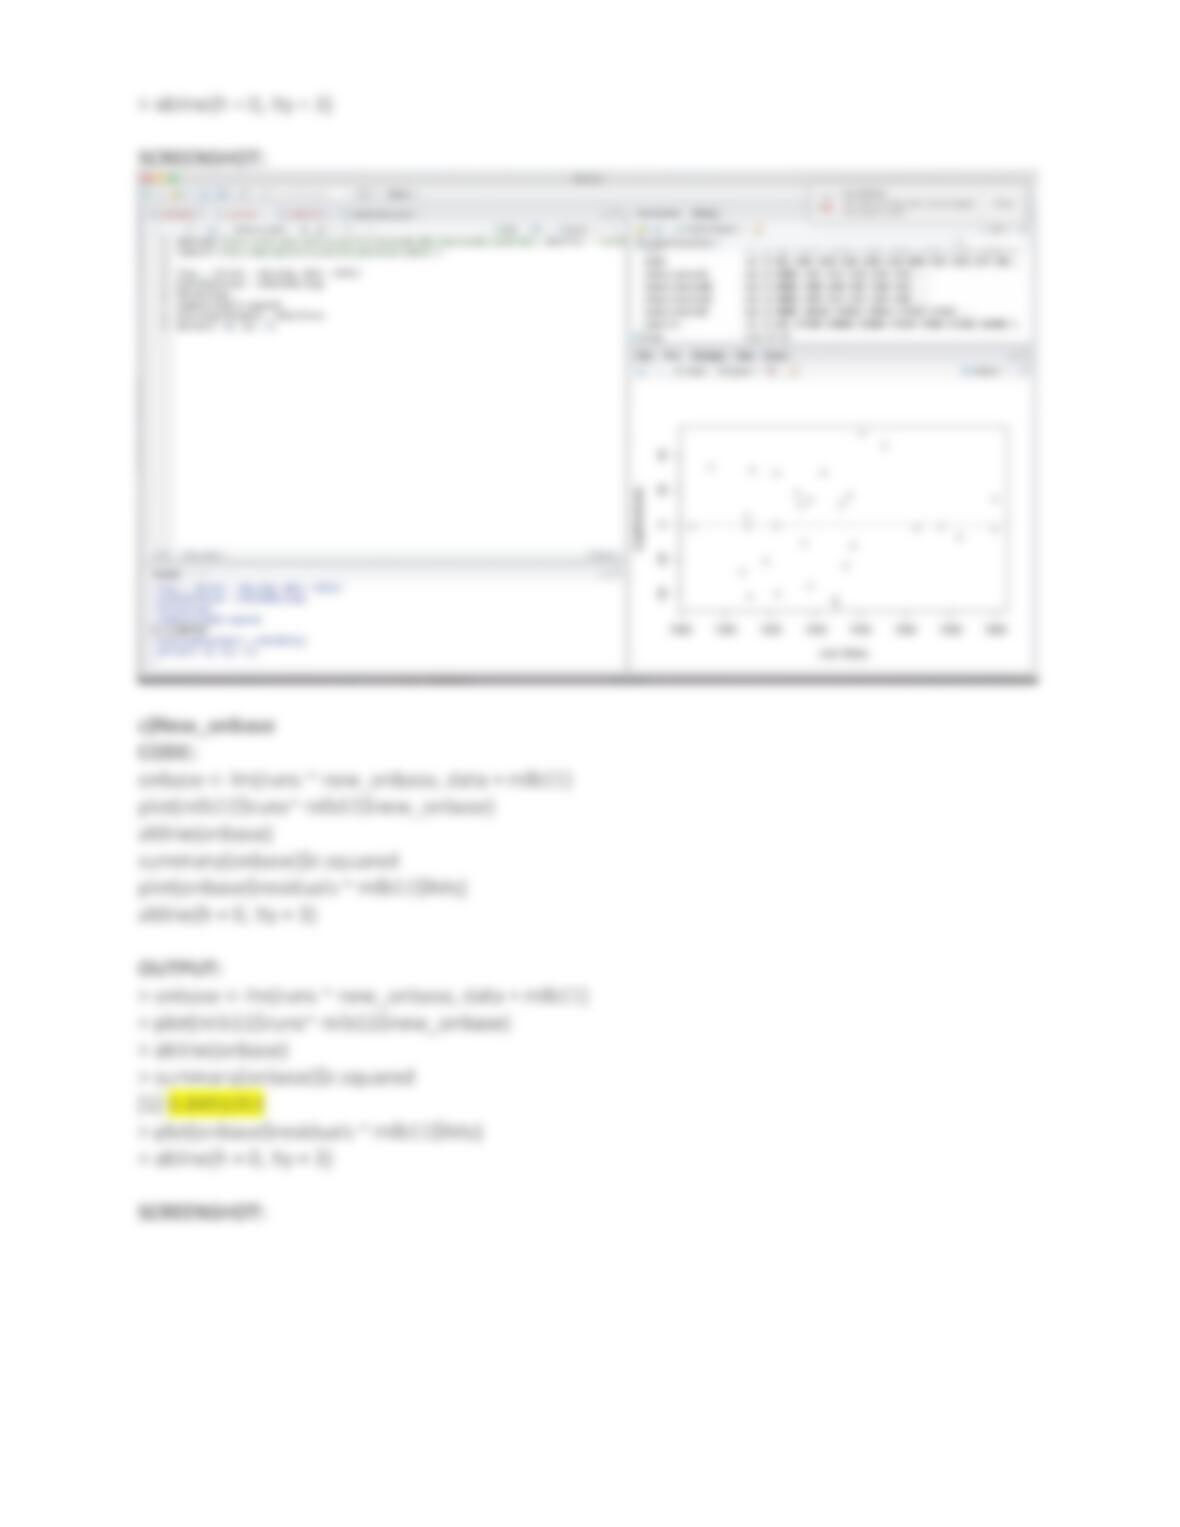
predict_runs <- lm(runs ~ hits, data = mlb11)
predict_runs
plot(mlb11$runs ~ mlb11$hits)
abline(predict_runs)
plot(predict_runs$residuals ~ mlb11$hits)
abline(h = 0, lty = 3)
OUTPUT:
> predict_runs <- lm(runs ~ hits, data = mlb11)
> predict_runs
Call:
lm(formula = runs ~ hits, data = mlb11)
Coefficients:
(Intercept) hits
-375.5600 0.7589
> plot(mlb11$runs ~ mlb11$hits)
> abline(predict_runs)
SCREENSHOT:

INFERENCE:
Yes, there seems to be a linear relationship between the two.
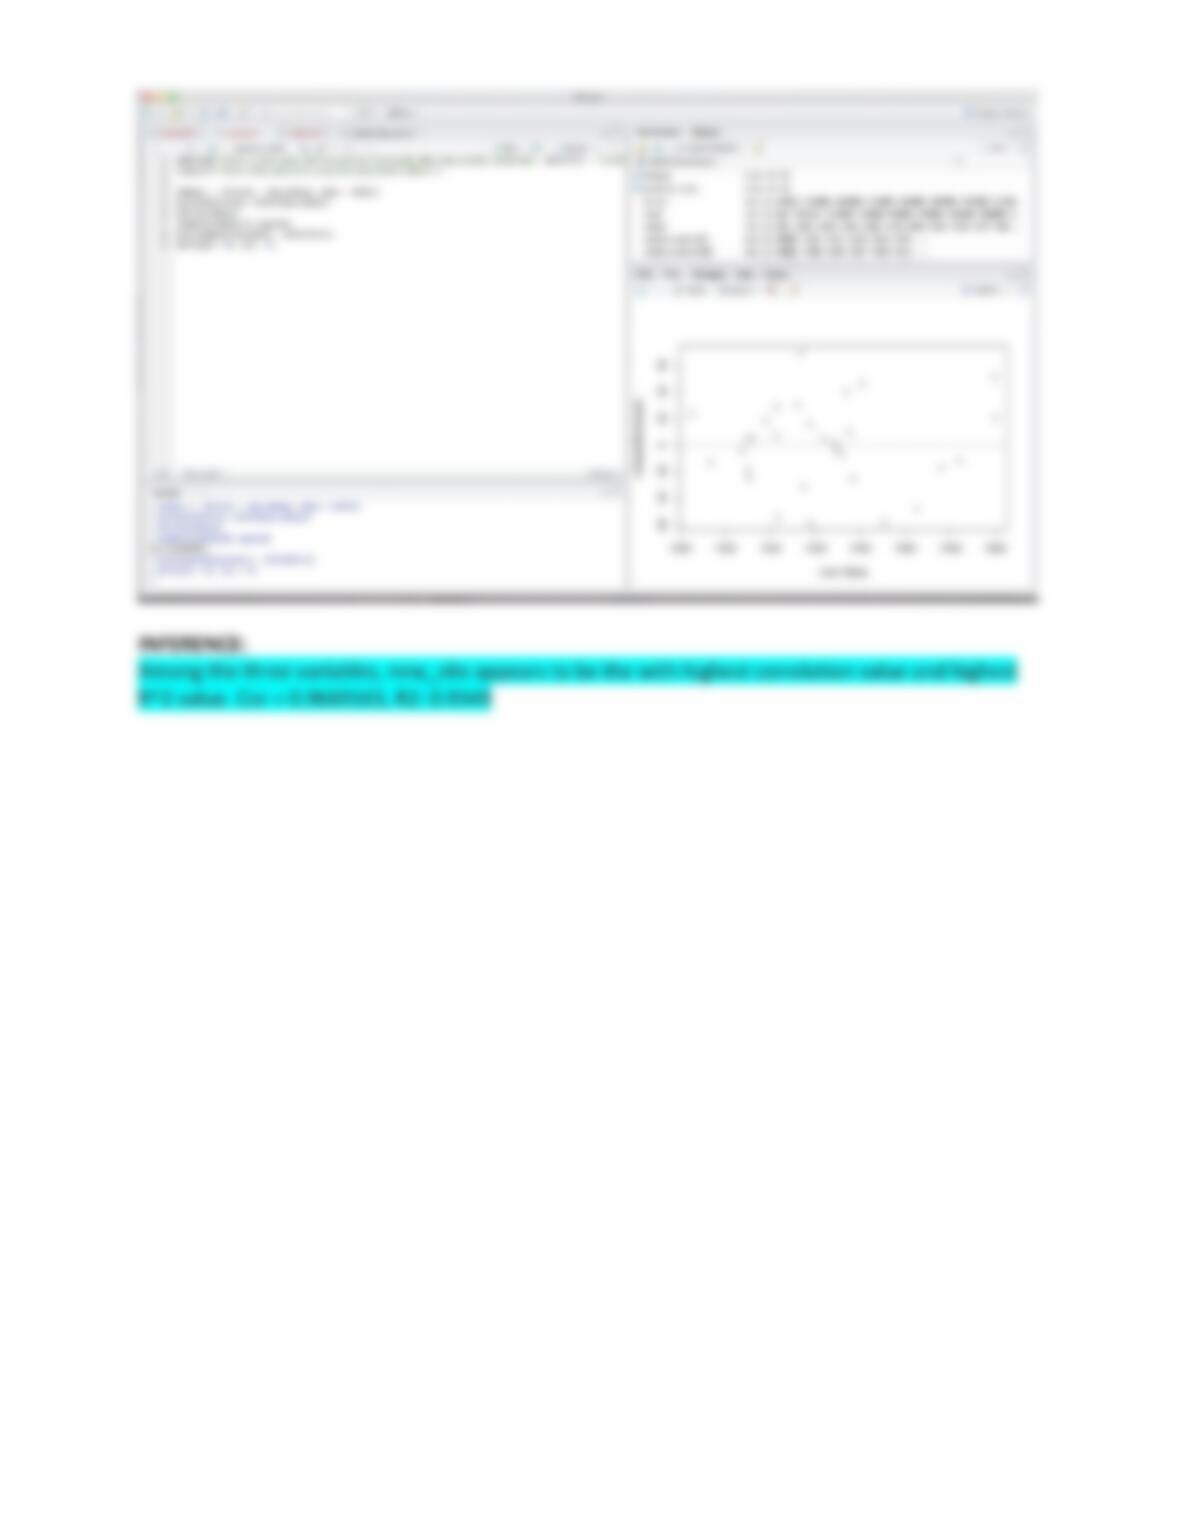
2. How does this relationship compare to the relationship between runs and at_bats? Use the
R2 values from the two model summaries to compare. Does your variable seem to
predict runs better than at_bats? How can you tell?
CODE:
m1 <– lm(runs ~ at_bats, data = mlb11)