AHS
104: Introduction to Atmospheric
Science
Lab Exercise 8: Winds
Aloft
Introduction: Upper Air Data
Upper air data are collected twice each day for hundreds of weather stations around the
globe. At 00Z and 12Z Greenwich Mean Time, radiosonde balloons are launched which
take measurements of temperature, humidity, and barometric pressure. Winds are
obtained from the balloon ascents by tracking the balloon drift as it rises through the
atmosphere. Upper air observations are conventionally plotted and analyzed on constant
pressure surfaces. These include the 850 mb, 700 mb, 500 mb, and 300 mb surfaces. In
this exercise, we will focus on the 500 mb surface and the relationship between the winds
on this surface and the contours lines of the 500 mb height.
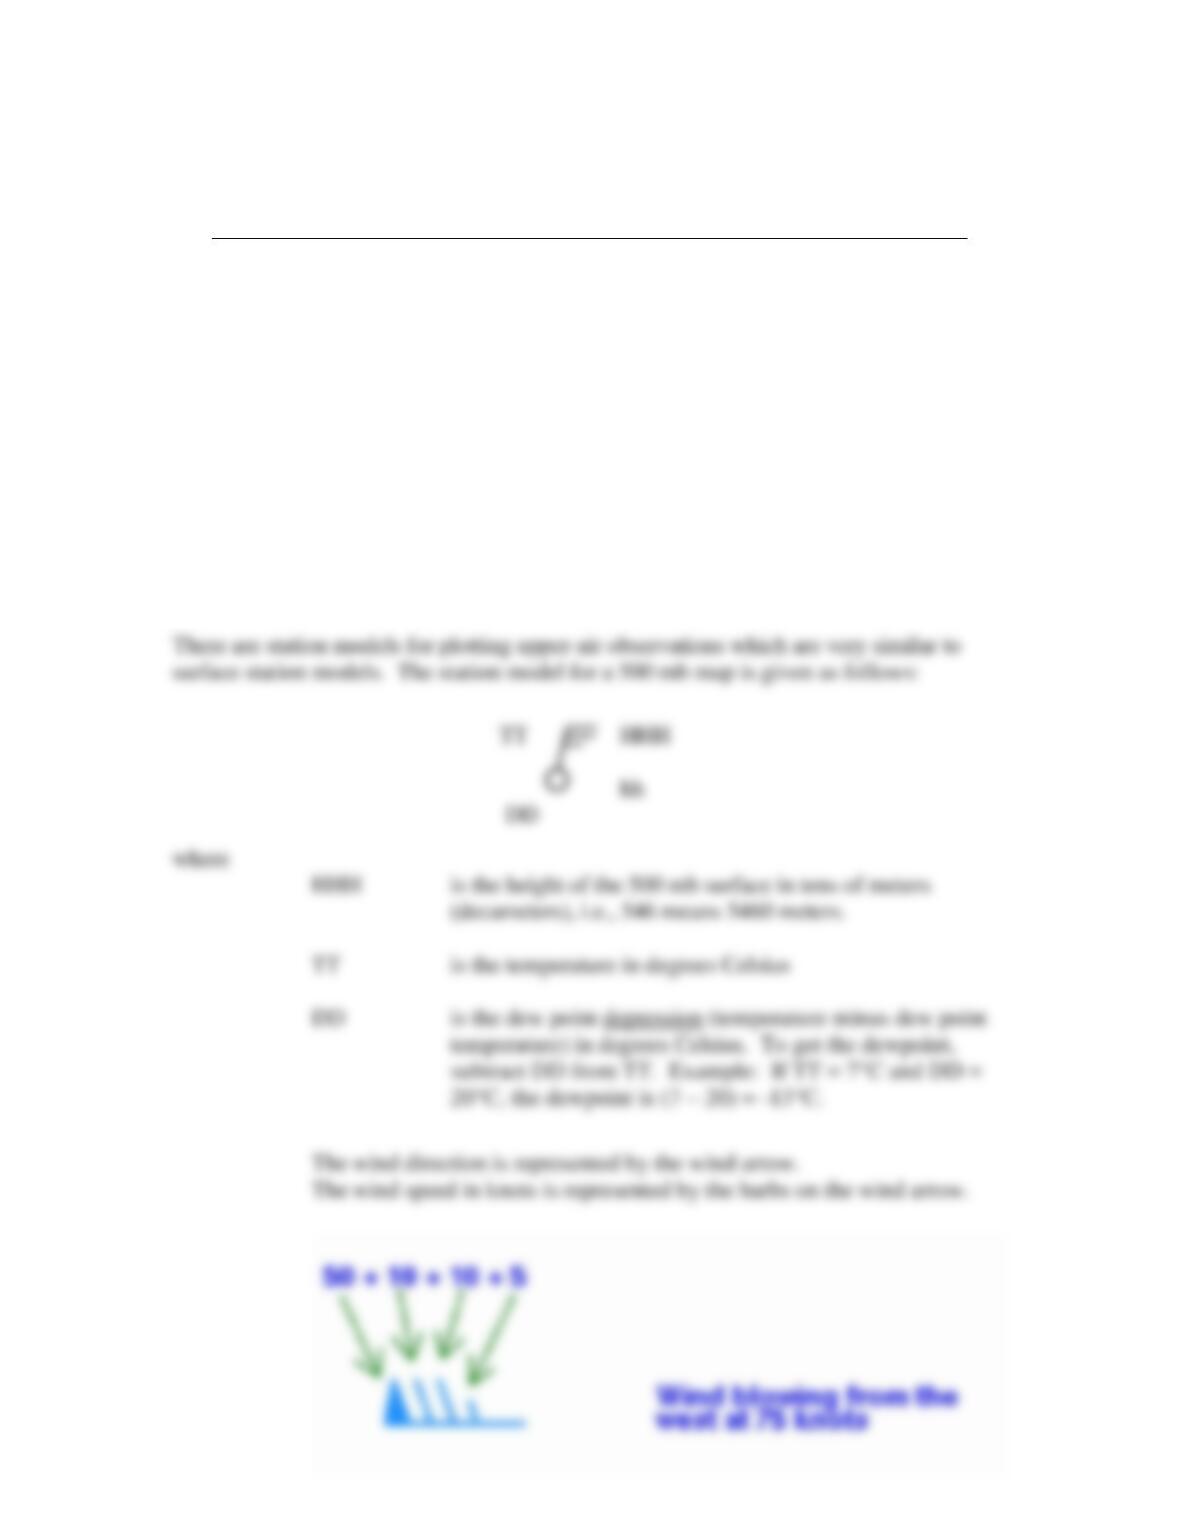
Station Models on Upper Air Charts