Financial Institution Analysis for Years 2011 & 2013
Table of Contents
FINANCIAL RATIOS…………………………………………………………………………………………………………….…4
CLICOR ANALYSIS…………………………………………………………………………………………………………………5
1
Credit Risk……………………………………………………………………………………………………………………………...5
Allowance for Loan Losses to Total Loans………………………………………………………………………..…..….6
Provision for Loan Losses to Total Loans………………………………………………………………………….…..….7
Net Charge-O!s to Total Loans……………………………………………………………………………..…..…..…..….8
Nonperforming Assets to Total Loans………………………………………………………………………...…..…..….8
Liquidity Risk…………………………………………………………………………………………………………………………..8
Interest Rate Risk…………………………………………………………………………………………………………...…..…11
Capital Risk……………………………………………………………………………………………………………..……..…....12
Opera*onal Risk…………………………………………………………………………………………………..……..…..…...14
Market Risk……………………………………………………………………………………………………………………..…...14
ROE……………………………………………………………………………………………………………………………....…..….15
PROFIT MARGIN…………………………………………………………………………………………………………………….16
Interest Expense……………………………………………………………………………………………….……..…..…...16
Non-Interest Expense (NIE)………………………………………………………………………………………………....19
Provision for Loan Losses (PLL)………………………………………………………………………………..…..…..….21
Taxes…………………………………………………………………………………………………………………………..…...23
ASSET UTILIZATION……………………………………………………………………………………………………..…..…....23
Interest Income………………………………………………………………………………………………………………….24
Noninterest Income…………………………………………………………………………………………………..…..…..28
EQUITY MULTIPLIER……………………………………………………………………………………………………....……...31
CONCLUSION………………………………………………………………………………………………………………....…...32
Appendix Page 1………………………………………………………………………………………………..…..…..…..……....34
Appendix Page 2………………………………………………………………………………………………..…..…..…..……....35
Appendix Page 3………………………………………………………………………………………………..…..…..…..……....36
REFERENCES………………………………………………………………………………………………………………….……..37
2
Financial institutions form a connection of world economies and allow consumers to gain
credit to continue the growth of these economies. We chose KeyBank to be analyzed and two
nonconsecutive years of financial statement data was evaluated in order to determine their
balance sheet stability and possible preparedness concerning future risks. Analysis was
conducted using information contained in the 10-K from the year-end December 31, 2011 and
December 31, 2013.
KeyBank offers many services through two major business segments depending on the
client. These business segments are Key Community Bank (KeyBank) and Key Corporate Bank
(KeyCorp). Key Community Bank makes up 20%, on average, of the total income for the year,
Key Corporate Bank makes up 50%, on average, of total income for the year, and Corporate
Treasury, which is the primary investing unit, comprises the remaining portion of income.
KeyBank is a financial services holding company that offers a wide range of services to
individual, corporate, and institutional clients. KeyBank offers services such as commercial
banking, commercial leasing, consumer finance, and investment banking. As of the year end
2013, they have 1028 operating branches spanning from 12 states from Maine to Washington.
Their major concentration of branches is located in the northeastern and northwestern areas of
the United States. They have 1,335 automated teller machines in service, mobile banking
capabilities, and operate a telephone call center for clients. KeyBank currently has $92.9 billion
in assets as of year-end December 31, 2013.
3

FINANCIAL RATIOS
2011 2013
Return on Equity (ROE) 9.27% 8.82%
Return on Assets (ROA) 1.04% 0.98%
Asset Utilization 5.29% 4.72%
Equity Multiplier 894.83% 900.52%
Profit Margin
Profit Margin 19.59% 20.75%
Interest Expense/Revenues 13.24% 6.73%
Provision for loan losses/Revenues -1.28% 2.96%
Non-interest Expense/Revenues 59.40% 64.30%
Income Tax/Revenues 7.86% 6.18%
Interest Expense/Revenues
Interest Expense/Revenues 13.24% 6.73%
Interest Expense/Liabilities (cost) 0.79% 0.36%
Interest bearing deposits/Assets 46.02% 46.55%
Provision for loan losses/Revenues
Provision for loan losses/Revenues -1.28% 2.96%
Provision for loan losses/Interest Income -2.08% 4.96%
Provision for loan losses/Net Interest Income -2.65% 5.59%
Provision for loan losses/Total Loans -0.12% 0.24%
Non-interest Expense/Revenues
Non-interest Expense/Revenues 59.40% 64.30%
Salaries & Wage Expense/NIE 54.48% 57.06%
Occupancy Expense/NIE 9.25% 9.75%
Equipment Expense/NIE 3.62% 2.37%
Other Expense/NIE 13.12% 11.99%
Taxes/Revenues
Taxes/Taxable Income 27.43% 21.56%
Taxable Income/Revenues 28.64% 28.66%
Asset Utilization
Interest Income/Total Assets 3.25% 2.82%
Interest Income/Total Revenue 61.51% 59.74%
Interest Income/Total earning assets 3.96% 3.48%
Net Interest Income/Total earning assets 3.11% 3.08%
Non-Interest Income/Total Assets
Non-Interest Income/Total Assets 2.04% 1.90%
Fee Income/NII 18.09% 22.14%
Service Charges/NII 12.94% 13.42%
Investment Gains/NII 4.31% 2.94%
Other Income/NII 7.36% 6.63%
4

Credit Risk
Allowance for Loan Loss/Total Loans 2.00% 1.54%
Provision for Loan Loss/Total Loans -0.12% 0.24%
Net Charge-Offs/Total Loans 1.08% 0.31%
NPA/Total Loans 1.45% 0.96%
Liquidity Risk
Hot Money Ratio 205.71% 330.69%
Cash/Total Assets 0.78% 0.66%
Interest Rate Risk
Gap = Rate sensitive Asset – Rate Sensitive
Liability 13,525,502,141 8,220,036,883
Gap/Earning Assets 18.54% 10.90%
Gap Ratio = RSA/RSL 1.33 1.19
Capital Risk
Tier 1 Ratio = Tier 1 Capital/Risk Adjusted Assets 12.99% 11.96%
Total Capital Ratio = Tier 1 + Tier 2/RAA 16.51% 14.33%
Leverage Ratio = Tier 1/Total Assets 11.79% 11.22%
CLICOR ANALYSIS
As a financial institution there are many variables to consider when examining the health
of a bank and how prepared it is for potential changes. The United States’ economy has
experienced large fluctuations in the past five years and is preparing for interest rate hikes in the
coming year. Also, most banks are interrelated worldwide so the global economy needs to be
taken into account especially with the ECB’s actions, current Middle Eastern conflicts, and
currency fluctuations. Any one of these will have some effect on an institution’s health, so a
thorough analysis should be conducted to ensure the longevity of operation under its current
name.
Credit Risk
Credit risk is the probability that some of a bank’s assets, specifically their loans, will decline in
value or become worthless due to borrowers defaulting. High credit risk is a significant point of
5
vulnerability in a bank, because it only takes a small percentage of total loans to go bad to wipe out the
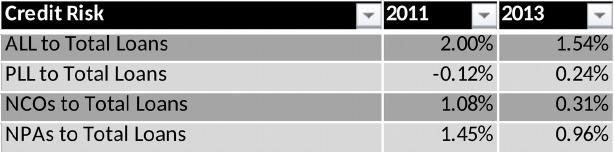
bank’s equity. To measure KeyBank’s credit risk, we will look at each of the following ratios: Allowance
for loan losses to total loans, provision for loan losses to total loans, net charge-offs to total loans, and
nonperforming assets to total loans. Below is a table representing the analyzed ratios.
Through the ratios given above, we see that KeyBank has experienced decreased credit risk from
2011 to 2013. The bank has made strides to improving the quality of its assets as well as reducing its
exposure to higher risk businesses through the sale risky loans like Marine/RV financing and residential
construction loans. This has resulted in steady declines in net charge offs and nonperforming assets,
which in turn requires the bank to carry lower allowances and provisions for loan losses. Due to these
factors, we find KeyBank has done an effective job at lowering its credit risk.
Allowance for Loan Losses to Total Loans
KeyBank’s allowance for loan loss (ALL) fell from $1.004 billion in 2011 to $848 million in
2013. Total loans increased from $50.303 billion in 2011 to $55.068 billion in 2013. This resulted in a
decrease in ALL to total loans from 2% in 2011 to 1.54% in 2013. ALL to total loans measures how much
coverage a bank has in the event of loan defaults, which means KeyBank had less coverage in 2013 than
they did in 2011. The bank attributes this reduction in coverage to improvement in credit quality of the
loan portfolio. The improved quality of new loan originations coupled with decreasing nonperforming
loans and net charge-offs, have resulted in the bank needing less coverage. Thus, this ratio is a sign of
reduction in the bank’s credit risk.
6

Provision for Loan Losses to Total Loans
KeyBank’s provision for loan losses (PLL) increased significantly, from a credit of $60 million to
a provision of $130 in 2013. This resulted in an increase of PLL to total loans, from a -0.12% in 2011 to
0.24% in 2013. PLL to total loans measures what percentage of total loans is anticipated to fail.
Therefore, it appears that KeyBank anticipated more loan failures in 2013 than in 2011.
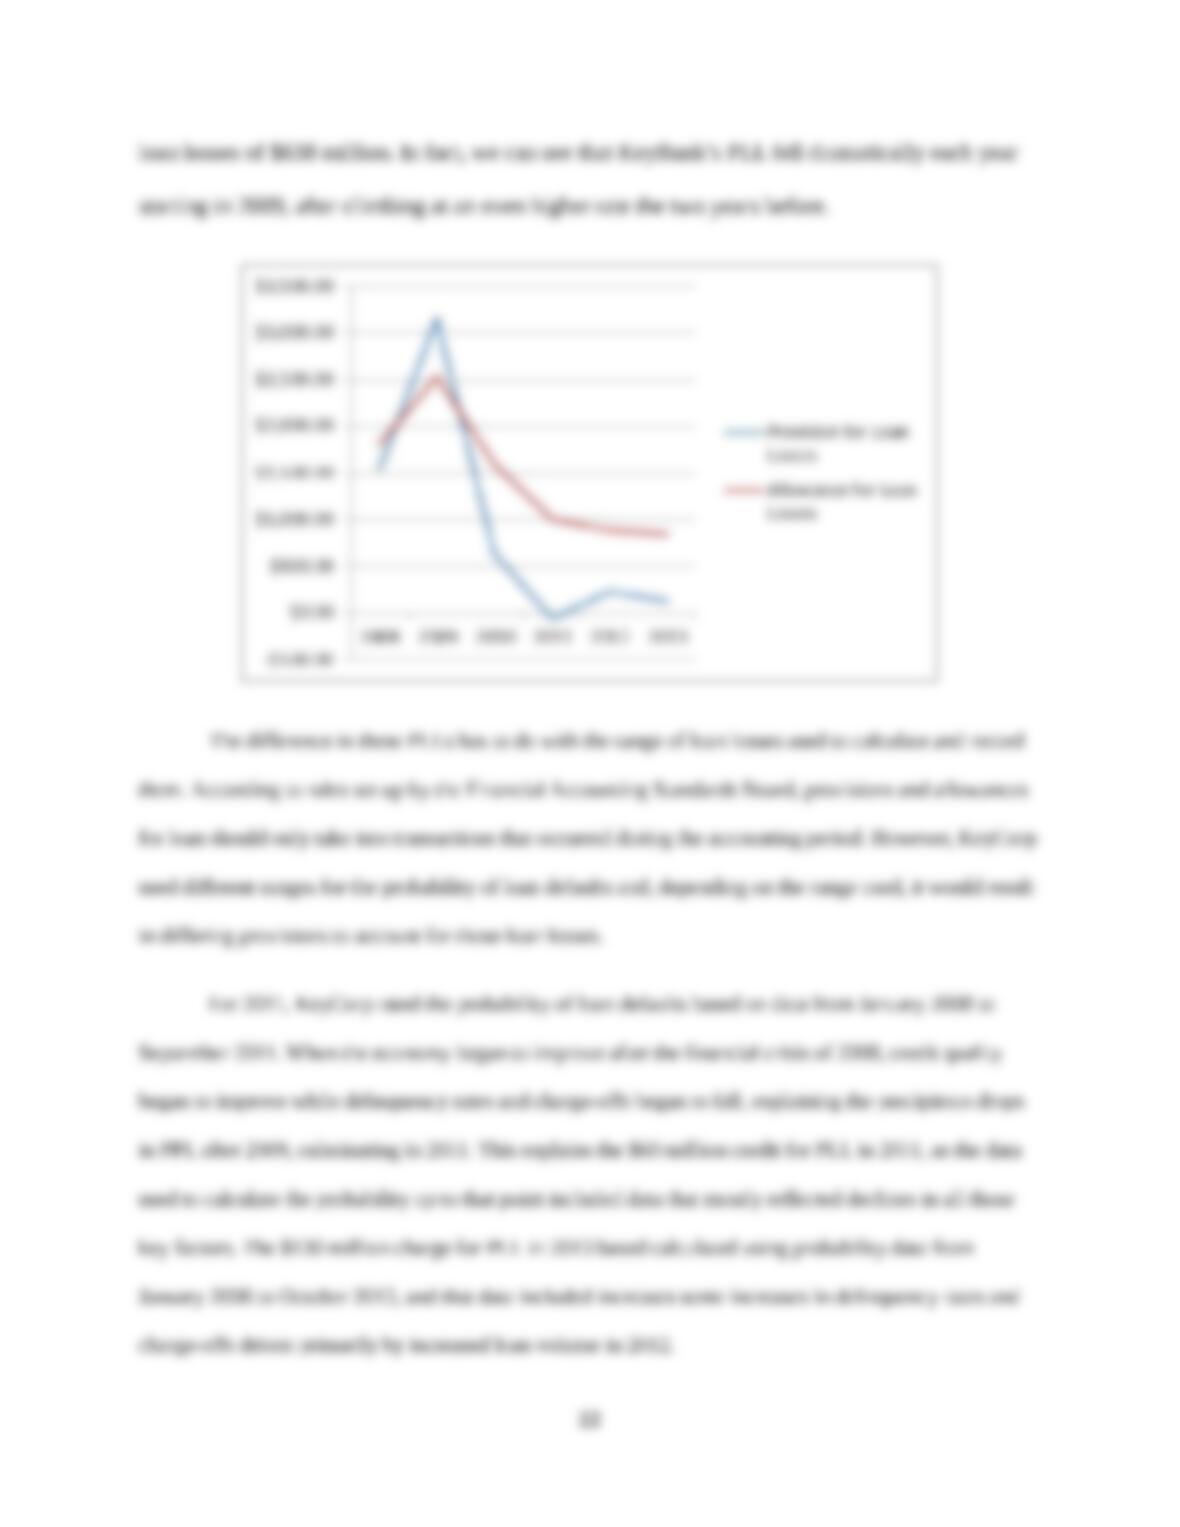
The difference in these PLLs has to do with the range of loan losses used to calculate and record
them. According to rules set up by the Financial Accounting Standards Board, provisions and allowances
for loan should only take into transactions that occurred during the accounting period. However, KeyBank
used different ranges for the probability of loan defaults and, depending on the range used, it would result
in differing provisions to account for those loan losses.
For 2011, KeyBank rated the probability of loan defaults based on data from January 2008 to