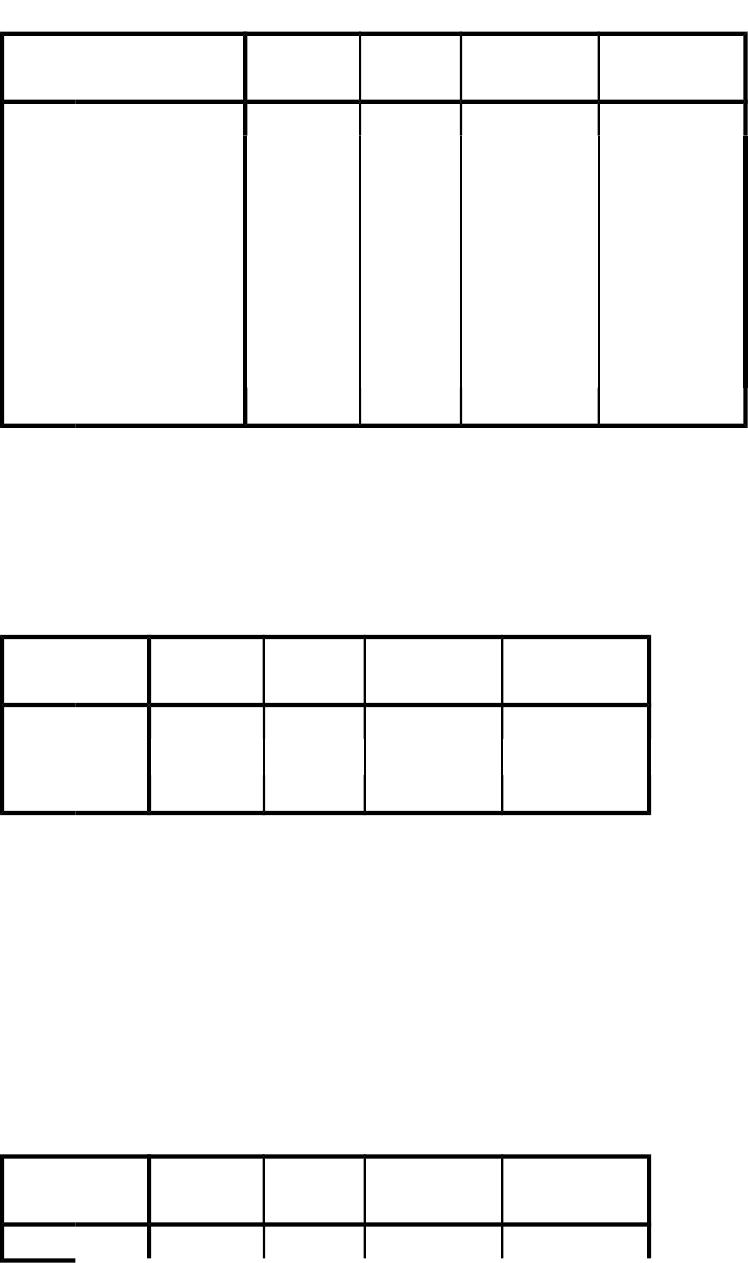
Section 1: Demographics
hashtag
Frequency Percent Valid Percent Cumulative
Percent
Valid
#eventsecurity 30 12.5 12.5 12.5
#isis 30 12.5 12.5 25.0
#muslim 30 12.5 12.5 37.5
#nationalsecurity 30 12.5 12.5 50.0
#police 30 12.5 12.5 62.5
#terror 30 12.5 12.5 75.0
#terrorism 30 12.5 12.5 87.5
#war 30 12.5 12.5 100.0
Total 240 100.0 100.0
As seen in the table above, I had about the same number of tweets per hashtag. Each hashtag
made up about 13 percent of all my tweets. As seen in the table above, my sample was n=240
tweets.
Section 2: Dependent Variable
Y_dependent_Strategy
Frequency Percent Valid Percent Cumulative
Percent
Valid
no 173 72.1 72.1 72.1
yes 67 27.9 27.9 100.0
Total 240 100.0 100.0
As seen in the table above, 72 percent of the tweets had no strategies used by police; 28 percent
shown having used strategies to fight back against terrorism. Examples of language and images
in the tweets that meant police brutality included the following. Some tweets pertained to the
international police strategies by doing simulations, military using social media and drones,
iphones,
X1_independent_Threat
Frequency Percent Valid Percent Cumulative
Percent
Valid no 18 7.5 7.5 7.5
yes 222 92.5 92.5 100.0
Total 240 100.0 100.0
X2_independent_Violence
Frequency Percent Valid Percent Cumulative
Percent
Valid
no 151 62.9 62.9 62.9
yes 89 37.1 37.1 100.0
Total 240 100.0 100.0
X3_independent_Security
Frequency Percent Valid Percent Cumulative
Percent
Valid
no 178 74.2 74.2 74.2
yes 62 25.8 25.8 100.0
Total 240 100.0 100.0
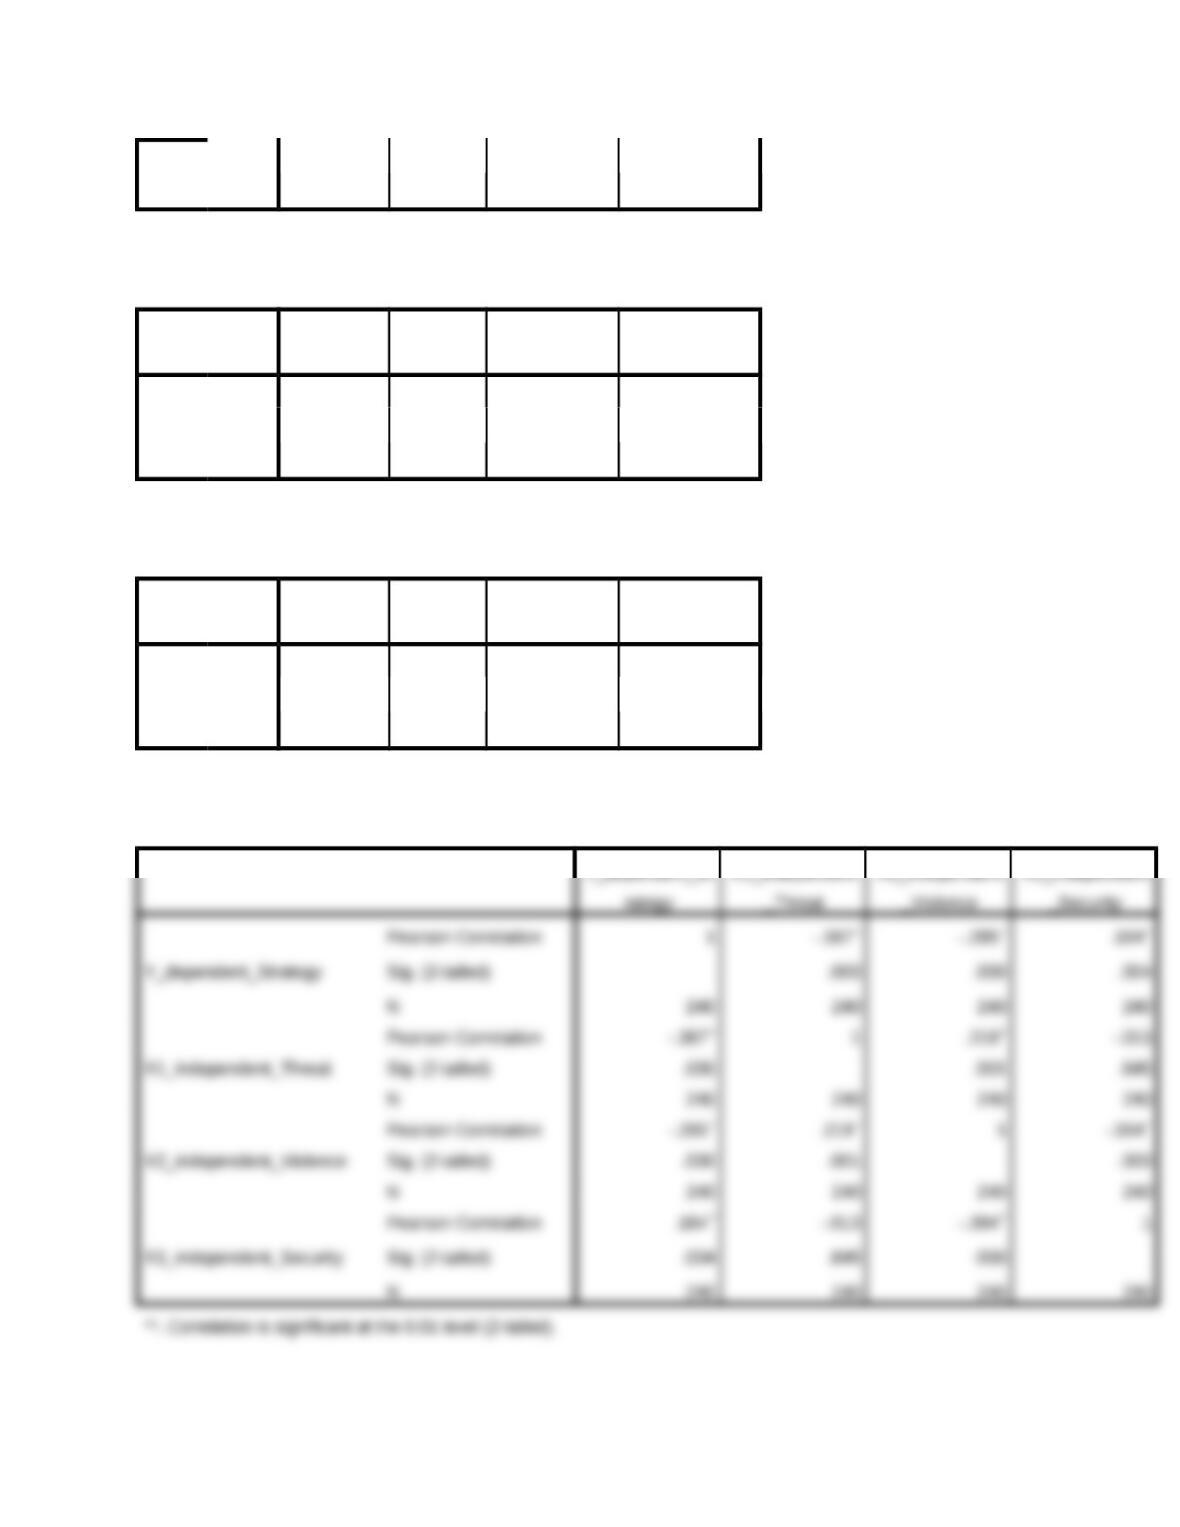
Correlations