JouleSort: A Balanced Energy-Efficiency Benchmark
Suzanne Rivoire
Stanford University
Mehul A. Shah
HP Labs
Parthasarathy
Ranganathan
HP Labs
Christos
Kozyrakis
Stanford University
ABSTRACT
The energy efficiency of computer systems is an important
concern in a variety of contexts. In data centers, reducing
energy use improves operating cost, scalability, reliability,
and other factors. For mobile devices, energy consumption
directly affects functionality and usability. We propose and
motivate JouleSort, an external sort benchmark, for evaluat-
ing the energy efficiency of a wide range of computer systems
from clusters to handhelds. We list the criteria, challenges,
and pitfalls from our experience in creating a fair energy-
efficiency benchmark. Using a commercial sort, we demon-
strate a JouleSort system that is over 3.5x as energy-efficient
as last year’s estimated winner. This system is quite differ-
ent from those currently used in data centers. It consists of
a commodity mobile CPU and 13 laptop drives, connected
by server-style I/O interfaces.
Categories and Subject Descriptors
H.2.4 [Information Systems]: Database Management—
Systems
General Terms
Design, Experimentation, Measurement, Performance
Keywords
Benchmark, Energy-Efficiency, Power, Servers, Sort
1. INTRODUCTION
In contexts ranging from large-scale data centers to mobile
devices, energy use in computer systems is an important
concern.
In data center environments, energy efficiency affects a
number of factors. First, power and cooling costs are signifi-
cant components of operational and up-front costs. Today, a
typical data center with 1000 racks, consuming 10MW total
power, costs $7M to power and $4-$8M to cool per year, with
Permission to make digital or hard copies of all or part of this work for
personal or classroom use is granted without fee provided that copies are
not made or distributed for profit or commercial advantage and that copies
bear this notice and the full citation on the first page. To copy otherwise, to
republish, to post on servers or to redistribute to lists, requires prior specific
permission and/or a fee.
SIGMOD’07, June 11–14, 2007, Beijing, China.
Copyright 2007 ACM 978-1-59593-686-8/07/0006 …$5.00.
$2-$4M of up-front costs for cooling equipment [28]. These
costs vary depending upon the installation, but they are
growing rapidly and have the potential eventually to outstrip
the cost of hardware [2]. Second, energy use has implications
for density, reliability, and scalability. As data centers house
more servers and consume more energy, removing heat from
the data center becomes increasingly difficult [27]. Since
the reliability of servers and disks decreases with increased
temperature, the power consumption of servers and other
components limits the achievable density, which in turn lim-
its scalability. Third, energy use in data centers is starting
to prompt environmental concerns of pollution and excessive
load placed on local utilities [28]. Energy-related concerns
are severe enough that companies like Google are starting to
build data centers close to electric plants in cold-weather cli-
mates [24]. All these concerns have led to improvements in
cooling infrastructure and in server power consumption [28].
For mobile devices, battery capacity and energy use di-
rectly affect usability. Battery capacity determines how long
devices last, constrains form factors, and limits functional-
ity. Since battery capacity is limited and improving slowly,
device architects have concentrated on extracting greater
energy efficiency from the underlying components, such as
the processor, the display, and the wireless subsystems in
isolation [20, 29, 31].
To drive energy-efficiency improvements, we need bench-
marks to assess their effectiveness. Unfortunately, there has
been no focus on a complete benchmark, including a work-
load, metric, and guidelines, to gauge the efficacy of energy
optimizations from a whole-system perspective. Some efforts
are under way to establish benchmarks for energy efficiency
in data centers [33, 35] but are incomplete. Other work has
emphasized metrics such as the energy-delay product or per-
formance per Watt to capture energy efficiency for proces-
sors [13, 21, 27] and servers [34] without fixing a workload.
Moreover, while past emphasis on processor energy efficiency
has led to improvements in overall power consumption, there
has been little focus on the I/O subsystem, which plays a
significant role in total system power for many important
workloads and systems.
In this paper, we propose JouleSort as a holistic bench-
mark to drive the design of energy-efficient systems. Joule-
Sort uses the same workload as the other external sort bench-
marks [1, 17, 25], but its metric incorporates total energy,
which is a combination of power consumption and perfor-
mance. The benchmark can be summarized as follows:
•Sort a fixed number of randomly permuted 100-byte
records with 10-byte keys.
•The sort must start with input in a file on non-volatile
store and finish with output in a file on non-volatile
store.
•There are three scale categories for JouleSort: 108(∼
10GB), 109(∼100GB), and 1010 (∼1TB) records
•The winner in each category is the system with the
minimum total energy use.
We choose sort as the workload for the same basic rea-
son that the Terabyte Sort, MinuteSort, PennySort, and
Performance-price Sort benchmarks do [16, 17, 25]: it is
simple to state and balances system component use. Sort
stresses all core components of a system: memory, CPU,
and I/O. Sort also exercises the OS and filesystem. Sort is
a portable workload; it is applicable to a variety of systems
from mobile devices to large server configurations. Another
natural reason for choosing sort is that it represents sequen–
tial I/O tasks in data management workloads.
JouleSort is an I/O-centric benchmark that measures the
energy efficiency of systems at peak use. Like previous sort
benchmarks, one of its goals is to gauge the end-to-end ef-
fectiveness of improvements in system components. To do
so, JouleSort allows us to compare the energy efficiencies
of a variety of disparate system configurations. Because of
the simplicity and portability of sort, previous sort bench-
marks have been technology trend bellwethers, for example,
foreshadowing the transition from supercomputers to clus-
ters. Similarly, an important purpose of JouleSort is to chart
past trends and gain insight into future trends in energy ef-
ficiency.
Beyond the benchmark definition, our main contributions
are twofold. First, we motivate and describe pitfalls sur-
rounding the creation of a fair energy-efficiency benchmark.
We justify our fairest formulation, which includes three scale
factors that correspond naturally to the dominant classes
of systems found today: mobile, desktop, and server. Al-
though we support both Daytona (commercially supported)
and Indy (“no-holds-barred”) categories for each scale, we
concentrate on Daytona systems in this paper. Second, we
present the winning 100GB JouleSort system that is over
3.5x more efficient (∼11300 SortedRecs/Joule for 100GB)
than last year’s estimated winner (∼3200 SortedRecs/Joule
for 55GB). This system shows that a focus on energy effi-
ciency leads to a unique configuration that is hard to find
pre-assembled. Our winner balances a low-power, mobile
processor with numerous laptop disks connected via server-
class PCI-e I/O cards and uses a commercial sort, NSort [26].
The rest of the paper is organized as follows. In Section 2,
we estimate the energy efficiency of past sort benchmark
winners, which suggests that existing sort benchmarks can-
not serve as surrogates for an energy-efficiency benchmark.
Section 3 details the criteria and challenges in designing
JouleSort and lists issues and guidelines for proper energy
measurement. In Section 4, we measure the energy con-
sumption of unbalanced and balanced systems to motivate
our choices in designing our winning system. The balanced
system shows that the I/O subsystem is a significant part of
total power.
Section 5 provides an in-depth study of our 100GB Joule-
Sort system using NSort [26]. In particular, we show that
the most energy-efficient, cost-effective, and best-performing
configuration for this system is when the sort is CPU-bound.
0
500
1000
1500
2000
2500
3000
3500
1996 1998 2000 2002 2004 2006 2008
Year
SortedRecs/Joule
Pennysort Daytona
Pennysort Indy
MinuteSort Daytona
MinuteSort Indy
Terabyte Daytona
Terabyte Indy
Datamation
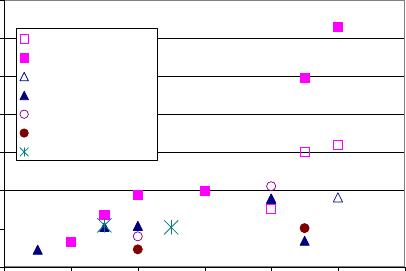
Figure 1: Estimated energy-efficiency of previous
winners of sort benchmarks.
We also find that both the choice of filesystem and in-memory
sorting algorithm affect energy efficiency. Section 6 discusses
the related work, and Section 7 presents limitations and fu-
ture directions.
2. HISTORICAL TRENDS
In this section, we seek to understand if any of the exist-
ing sort benchmarks can serve as a surrogate for an energy-
efficiency benchmark. To do so, we first estimate the Sort-
edRecs/Joule ratio, a measure of energy efficiency, of the
past decade’s sort benchmark winners. This analysis reveals
that the energy efficiency of systems designed for pure per-
formance (i.e. MinuteSort, Terabyte Sort, and Datamation
winners) has improved slowly. Moreover, systems designed
for price-performance (i.e. PennySort winners) are compar-
atively more energy-efficient, and their energy efficiency is
growing rapidly. However, since our 100GB JouleSort sys-
tem’s energy efficiency is well beyond what growth rates
would predict for this year’s PennySort winner, we conclude
that existing sort benchmarks do not inherently provide an
incentive to optimize for energy efficiency, supporting the
need for JouleSort.
2.1 Methodology
Figure 1 shows the estimated SortedRecs/Joule metric for
the past sort benchmark winners since 1997. We compute
these metrics from the published performance records and
our own estimates of power consumption since energy use
was not reported. We obtain the performance records and
hardware configuration information from the Sort Bench-
mark website and the winners’ posted reports [16].
We estimate total energy during system use with a straight-
forward approach from the power-management community.
Since CPU, memory, and disk are usually the main power-
consuming system components, we use individual estimates
of these to compute total power. For memory and disks,
we use the HP Enterprise Configurator [19] power calcu-
lator to yield a fixed power of 13W per disk and 4W per
DIMM. Some of the sort benchmark reports only mention
total memory capacity and not the number of DIMMs; in
those cases, we assume a DIMM size appropriate to the era
of the report. The maximum power specs for CPUs, usually

quoted as thermal design power (TDP), are much higher
than the peak numbers seen in common use; thus, we derate
these power ratings by a 0.7 factor. Although a bit con-
servative, this approach allows reasonable approximations
for a variety of systems. When uncertain, we assume the
newest possible generation of the reported processor as of
the sort benchmark record because a given CPU’s power
consumption improves with shrinking feature sizes. Finally,
to account for power supplies inefficiencies, which can vary
widely [3, 5], and other components, we scale total system
power derived from component-level estimates by 1.2 for
single-node systems. We use a higher factor, 1.6, for clusters
to account for additional components, such as networking,
management hardware, and redundant power supplies.
Our power estimates are intended to illuminate coarse his-
torical trends and are accurate enough to support the high-
level conclusions in this section. We experimentally vali-
dated this approach against some server and desktop-class
systems, and its accuracy was between 2% and 25%.
2.2 Analysis
Although previous sort benchmark winners were not con-
figured with power consumption in mind, they roughly re-
flect the power characteristics of desktop and higher-end sys-
tems in their day. Thus, from the data in Figure 1, we can in-
fer qualitative information about the relative improvements
in performance, price-performance, and energy efficiency in
the last decade. Figure 1 compares the energy efficiency of
previous sort winners using the SortedRecs/Joule ratio and
supports the following observations.
Systems optimized for price-performance, i.e. PennySort
winners, clearly are more energy-efficient than the other sort
benchmark winners, which were optimized for pure perfor-
mance. There are two reasons for this effect. First, the
price-performance metric motivates system designers to use
fewer components, and thus less power. Second, it provides
incentive to use cheaper, commodity components which, for
a given performance point, traditionally have used less en-
ergy than expensive, high-performance components.
The energy efficiency of cost-conscious systems has im-
proved faster than that of performance-optimized systems,
which have hardly improved. Others have also observed a
flat energy-efficiency trend for cluster hardware [2]. Much of
the growth in the PennySort curve is from the last two Indy
winners, which have made large leaps in energy efficiency.
In 2005, algorithmic improvements and a minimal hardware
configuration played a role in this improvement, but most
importantly, CPU design trends had finally swung toward
energy efficiency. The processor used in the 2005 PennySort
winner has 6x the clock frequency of its immediate prede-
cessor, while only consuming 2x the power. Overall, the
2005 sort had 3x better performance than the previous data
point, while using 2x the power. The 2006 PennySort win-
ner, GPUTeraSort, increased energy efficiency by introduc-
ing a new system component, the graphics processing unit
(GPU), and utilizing it very effectively. The chosen GPU is
inexpensive and comparable in power consumption (57W) to
the CPU (80W), but it provides better streaming memory
bandwidth than the CPU.
This latest winner, in particular, shows the danger of rely-
ing on energy benchmarks that focus only on specific hard-
ware like CPU or disks, rather than end-to-end efficiency.
Such specific benchmarks would only drive and track im-
Benchmark SRecs/sec SRecs/$ SRecs/J
PennySort 50%/yr. 57%/yr. 24%/yr.
Minute, Terabyte,
and Datamation 37%/yr. n/a 12%/yr.
Table 1: This table shows the estimated yearly
growth in pure performance, price-performance,
and energy efficiency of past winners.
provements of existing technologies and may fail to antici-
pate the use of potentially disruptive technologies.
Since price-performance winners are more energy-efficient,
we next examine whether the most cost-effective sort implies
the best achievable energy-efficient sort. To do so, we first
estimate the growth rate of sort winners along multiple di-
mensions. Table 1 shows the growth rate of past sort bench-
mark winners along three dimensions: performance (Sort-
edRecs/sec), price-performance (SortedRecs/$), and energy
efficiency (SortedRecs/Joule). We separate the growth rates
into two categories based on the benchmark’s optimization
goal: price- or pure performance, since the goal drives the
system design. For each category, we calculate the growth
rate as follows. We choose the best system (according to the
metric) in each year and fit the result with an exponential.
Table 1 shows that PennySort systems are improving al-
most at the pace of Moore’s Law along the performance and
price-performance dimensions. The pure performance sys-
tems, however, are improving much more slowly, as noted
elsewhere [16].
More importantly, our analysis shows much slower esti-
mated growth in energy efficiency than in the other two
metrics for both benchmark categories. Given last year’s
estimated PennySort winner provides ∼3200 SRecs/J, our
current JouleSort winner at ∼11300 SRecs/J is nearly 3x
the expected value of ∼4000 SRecs/J for this year. This
result suggests that we need a benchmark focused on en-
ergy efficiency to promote development of the most energy-
efficient sorting systems and allow for disruptive technologies
in energy efficiency irrespective of cost.
3. BENCHMARK DESIGN
In this section, we detail the criteria and challenges in de-
signing an energy-efficiency benchmark. We describe some
of the pitfalls of our initial specifications and how the bench-
mark has evolved. We also specify rules of the benchmark
with respect to both workload and energy measurement.
3.1 Criteria
Although past studies have proposed energy-efficiency met-
rics [13, 21, 34, 27] or power measurement techniques [9],
none provide a complete benchmark: a workload, a metric
of comparison, and rules for running the workload and mea-
suring energy consumption. Moreover, these studies tradi-
tionally have focused on comparing existing systems rather
than providing insight into future technology trends. We set
out to design an energy-oriented benchmark that addresses
these drawbacks with the criteria below in mind. While
achieving all these criteria simultaneously is hard, we strive
to encompass them as much as possible.
Energy-efficiency: The benchmark should measure a sys-
tem’s “bang for the buck,” where bang is work done and
the cost reflects some measure of power use, e.g. average
power, peak power, total energy, and energy-delay. To drive
practical improvements in power consumption, cost should
reflect both a system’s performance and power use. A sys-
tem that uses almost no power but takes forever to complete
a task is not practical, so average and peak power are poor
choices. Thus, there are two reasonable cost alternatives:
energy, a product of execution time and power, or energy-
delay, a product of execution time and energy. The former
weighs performance and power equally while the latter, pop-
ular in CPU-centric benchmarks, places more emphasis on
performance [13]. Since there are other sort benchmarks
that emphasize performance, we chose energy as the cost.
Peak-use: A benchmark can consider system energy in
three important modes: idle, peak-use, or a realistic combi-
nation of the two. Although minimizing idle-mode power
is useful, evaluating this mode is straightforward. Real-
world workloads are often a combination, but designing a
broad benchmark that addresses a number of scenarios is
difficult to impossible. Hence, we chose to focus our bench-
mark on an important, but simpler case: energy efficiency
during peak use. Energy efficiency at peak is the opposite
extreme from idle and gives an upper bound on work that
can be done for a given energy. This operating point influ-
ences design and provisioning constraints for data centers as
well as mobile devices. In addition, for some applications,
e.g. scientific computing, near-peak use can be the norm.
Holistic and Balanced: A single component cannot accu-
rately reflect the overall performance and power character-
istics of a system. Therefore, the workload should exercise
scale websites run parallel analyzes over voluminous log data
across thousands of machines [7]. Laptops and servers con-
tain various kinds of filesystems and databases. Cell phones,
PDAs, and cameras store, retrieve, and process multimedia
data from flash memory.
With previous sort implementations on clusters, super-
computers, SMPs, and PCs [16] as evidence, we believe sort
is portable and inclusive. It stresses I/O, memory, and the
CPU, making it holistic and balanced. Moreover, the fastest
sorts tend to run most components at near-peak utilization,
so sort is not an idle-state benchmark. Finally, this work-
load is relatively history-proof. While the parameters have
changed over time, the essential sorting task has been the
same since the original DatamationSort benchmark [1] was
proposed in 1985.
3.3 Metric
After choosing the workload, the next challenge is choos-
ing the metric by which to evaluate and compare different
systems. There are many ways to define a single metric that
takes both power and performance into account. We list
some alternatives that we rejected, describe why they are
inappropriate, and choose the one most consistent with the
criteria presented in Section 3.1.
3.3.1 Fixed energy budget
The most intuitive extension of MinuteSort and PennySort
is to fix a budget for energy consumption, and then com-
pare the number of records sorted by different systems while
staying within that energy budget. This approach has two