© M.Rochon – All Rights Reserved.
Model Building
EXAMPLE #1
Regression Statistics
Multiple R 0.952121309
R Square 0.906534987
Adjusted R Square 0.881938931
Standard Error 44.69533285
Observations 25
ANOVA
df SS MS F
Regression 5 368140.3772 73628.07544 36.85692483
Residual 19 37955.78279 1997.672779
Total 24 406096.16
Coefficients Standard Error t Stat P-value
Intercept -1133.981259 320.0193142 -3.543477562 0.002170164
Income 173.2031686 28.20399481 6.141086389 6.66374E-06
Age 23.5499634 32.23447166 0.730583198 0.473947114
Income sq -3.726128809 0.54215586 -6.872800022 1.47938E-06
Age sq -3.868707205 1.179054451 -3.28119469 0.003928216
(Income)( Age) 1.967268217 0.944081682 2.083790263 0.05092077
Revenue Income
Age
We’ve been asked to come up with a regression model for
a fast food restaurant. We know our primary market is
middle-income adults and their children, particularly those
between the ages of 5 and 12.
Dependent variable —restaurant revenue (gross or net)
Predictor variables — family income and age of children
We will be using:
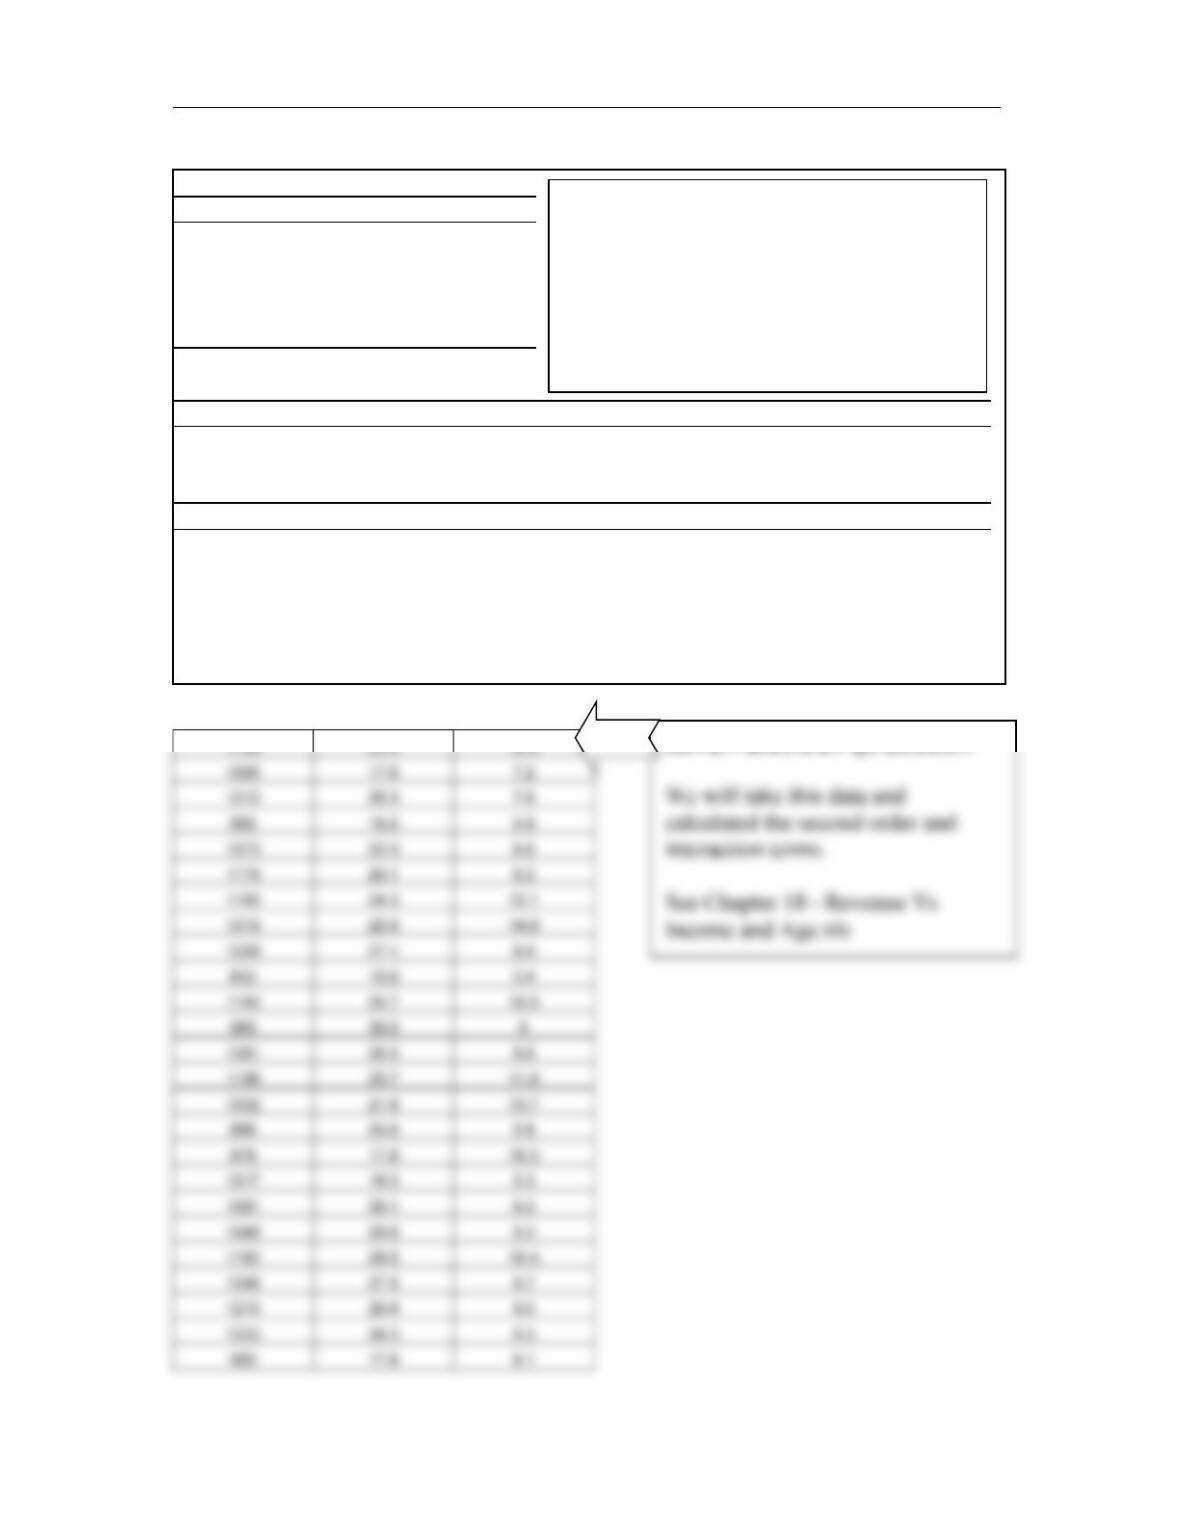
DATA FILE: Chapter 18 – Revenue Vs Income and Age.xls
GIVEN DATA IN QUESTION