CHAPTER 5
COVERAGE OF LEARNING OBJECTIVES
LEARNING
OBJECTIVE
FUNDA–
MENTAL
ASSIGNMENT
MATERIAL
CRITICAL
THINKING
EXERCISES AND
EXERCISES PROBLEMS
CASES, EXCEL,
COLLAB. &
INTERNET
EXERCISES
LO1: Discriminate
between relevant and
irrelevant information
for making decisions.
23,30,37,38 49,50,51,54,57 66
LO2: Apply the decision
process to make
business decisions.
28,29,39
LO3: Construct
absorption and
contribution–margin
income statements and
identify their relevance
for decision making.
A1,B1 24,31,32,33, 34,35 48
LO4: Decide to accept
or reject a special order
using the contribution
margin technique.
A2,B2 36,40 55,56,62 63,64
LO5: Explain why
pricing decisions
depend on the
characteristics of the
market.
A2,B2 25,42 58
LO6: Identify the
factors that influence
pricing decisions in
practice.
26,41 47,52,53 65
LO7: Compute a target
sales price by various
approaches, and
compare the advantages
and disadvantages of
these approaches.
A3 43,44
LO8: Use target costing
to decide whether to
add a new product.
A4,B3 27,45,46 59,60,61
246
CHAPTER 5
Relevant Information and Decision Making: Marketing Decisions
5-A1 (40-50 min.)
1. INDEPENDENCE COMPANY
Contribution Income Statement
For the Year Ended December 31, 2006
(in thousands of dollars)
Sales $1,800
Less variable expenses
Direct material $400
Direct labor 330
Variable manufacturing overhead (Schedule 1) 150
Total variable manufacturing cost of
goods sold $880
Variable selling expenses 60
Variable administrative expenses 23
Total variable expenses 963
Contribution margin $ 837
Less fixed expenses:
Fixed manufacturing overhead (Schedule 2) $322
Selling expenses 240
Administrative expenses 121
Total fixed expenses 683
Operating income $ 154
247

INDEPENDENCE COMPANY
Absorption Income Statement
For the Year Ended December 31, 2006
(in thousands of dollars)
Sales $1,800
Less manufacturing cost of goods sold:
Direct material $400
Direct labor 330
Manufacturing overhead (Schedules 1 and 2) 472
Total manufacturing cost of goods sold 1,202
Gross margin $ 598
Less:
Selling expenses $300
Administrative expenses 144 444
Operating income $ 154
INDEPENDENCE COMPANY
Schedules of Manufacturing Overhead
For the Year Ended December 31, 2006
(in thousands of dollars)
Schedule 1: Variable Costs
Supplies $ 20
Utilities, variable portion 40
Indirect labor, variable portion 90 $150
Schedule 2: Fixed Costs
Utilities, fixed portion $ 12
Indirect labor, fixed portion 40
Depreciation 200
Property taxes 20
Supervisory salaries 50 322
Total manufacturing overhead $472
248

2. Change in revenue $200,000
Change in total contribution margin:
Contribution margin ratio in part 1
is $837 ÷ $1,800 = .465
Ratio times increase in revenue is .465 x $200,000 $ 93,000
Operating income before change 154,000
New operating income $247,000
This analysis is readily done by using data from the
contribution income statement. In contrast, the data in the
absorption income statement must be analyzed and split into
variable and fixed categories before the effect on operating
income can be estimated.
249

5-A2 (25-30 min.)
1. A contribution format, which is similar to Exhibit 5-6,
clarifies the analysis.
Without With
Special Effect of Special
Order Special Order Order
Units 2,000,000 150,000 2,150,000
Total Per Unit
Sales $10,000,000 $660,000 $4 .401$10,660,000
Less variable expenses:
Manufacturing $ 3,600,000 $330,000 $2.202$ 3,930,000
Selling & administrative 800,000 37,500 .253 837,500
Total variable expenses $ 4,400,000 $367,500 $2 .45 $ 4,767,500
Contribution margin $ 5,600,000 $292,500 $1 .95 $ 5,892,500
Less fixed expenses:
Manufacturing $ 2,900,000 0 0.00 $ 2,900,000
Selling & administrative 2,000,000 0 0.00 2,000,000
Total fixed expenses $ 4,900,000 0 0 .00 $ 4,900,000
Operating income $ 700,000 $292,500 $1 .95 $ 992,500
1$660,000 ÷ 150,000 = $4.40
2Regular unit cost = $3,600,000 ÷ 2,000,000 = $1.80
Logo .40
Variable manufacturing costs $2 .20
3Regular unit cost = $800,000 ÷ 2,000,000 = $ .40
Less sales commissions not paid (3% of $5) ( .15)
Regular unit cost, excluding sales commission $ .25
250

2. Operating income from selling 7.5% more units would
increase by $292,500 ÷ $700,000 = 41.8%. Note also that the
average selling price on regular business was $5.00. The full
cost, including selling and administrative expenses, was $4.65.
The $4.65, plus the 40¢ per logo, less savings in commissions
of 15¢ came to $4.90. The president apparently wanted $4.90
+ .08($4.90) = $4.90 + .392 = $5.292 per pen.
Most students will probably criticize the president for being
too stubborn. The cost to the company was the forgoing of
$292,500 of income in order to protect the company’s image
and general market position. Whether $292,500 was a wise
investment in the future is a judgment that managers are paid
for rendering.
5-A3 (15-20 min.)
The purpose of this problem is to underscore the idea that any
of a number of general formulas might be used that, properly
employed, would achieve the same target selling prices. Desired
sales = $7,500,000 + $1,500,000 = $9,000,000.
The target markup percentage would be:
1. 100% of direct materials and direct labor costs of $4,500,000.
Computation is:
$4,500,000
$4,500,000 – $9,000,000
= 100%
2. 50% of the full cost of jobs of $6,000,000.
Computation is:
$6,000,000
$6,000,000 – $9,000,000
= 50%
251

3.
$5,100,000
$600,000) + $1,000,000 + 0($3,500,00 – $9,000,000
= 76.47%
4.
$7,500,000
$7,500,000 – $9,000,000
= 20%
5.
$5,700,000
$600,000) + $600,000 + $1,000,000 + 0($3,500,00 – $9,000,000
=
$5,700,000
$3,300,000
= 57.9%
If the contractor is unable to maintain these profit percentages
consistently, the desired operating income of $1,500,000 cannot be
obtained.
252

5-A4 (15-20 minutes)
1. Revenue ($360 x 70,000) $25,200,000
Total cost over product life 16,600,000
Estimated contribution to profit $ 8,600,000
Desired (target) contribution to profit
40% x $25,200,000 $10,080,000
Deficiency in profit $ 1,480,000
The product should not be released to production.
2. Previous total estimated cost $16,600,000
Cost savings from suppliers
.20 x .70 x $8,000,000 1,120,000
Revised total estimated cost $15,480,000
Revised total contribution to profit:
$25,200,000 – $15,480,000 $ 9,720,000
Desired (target) contribution to profit $10,080,000
Deficiency in profit $ 360,000
The product should not be released to production.
3. Previous revised total estimated cost from
requirement 2. $15,480,000
Process improvement savings:
.25 x .30 x $8,000,000 $600,000
Less cost of new technology 220,000 380,000
Revised total estimated cost 15,100,000
Revised total contribution to profit:
$25,200,000 – $15,100,000 $10,100,000
Desired (target) contribution to profit $10,080,000
Excess contribution to profit $ 20,000
The product should be released to production.
253

5 -B1 (40-50 min.)
1. KINGLAND MANUFACTURING
Contribution Income Statement
For the Year Ended December 31, 2006
(In thousands of dollars)
Sales $12,000
Less variable expenses:
Direct material $4,000
Direct labor 2,000
Variable indirect manufacturing
costs (Schedule 1) 960
Total variable manufacturing cost of goods sold $6,960
Variable selling expenses:
Sales commissions $500
Shipping expenses 300 800
Variable clerical salaries 400
Total variable expenses 8,160
Contribution margin $ 3,840
Less fixed expenses:
Manufacturing (Schedule 2) $ 582
Selling (advertising) 400
Administrative-executive salaries 100
Total fixed expenses 1,082
Operating income $ 2,758
254

KINGLAND MANUFACTURING
Absorption Income Statement
For the Year Ended December 31, 2006
(In thousands of dollars)
Sales $12,000
Less manufacturing cost of goods sold:
Direct material $4,000
Direct labor 2,000
Indirect manufacturing costs
(Schedules 1 and 2) 1,542
7,542
Gross profit $ 4,458
Selling expenses:
Sales commissions $500
Advertising 400
Shipping expenses 300 $1,200
Administrative expenses:
Executive salaries $100
Clerical salaries 400 500 1,700
Operating income $ 2,758
255

KINGLAND MANUFACTURING
Schedules 1 and 2
Indirect Manufacturing Costs
For the Year Ended December 31, 2006
(In thousands of dollars)
Schedule 1: Variable Costs
Cutting bits $ 60
Abrasives for machining 100
Indirect labor 800 $ 960
Schedule 2: Fixed Costs
Factory supervisors’ salaries $100
Factory methods research 40
Long-term rent, factory 100
Fire insurance on equipment 2
Property taxes on equipment 10
Depreciation on equipment 300
Factory superintendent’s salary 30 582
Total indirect manufacturing costs $1,542
2. Operating income would decrease from $2,758,000 to
$2,438,000, computed as follows:
Decrease in revenue $1,000,000
Decrease in total contribution margin:
Contribution margin ratio in contribution income
statement is $3,840 ÷ $12,000 = .32.
Ratio times revenue is .32 x $1,000,000 $ 320,000
Decrease in fixed expenses 0
Operating income before increase $2,758,000
New operating income $2,438,000
The above analysis is readily calculated by using data from the
contribution income statement. In contrast, the data in the
absorption income statement must be analyzed and divided into
variable and fixed categories before the effect on operating income
can be estimated.
5-B2 (30-40 min.)
256
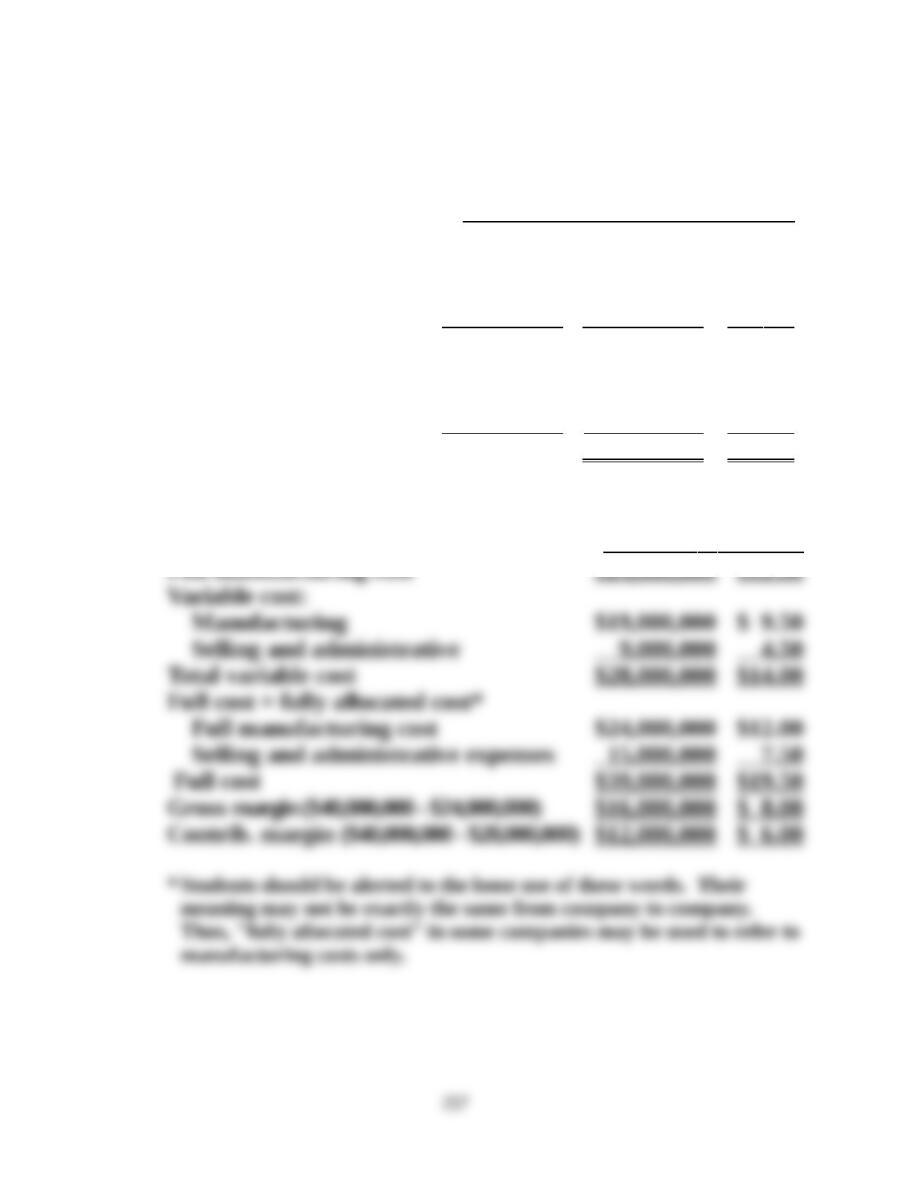
1. DANUBE COMPANY
Income Statement
For the Year Ended December 31, 20X6
Total Per Unit
Sales $40,000,000 $20.00
Less variable expenses:
Manufacturing $19,000,000
Selling & administrative 9,000,000 28,000,000 14 .00
Contribution margin $12,000,000 $ 6.00
Less fixed expenses:
Manufacturing $ 5,000,000
Selling & administrative 6,000,000 11,000,000 5 .50
Operating income $ 1,000,000 $ 0 .50
2. Additional details are either in the statement of the problem
or in the solution to requirement 1:
Total Per Unit