Chapter 3:
how everyone can benefit when people trade with one another.
the meaning of absolute advantage and comparative advantage.
how comparative advantage explains the gains from trade.
how to apply the theory of comparative advantage to everyday life and national policy.
Table 3-2
Assume that England and Holland can switch between producing milk and oats at a constant rate.
Number of Units
Produced in an
Hour
Milk Oats
England 10 4
Holland 8 6
1. Refer to Table 3-2. We could use the information in the table to draw a production possibilities frontier
for
England and a second production possibilities frontier for Holland. If we were to do this, measuring
milk along the
horizontal axis, then
a. the slope of England’s production possibilities frontier would be 10/4 and the slope of
Holland’s production possibilities frontier would be -4/3.
b. the slope of England’s production possibilities frontier would be 4/10 and the slope of
Holland’s production possibilities frontier would be -3/4.
c. the slope of England’s production possibilities frontier would be 10/4 and the slope of
Holland’s production possibilities frontier would be 4/3.
d. the slope of England’s production possibilities frontier would be 4/10 and the slope of
Holland’s production possibilities frontier would be 3/4.
Production Opportunities
Table 3-2
Hours Needed to
Make 1 Unit of Number of Units
Produced in 40 Hours
Cheese Wine Cheese Wine
England 1 4 40 10
France 5 2 8 20
2. Refer to Table 3-3. Assume that England and France each has 40 labor hours available. If each country
divides
its time equally between the production of cheese and wine, then total production is
a. 8 units of cheese and 10 units of wine
b. 24 units of cheese and 15 units of wine
c. 40 units of cheese and 20 units of wine
d. 48 units of cheese and 30 units of wine
3. Refer to Table 3-3. Which of the following combinations of cheese and wine could France produce in
40 hours?
a. 2 units of cheese and 20 units of wine
b. 4 units of cheese and 15 units of wine
c. 6 units of cheese and 5 units of wine
d. 8 units of cheese and 20 units of wine
4. Refer to Table 3-3. Which of the following combinations of cheese and wine could England not
produce in 40
hours?
a. 12 units of cheese and 7 units of wine
b. 16 units of cheese and 6 units of wine
c. 20 units of cheese and 5 units of wine
d. 26 units of cheese and 4 units of wine
5. Refer to Table 3-3. We could use the information in the table to draw a production possibilities frontier
for
England and a second production possibilities frontier for France. If we were to do this, measuring
cheese along the
horizontal axis, then
a. the slope of England’s production possibilities frontier would be 4 and the slope of
France’s production possibilities frontier would be -0.4.
b. the slope of England’s production possibilities frontier would be 0.25 and the slope of
France’s production possibilities frontier would be -2.5.
c. the slope of England’s production possibilities frontier would be 0.25 and the slope of
France’s production possibilities frontier would be 2.5.
d. the slope of England’s production possibilities frontier would be 4 and the slope of
France’s production possibilities frontier would be 0.4.
6. Refer to Table 3-3. We could use the information in the table to draw a production possibilities frontier
for
England and a second production possibilities frontier for France. If we were to do this, measuring
wine along the
horizontal axis, then
a. the slope of England’s production possibilities frontier would be 4 and the slope of
France’s production possibilities frontier would be -0.4.
b. the slope of England’s production possibilities frontier would be 0.25 and the slope of
France’s production possibilities frontier would be -2.5.
c. the slope of England’s production possibilities frontier would be 0.25 and the slope of
France’s production possibilities frontier would be 2.5.
d. the slope of England’s production possibilities frontier would be 4 and the slope of
France’s production possibilities frontier would be 0.4.
Figure 3-2: Brazil’s Production Possibilities Frontier
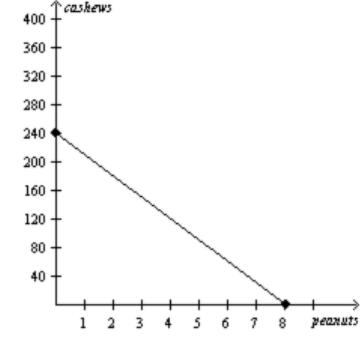
7. Refer to Figure 3-2. The fact that the line slopes downward reflects the fact that
a. for Brazil, it is more costly to produce peanuts than it is to produce cashews.
b. Brazil will produce more peanuts and fewer cashews as time goes by.
c. Brazil faces a tradeoff between producing peanuts and producing cashews.
d. Brazil should specialize in producing cashews.
8. Refer to Figure 3-2. If the production possibilities frontier shown is for 24 hours of production, then
how long
does it take Brazil to make one peanut?
a. 1/10 hour
b. 1/3 hour
c. 3 hours
d. 10 hours
9. Refer to Figure 3-2. If the production possibilities frontier shown is for 24 hours of production, then
how long
does it take Brazil to make one cashew?
a. 1/10 hour
b. 1/3 hour
c. 3 hours
d. 10 hours
10. Refer to Figure 3-2. If the production possibilities frontier shown is for two months of production,
then which of
the following combinations of peanuts and cashews could Brazil produce in two months?
a. 7 peanuts and 35 cashews
b. 5 peanuts and 100 cashews
c. 2 peanuts and 190 cashews
d. 3 peanuts and 150 cashews
11. Refer to Figure 3-2. If the production possibilities frontier shown is for two months of production,
then which of
the following combinations of peanuts and cashews could Brazil not produce in two
months?
a. 5 peanuts and 88 cashews
b. 4 peanuts and 115 cashews
c. 3 peanuts and 155 cashews
d. 1 peanuts and 200 cashews
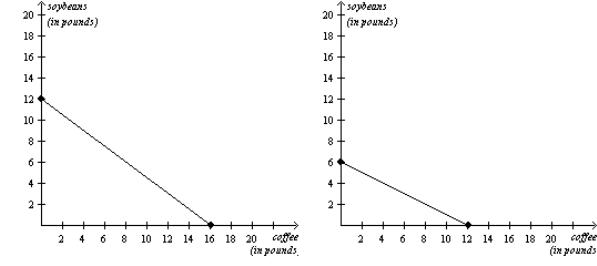
Figure 3-8
Chile’s Production Possibilities Frontier Colombia’s Production Possibilities Frontier
12. Refer to Figure 3-8. If Chile and Colombia each divides its time equally between making coffee
and making
soybeans, then total production is
a. 12 pounds of coffee and 12 pounds of soybeans.
b. 14 pounds of coffee and 9 pounds of soybeans.
c. 16 pounds of coffee and 6 pounds of soybeans.
d. 28 pounds of coffee and 18 pounds of soybeans.
13. Refer to Figure 3-8. If the production possibilities frontiers shown are each for one day of
production, then which
of the following combinations of coffee and soybeans could Chile and Colombia
together make in a given day?(one country make coffee, one country make soybeans)
a. 4 pounds of coffee and 16 pounds of soybeans
b. 8 pounds of coffee and 15 pounds of soybeans
c. 16 pounds of coffee and 10 pounds of soybeans
d. 24 pounds of coffee and 4 pounds of soybeans
14. Refer to Figure 3-8. If the production possibilities frontiers shown are each for one day of
production, then which
of the following combinations of pounds of coffee and pounds of soybeans could
Chile and Colombia together not
make in a given day?
a. 4 pounds of coffee and 17 pounds of soybeans
b. 8 pounds of coffee and 14 pounds of soybeans
c. 16 pounds of coffee and 9 pounds of soybeans
d. 24 pounds of coffee and 3 pounds of soybeans
15. Assume for the United States that the opportunity cost of each airplane is 50 cars. Which of these
pairs of points
could be on the United States’ production possibilities frontier? ( the slope is 1/50, it is
constant, a straight line)
a. (200 airplanes, 5,000 cars) and (150 airplanes, 4,000 cars)
b. (200 airplanes, 12,500 cars) and (150 airplanes, 15,000 cars)
c. (300 airplanes, 15,000 cars) and (200 airplanes, 25,000 cars)
d. (300 airplanes, 25,000 cars) and (200 airplanes, 40,000 cars)
16. Suppose that a worker in Cornland can grow either 40 bushels of corn or 10 bushels of oats per
year, and a worker
in Oatland can grow either 20 bushels of corn or 5 bushels of oats per year. There are
20 workers in Cornland and
20 workers in Oatland. Which of the following statements is true?
a. Both countries could gain from trade with each other.
b. Neither country could gain from trade with each other because Cornland has an absolute
advantage in both
goods.
c. Neither country could gain from trade with each other because neither one has a
comparative advantage.
d. Oatland could gain from trade between the two countries, but Cornland definitively
would lose.
17. Suppose that a worker in Freedonia can produce either 6 units of corn or 2 units of wheat per year,
and a worker in
Sylvania can produce either 2 units of corn or 6 units of wheat per year. Each nation has
10 workers. Without
trade, Freedonia produces and consumes 30 units of corn and 10 units of wheat per
year. Sylvania produces and
consumes 10 units of corn and 30 units of wheat. Suppose that trade is then
initiated between the two countries,
and Freedonia sends 30 units of corn to Sylvania in exchange for
30 units of wheat. Freedonia will now be able to
consume a maximum of
a. 30 units of corn and 30 units of wheat.( trade is oneby one)
b. 40 units of corn and 30 units of wheat.
c. 40 units of corn and 20 units of wheat.
d. 10 units of corn and 40 units of wheat.
Table 3-20
Assume that Brad and Theresa can switch between producing wheat and producing beef at a
constant rate.
Minutes Needed to Make 1
Bushel of Wheat Pound of Beef
Brad 10 12
Theresa 6 10
18. Refer to Table 3-20. What is Brad’s opportunity cost of producing one pound of beef?
a. 5/6 bushel of wheat
b. 6/5 bushels of wheat
c. 3/5 bushels of wheat
d. 5/3 bushels of wheat
19. Refer to Table 3-20. What is Brad’s opportunity cost of producing one bushel of wheat?
a. 5/6 pound of beef
b. 6/5 pounds of beef
c. 3/5 pounds of beef
d. 5/3 pounds of beef
20. Refer to Table 3-20. What is Theresa’s opportunity cost of producing one pound of beef?
a. 5/6 bushel of wheat
b. 6/5 bushel of wheat
c. 3/5 bushel of wheat
d. 5/3 bushels of wheat
21. Refer to Table 3-20. What is Theresa’s opportunity cost of producing one bushel of wheat?
a. 5/6 pound of beef
b. 6/5 pound of beef
c. 3/5 pound of beef
d. 5/3 pounds of beef
22. Refer to Table 3-20. Brad has an absolute advantage in the production of
a. wheat and Theresa has an absolute advantage in the production of beef.
b. beef and Theresa has an absolute advantage in the production of wheat.
c. both goods and Theresa has an absolute advantage in the production of neither good.
d. neither good and Theresa has an absolute advantage in the production of both goods.
23. Refer to Table 3-20. Brad has a comparative advantage in the production of
a. wheat and Theresa has a comparative advantage in the production of beef.
b. beef and Theresa has a comparative advantage in the production of wheat.
c. both goods and Theresa has a comparative advantage in the production of neither good.
d. neither good and Theresa has a comparative advantage in the production of both goods.
24. Refer to Table 3-20. Brad should specialize in the production of
a. wheat and Theresa should specialize in the production of beef.
b. beef and Theresa should specialize in the production of wheat.
c. both goods and Theresa should specialize in the production of neither good.
d. neither good and Theresa should specialize in the production of both goods.
25. Refer to Table 3-20. Assume that Brad and Theresa each has 60 minutes available. If each person
spends all his
or her time producing the good in which he or she has a comparative advantage, then total
production is
a. 6 bushels of wheat and 6 pounds of beef.
b. 10 bushels of wheat and 5 pounds of beef.
c. 10 bushels of wheat and 6 pounds of beef.
d. 6 bushels of wheat and 5 pounds of beef.
26. Refer to Table 3-20. At which of the following prices would both Brad and Theresa gain from
trade with each
other? Brad : B/W = 5/6 mean Brad willing to trade 5 pounds of B for 6 pound of Wheat.
Theresa B/W=3/5 willing to pay 5 w to get 3 beef => the result of trade must be between thí 2 numbers
a. 12 bushels of wheat for 6 pounds of beef
b. 12 bushels of wheat for 8 pounds of beef
c. 12 bushels of wheat for 12 pounds of beef
d. Brad and Theresa could not both gain from trade with each other at any price.
Chapter 4:
what a competitive market is.
what determines the demand for a good in a competitive market.
what determines the supply of a good in a competitive market.
how supply and demand together set the price of a good and the quantity sold.
the key role of prices in allocating scarce resources in market economies.
Table 4-5
The table below shows the quantities demanded of cases of Mt. Dew per month by four families at
various prices.
Price of Case of
Mr. Dew
The Adams
Family
The Jones
Family
The Smith
Family
The Williams
Family
$7 9 15 12 14
$8 8 12 10 10
$9 7 9 8 6
$10 6 6 6 2
1. Refer to Table 4-5. Suppose the four families listed in the table are the only demanders of Mt.
Dew in the
market. If the price of a case of Mt. Dew decreases by $1, the
a. market quantity demanded decreases by 10.
b. market quantity demanded increases by 10.
c. Adams family increases its quantity demanded by more than the Smith family.
d. Jones family increases its quantity demanded by more than the Williams family.
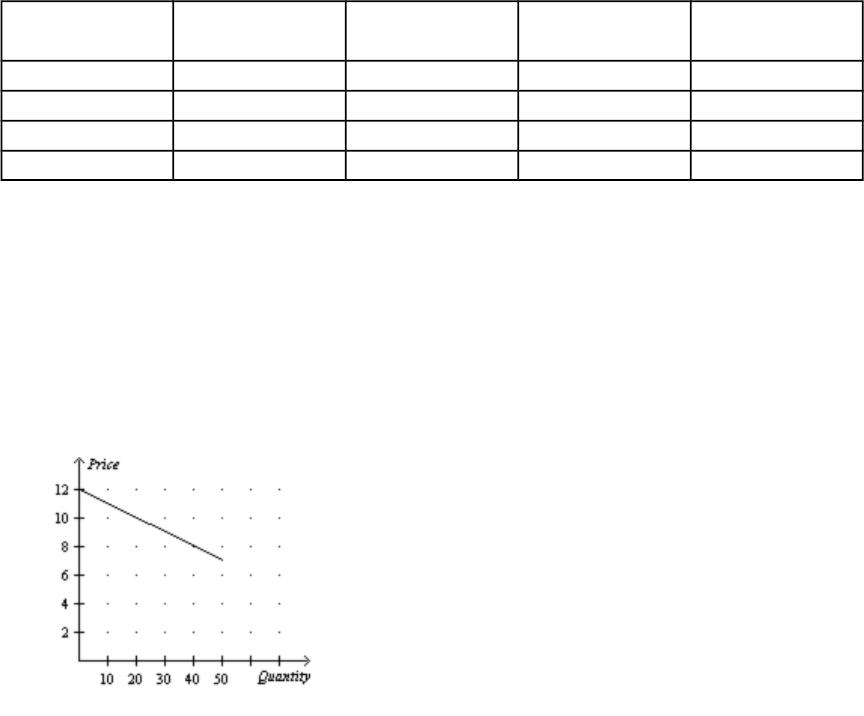
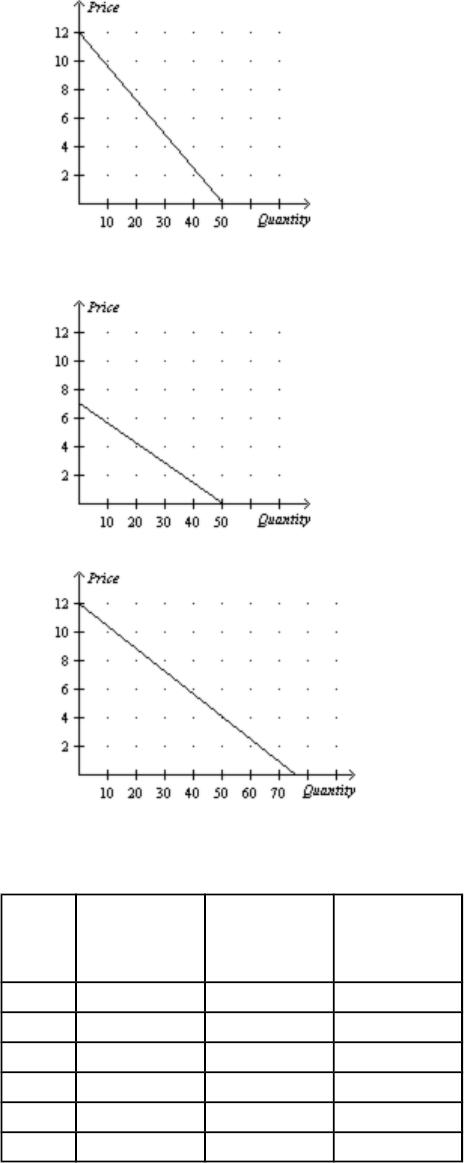
2. Refer to Table 4-5. If the four families listed in the table are the only demanders of Mt. Dew in the
market, which
of the following is a correct graph of the market demand?
a.
b.
c.
d.
Table 4-8
Price
Firm X’s
Quantity
Supplied
Firm Y’s
Quantity
Supplied
Firm Z’s
Quantity
Supplied
$0 0 0 0
$3 2 4 6
$6 4 8 12
$9 6 12 18
$12 8 16 24
$15 10 20 30
3. Refer to Table 4-8. If these are the only three sellers in the market, then the market quantity
supplied at a price of $6 is
a. 6 units.
b. 12 units.
c. 18 units.
d. 24 units.
4. Refer to Table 4-8. If these are the only three sellers in the market, then an increase in the market
price from $6
to $12 will increase quantity supplied by
a. 12 units.
b. 24 units.
c. 36 units.
d. 48 units.
5. Refer to Table 4-8. Suppose Firm X and Firm Y are the only two sellers in the market. If the
market price decreases from $12 to $9, quantity supplied will
a. decrease by 6 units.
b. decrease by 12 units.
c. increase by 6 units.
d. increase by 12 units.
6. Refer to Table 4-8. Suppose Firm X and Firm Y are the only two sellers in the market. If the
market price increases from $12 to $15, quantity supplied will
a. decrease by 6 units.
b. decrease by 12 units.
c. increase by 6 units.
d. increase by 12 units.
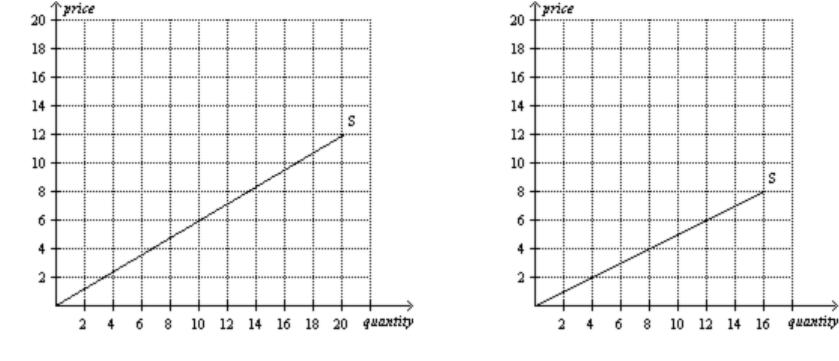
Figure 4-12
Firm A Firm B
7. Refer to Figure 4-12. If these are the only two sellers in the market, then the market quantity
supplied at a price of $4 is
a. 6 units.
b. 7 units.
c. 8 units.
d. 15 units.
8. Refer to Figure 4-12. If these are the only two sellers in the market, then the market quantity
supplied at a price of $6 is
a. 2 units.
b. 10 units.
c. 12 units.
d. 22 units.
9. Refer to Figure 4-12. If these are the only two sellers in the market, then the market quantity
supplied at a price of $8 is
a. 14 units.
b. 15 units.
c. 16 units.
d. 29 units.
10. Suppose an increase in the price of rubber coincides with an advance in the technology of tire
production. As a result of these two events, the demand for tires
a. decreases, and the supply of tires increases.
b. is unaffected, and the supply of tires decreases.
c. is unaffected, and the supply of tires increases.
d. None of the above is necessarily correct.
11. Which of the following might cause the supply curve for an inferior good to shift to the right?
a. an increase in input prices
b. a decrease in consumer income
c. an improvement in production technology that makes production of the good more
profitable
d. a decrease in the number of sellers in the market
12. Equilibrium quantity must decrease when demand
a. increases and supply does not change, when demand does not change and supply decreases, and
when both
demand and supply decrease.
b. increases and supply does not change, when demand does not change and supply increases, and
when both
demand and supply decrease.
c. decreases and supply does not change, when demand does not change and supply increases, and
when both
demand and supply decrease.
d. decreases and supply does not change, when demand does not change and supply decreases, and
when both
demand and supply decrease.
13. Equilibrium price must increase when demand
a. increases and supply does not change, when demand does not change and supply decreases, and
when
demand decreases and supply increases simultaneously.
b. increases and supply does not change, when demand does not change and supply decreases, and
when
demand increases and supply decreases simultaneously.
c. decreases and supply does not change, when demand does not change and supply increases, and
when
demand decreases and supply increases simultaneously.
d. decreases and supply does not change, when demand does not change and supply increases, and
when
demand increases and supply decreases simultaneously.
Figure 4-19
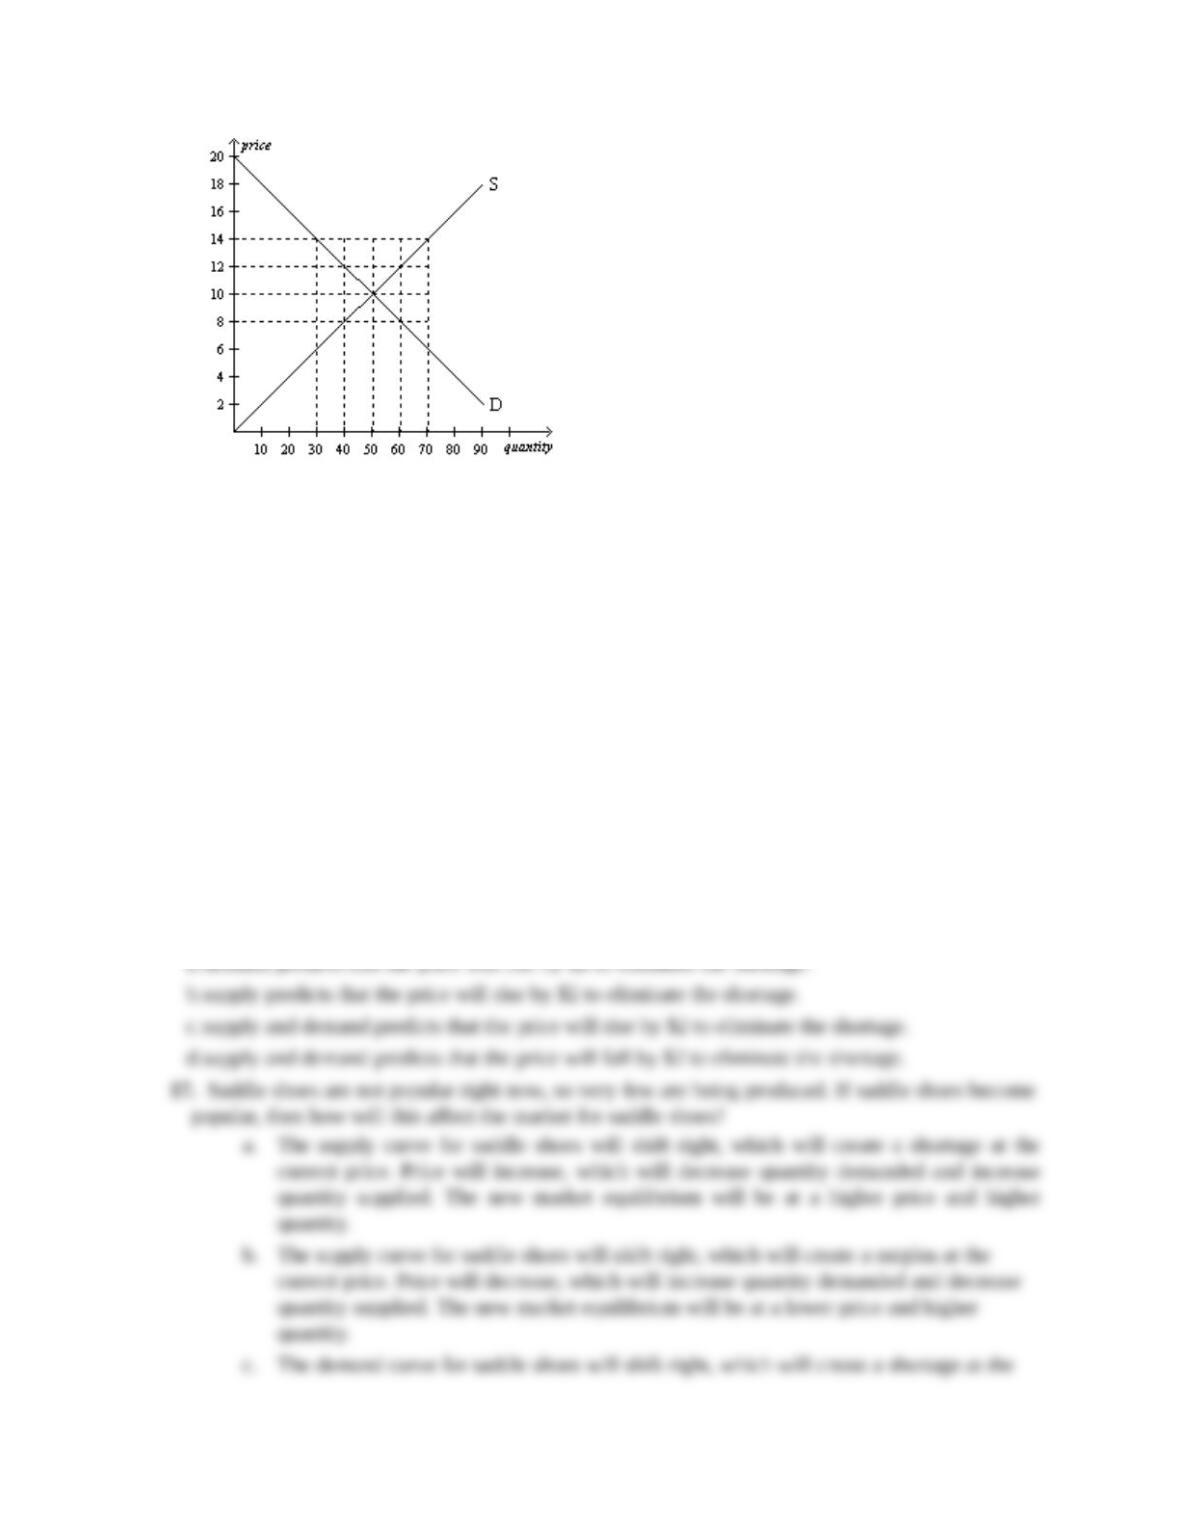
14. Refer to Figure 4-19. In this market, equilibrium price and quantity, respectively, are
a. $10 and 30 units.
b. $10 and 50 units.
c. $10 and 70 units.
d. $4 and 50 units.
15. Refer to Figure 4-19. If price in this market is currently $14, then there would be a(n)
a. surplus of 20 units. The law of supply and demand predicts that the price will rise from $14 to a
higher price.
b. excess supply of 20 units. The law of supply and demand predicts that the price will fall from $14
to a lower
price.
c. surplus of 40 units. The law of supply and demand predicts that the price will rise from $14 to a
higher price.
d. excess supply of 40 units. The law of supply and demand predicts that the price will fall from $14
to a lower
price.
16. Refer to Figure 4-19. If there is currently a shortage of 20 units of the good, then the law of