International Journal of Agricultural Technology 2017 Vol. 13(5): 625-650
Available online http://www.ijat-aatsea.com
ISSN 2630-0192 (Online)
Fresh Goat Meat (Chevon) in the Market: Tracing and
Understanding the Supply Chain in Central Luzon Region,
Philippines
Porciuncula, Fe L.
*
and Padilla, Janet N.
Central Luzon State University, Science City of Munoz, Nueva Ecija, Philippines.
Porciuncula, F. L. and Padilla, J. N. (2017). Fresh goat meat (chevon) in the market: tracing and
understanding the supply chain in Central Luzon region, Philippines. International Journal of
Agricultural Technology 13(5):625-650.
Abstract Examination of chevon supply chain from sourcing of goats for slaughter to the
movement of goat meat to the market as well as value adding is necessary. This research aimed
to assess the supply chain of fresh chevon in Central Luzon, Philippines and identify the
areas for improvement. Nueva Ecija and Tarlac provinces in Central Luzon were selected as
study locations on the basis of chevon being sold on daily basis, volume and goat population.
Based on 2002-2013 data, Tarlac and Nueva Ecija ranked first and second, respectively in
terms of goat population in Central Luzon.A total of 108 respondents composed of keyplayers
in the supply chain were surveyed to gather necessary data coupled with key informants
interview. Supply chain mapping was done and set of indicators were used to determine the
performance of the identified supply chains. A total of five supply chains from Nueva Ecija (3)
and Tarlac (2) were identified and assessed. Supply chain for fresh chevon in the region is
simple and generally participated in by keyplayers which include the goat raiser, barangay
agent or locator, assembler-wholesaler, meat vendor/retailer, institutional buyer and individual
costumer. The supply chain generally follows a traditional supply chain where wet markets
remain as the major destination of fresh chevon and continue to play a significant role as a
primary retailer for the end consumers. The simple supply and demand analysis showed a gap
in the volume requirement of the market which is indicative of unmet demand. The total gap is
1,720 heads (22,995 kg) in a year which is a welcome opportunity to intensify goat production
in the supply chain. While acceptable net income, return on expenses and profit margin were
generated in the supply chain, there are several logistical issues which denotes some degree of
inefficiencies in the supply chain. The identified issues and concerns shall be addressed
holistically taking stock of improving goat production system and the other activities and
processes in the entire supply chain with important focus on sourcing (establishment of
strategically located community-based goat production for slaughter), pricing, product handling
and hygiene.
Keywords: supply chain management, fresh chevon, key players, logistical issues
*
Coressponding author: Porciuncula, Fe L.; Email: flporciuncula@yahoo.com
626
Introduction
Supply chain analysis aims to utilize and capitalize on strengths,
improve weaknesses, search and benefit from opportunities, and mitigate
threats in the supply chains (Brown and Aranas, 2011). This analytical tool is
intended to find ways of integrating and coordinating various players in the
supply chain and meeting the value expectations of the target market. The
management of supply chains also seeks to achieve cost reduction and
improved customer service by achieving greater efficiency, enhanced
flexibility, and service enhancement (Van de Vorst, 2000 and Boyle, 1998 as
cited by Brown and Aranas, 2011).
In 2010, goat production grew by 1.38% (BAS 2010) which was mainly
driven by the sustained demand for chevon. Since goat production requires
small capital investment, it has become a more lucrative enterprise over the
other livestock enterprises and therefore an increase in the stocks for slaughter
was noted. Moreoever, chevon is continuously gaining popularity because of
the lower total fat, saturated fat, calories and cholesterol than the traditional
meats such as pork, beef and chicken. Based on USDA Nutrient Database for
Standard Reference Release 14 (July 2001) on per 3 oz. cooked chevon, it has
lower calories at 122 cal compared to 162 cal for chicken, 179 cal for beef and
180,cal for pork. In the same manner that chevon has lower fat at 2.6 g
compared to 6.3, 7.9 and 8.2 g fat for chicken, beef and pork, respectively.
Saturated fat of chevon is similarly lower at 0.79 g compared to 1.7 g for
chicken, 3.0 g for beef and 2.9 g for pork. Equally important is the lower
cholesterol of chevon at 63.8 mg compared to 76.0 mg for chicken and 73.1 mg
for both beef and pork. Lesser fat and cholesterol means a healthier red meat
for consumers who are becoming more and more health conscious nowadays.
Anent to the gaining popularity of chevon is the fast thriving goat
industry in Central Luzon. Corresponding to the increasing demand for goat
meat is the need to develop a wide selection of goat products catering to a wide
variety of uses. To date, chevon cutting schemes as well as chevon products
canning processes have been developed to satisfy demand for exquisite local
delicacies. Yet, there is a need for strategic planning and development for
commercialization to assure compliance with strict standards and product
requirements. The examination of chevon supply chain from sourcing of goats
for slaughter to the movement of goat meat to the market as well as value
adding is necessary.
Objectives: The research aimed to provide an overview of the
goat/chevon industry in Central Luzon;to map out the supply chain for fresh
chevon; to analyze the performance of the various supply chains in terms of
International Journal of Agricultural Technology 2017 Vol. 13(5): 625-650
627
efficiency and effectiveness; and to identify areas for improvement of the
supply chain.
Materials and methods
Study Sites and Respondents
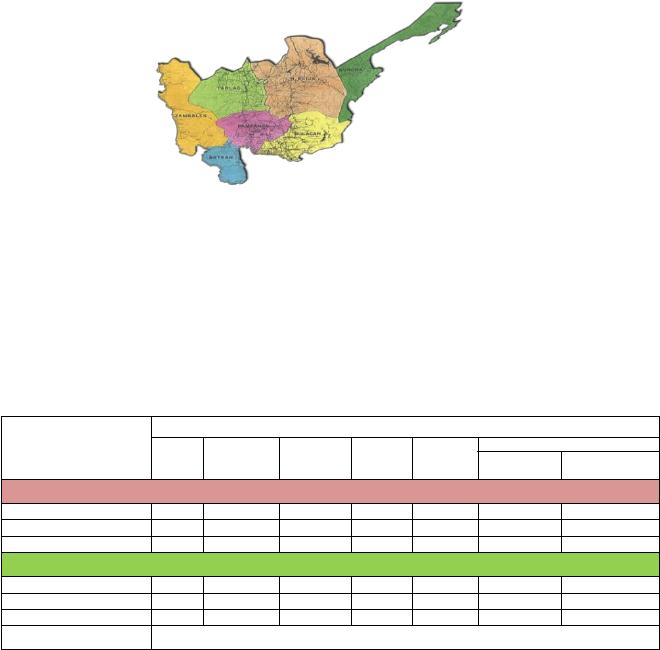
Central Luzon served as the location of the project and is composed of the
provinces of Nueva Ecija, Tarlac, Bulacan, Pampanga, Bataan and Zambales
(Fig. 1). Key informants in the region were contacted to provide useful
information in tracing the supply chain for fresh chevon in Central Luzon. A
reconnaissance survey of the demand centers (major cities) in the six provinces
of Central Luzon was then undertaken. Wet markets, supermarkets and meat
shops were visited to determine and validate the availability of fresh chevon
being offered for sale. Restaurants and eateries/carenderias were also visited to
determine where they procure the chevon they used for their cooked chevon
dishes.
Figure 1. Map of Central Luzon region showing the 6 provinces
Nueva Ecija and Tarlac were selected as the research locations on the
basis of fresh chevon being sold on a daily basis, volume and goat population.
Based on 2004-2013 BAS data, Tarlac and Nueva Ecija ranked first and
second, respectively in terms of goat population.
The following shows the location and key players identified and
interviewed in the supply chain:
AREA/PROVINCE
KEY PLAYERS
Goat
Raiser
Bgry.
Agent/locator
Assembler
wholesaler
Assembler
Retailer
Market
vendor/
Retailer
End Consumers
Individual
Costumers
Restaurants and
carenderias
NUEVA ECIJA
Science City of Munoz
5
2
2
2
13
4
San Jose City
5
1
1
1
1
12
5
Cabanatuan City
3
1
3
8
5
TARLAC
Camiling Tarlac
2
3
10
4
Tarlac City
1
1
8
5
TOTAL
13
4
5
2
10
51
23
Overall Total
108
628
Data Gathering
Actual survey and key informants interview were conducted to validate
secondary data and to answer more specific questions related to supply chain
mapping. Questionnaires were formulated and designed to answer the basic
study questions as follows: 1) who are the key customers and what are their
product requirements (quality standards)?; 2) How do product, information and
money flow through the supply chain?; 3) What are the activities and services
provided at each step in the supply chain?; 4) What are the roles of each key
player involved in the chain?; 5) What are the critical issues related to
logistics?; and 6) and what are some of the external influences affecting the
members of the chain?.
Secondary data taken from the National Goat Farm Performance Project
(Cruz, et al., 2012) were used in the analysis of cost and return in the Tarlac
supply chain. The 2009 data were inflated to current prices using the Consumer
Price Index. The research team was not able to interview goat farmers in Tarlac
as per advise of the traders due to mountainous terrain, long distance and peace
and order situation. Key informants were interviewed to this effect.
Supply Chain Mapping and Examination of Chain Performance,
Effectiveness and Efficiency
A set of indicators were used to evaluate the performance in terms of
effectiveness and efficiency of existing supply chains. The following are the
standard indicators used in supply chain evaluation involving agribusiness
products:
1. Effectiveness: the ability of the chain to meet the requirements of
key customers that include: Quality/Standards; Delivery Volume
(Quantity); Delivery Schedule; Delivery Flexibility (flexibility of
the chain to respond to changes in customer
demands/requirements)
2. Efficiency: Cost (production cost, distribution cost, transaction
cost); Profit and Return on Expenses
International Journal of Agricultural Technology 2017 Vol. 13(5): 625-650
629
Results and Discussion
Goat Industry Situation
Goat inventory in the Philippines shows an increasing trend in 2002–
2009 and slightly decreased in 2010 until 2013 (Table 1). Goat production
remains to be backyard in nature registering a more than 98.0% share to total
inventory in the country. While an increasing trend is noticeable from 2002–
2009, slight decrease ensued in 2010–2013. Commercial production of goat
shows a consistent increasing trend with the highest increase recorded in 2010
till 2012 but decreased in 2013.
The marketing system of goats in the Philippines is as varied as the areas
and location of goat farms (Jamandre, Sansano and Guiamal, 2011). The same
research by Jamandre, et al., indicated that direct buying, wholesaling and
retailing through auction markets and abattoirs and trading through middlemen
are the most common marketing system of goats in the Philippines. Further,
buying and selling prices are largely based on weight and size of goat. The
average yearly farm gate price per kg liveweight of goat increased from 2002–
2011 in the Philippines and in Central Luzon. In 2011, the average price per kg
liveweight was recorded at PhP99.04 and PhP 119.88 in the Philippines and
Central Luzon, respectively, with a little over 1 percent change over time. The
data reveals a rather stable farm gate prices through the years.
Table 1. Philippine goat inventory (head), 2002–2013
Year
Backyard
% To Total
Commercial
% To Total
Total
2002
3,248,184
99.53
15,253
0.47
3,263,437
2003
3,272,877
99.50
16,573
0.50
3,289,450
2004
3,431,245
99.40
20,816
0.60
3,452,061
2005
3,642,216
99.29
26,045
0.71
3,668,261
2006
3,960,430
99.19
32,294
0.81
3,992,724
2007
4,059,989
99.07
37,994
0.93
4,097,983
2008
4,086,816
98.96
42,911
1.04
4,129,727
2009
4,182,503
99.01
41,714
0.99
4,224,217
2010
3,874,478
98.42
62,118
1.58
3,936,596
2011
3,688,643
98.24
65,945
1.76
3,754,588
2012
3,650,411
98.19
67,126
1.81
3,717,537
2013
3,614,770
98.32
61,690
1.68
3,676,460
Source: Bureau of Agricultural Statistics

630
Based on the average of 2004-2013 data, Western Visayas topped the list
of the top producing regions followed by Central Visayas, Ilocos Region,
Davao Region and Central Luzon. Central Luzon showed an average growth
rate of 2.02% in backyard goat production and a slightly high 9.61% in
commercial production with an overall growth rate of 2.40%. Central Luzon
contributes an average of 7.75% in the goat inventory in the Philippines (2004–
2013). The average goat inventory in Central Luzon (Table 2) from 2004-2013
shows Tarlac with the highest percent contribution of 40.45% with Nueva
Ecija in second registering 25.16% ,and Zambales came in third with 13.87%.
Table 2. Average inventory of goats (head) in Central Luzon by province,
2004-2013
Province
Backyard
Commercial
Total
% To Total In Cl
Aurora
15,118
58
15,176
5.07
Bataan
12,220
365
12,585
4.20
Bulacan
18,370
1,051
19,420
6.48
Nueva Ecija
72,283
3,082
75,365
25.16
Pampanga
14,051
208
14,259
4.76
Tarlac
119,444
1,711
121,155
40.45
Zambales
41,272
278
41,550
13.87
Source: Bureau of Agricultural Statistics
The growth of goat production in the Philippines is sustained by the
demand for chevon. Based on chevon supply and utilization data (BAS, 2011),
the supply of chevon consistently increased from 2002-2010 in the same
manner that that the per capita consumption for goat carcass ( from 0.32 in
2002 to 0.44 in 2010) and offals (from 0.10 in 2002 to 0.14 in 2010) also
increased. This figures however, remain far from the per capita consumption of
pork and beef (2009) recorded at 14.87 kg and 4.0 kg, respectively.
International Journal of Agricultural Technology 2017 Vol. 13(5): 625-650
Key Players and Roles in the Fresh Chevon Supply Chain
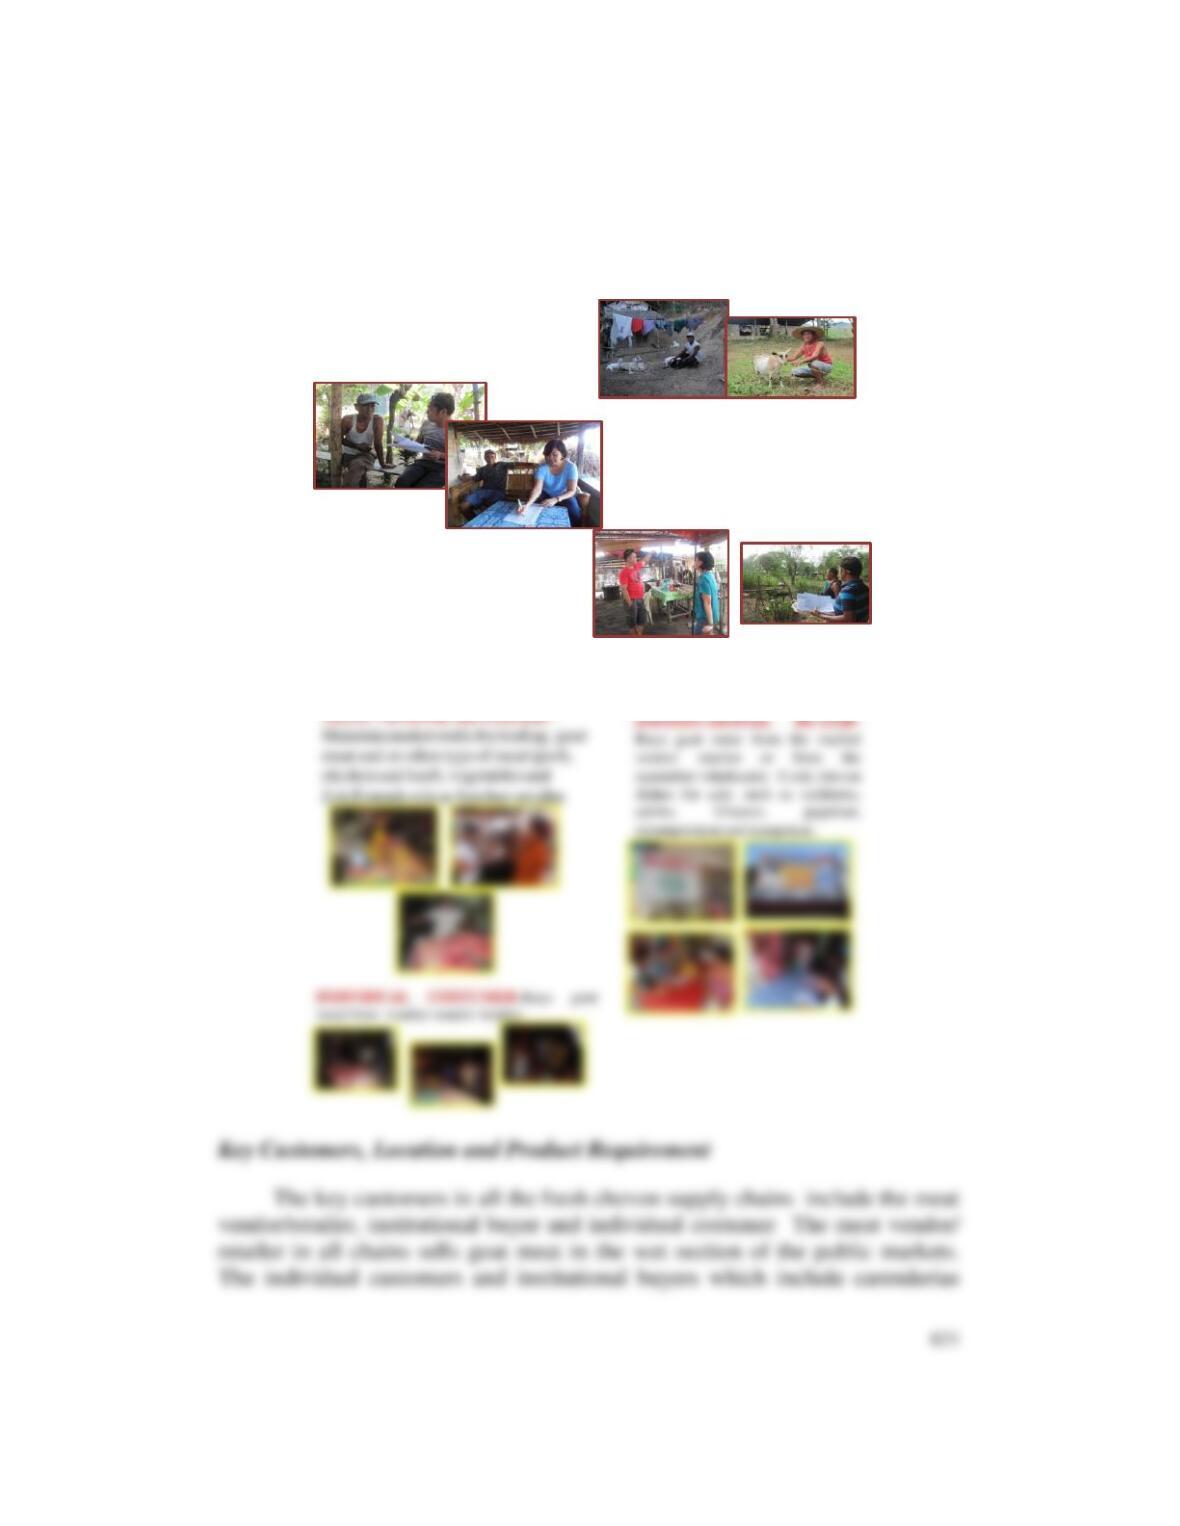
KEY PLAYERS AND THEIR ROLES
GOAT RAISER –provides slaughter
goats for sale to traders or direct
consumers
BARANGAY AGENT OR
LOCATOR- Responsible in
locating slaughter goats. Assists
the assembler wholesaler in
picking up the goat from the
goat raiser’s farm or house
ASSEMBLER WHOLESALER –
Procures/Pick-up goats from the goat
raisers thru the barangay agent.
Sometimes locate goats from other
barangays. Butchers goat and supplies
goat meat to market vendors-retailers.
May extend roles as meat retailers.