Finance 301-01
Income Inequality in America: Cause and Effect
The gap between rich and everyone else has risen substantially over the past thirty years
in the United States of America (U.S.). An overwhelming majority of statistical data all confirm
the reality of this increasing gap (see Stone, for examples). Rising income inequality in the U.S.
is the product of changing landscapes–both economic and political. Changes in the tax law that
reduces the federal tax rate on capital gains income, de-unionization, globalization, and changes
in technology and education have all played roles in widening this gap. Although the reality of
this widening gap is generally, but not unanimously accepted, there are many perspectives over
its implications for the economy. This paper explores methods for obtaining statistical evidence
of the widening gap, statistical data, causes, and varying viewpoints that report on the
implications the increasing gap between highest income earners and the lowest income earners
have on the U.S. economy.
In order to allow statistics to become a viable resource in the validity of the income
inequality debate, examining the process and factors used are imperative. According to
Washington think tank group–Center on Budget and Policy Priorities (CBPP), the most widely
accepted sources used for data and statistics are the United States Census Bureau–Census
Survey and Internal Revenue Service (IRS) income data. The U.S. Census Bureau’s annual
survey of households are conducted as part of the Current Population Survey (CPS). The IRS
gathers large samples of individual income tax returns and uses it to compile the Statistics of
Income data (SOI) in the U.S. (Stone, et al., “A Guide to Statistics on Historical Trends in
Income Inequality“).
The Census Bureau utilizes the CPS to provide information on the total annual resources
available for families: The concept of “income” must be examined to determine its validity to
incorporate into statistical data of income inequality:
Total annual resources available to families include: income from earnings,
dividends, cash benefits (such as Social Security), as well as the value of tax
credits earned such as the Earned Income Tax Credit (EITC), and non-cash
benefits such as nutritional assistance, Medicare, Medicare, public housing, and
employer-provided fringe benefits. The income measure used in the Census report
is money income before taxes, and the unit of analysis is the household. (“About
Income“, United States Census Bureau)
The CPS is prone to one important flaw. Small sample sizing, confidentiality restrictions, and
processing restrictions, all cause CPS to be prone to inaccurate reporting on the highest income
households.
The income tax data from the IRS are more accurate than information from the CPS.
More Americans file income tax returns than U.S. Census Bureau reports. Additionally, the
information reported can be verified by the IRS and allows for more structured distribution
statistics on income inequality (Stone, et al., “A Guide to Statistics on Historical Trends in
Income Inequality“). However, not all American Citizens are required to file tax returns. This is
more common of people with limited income, therefore mirroring the CPS income reporting
flaw, creating less representative views of lower income households (“About Income“, United
States Census Bureau).
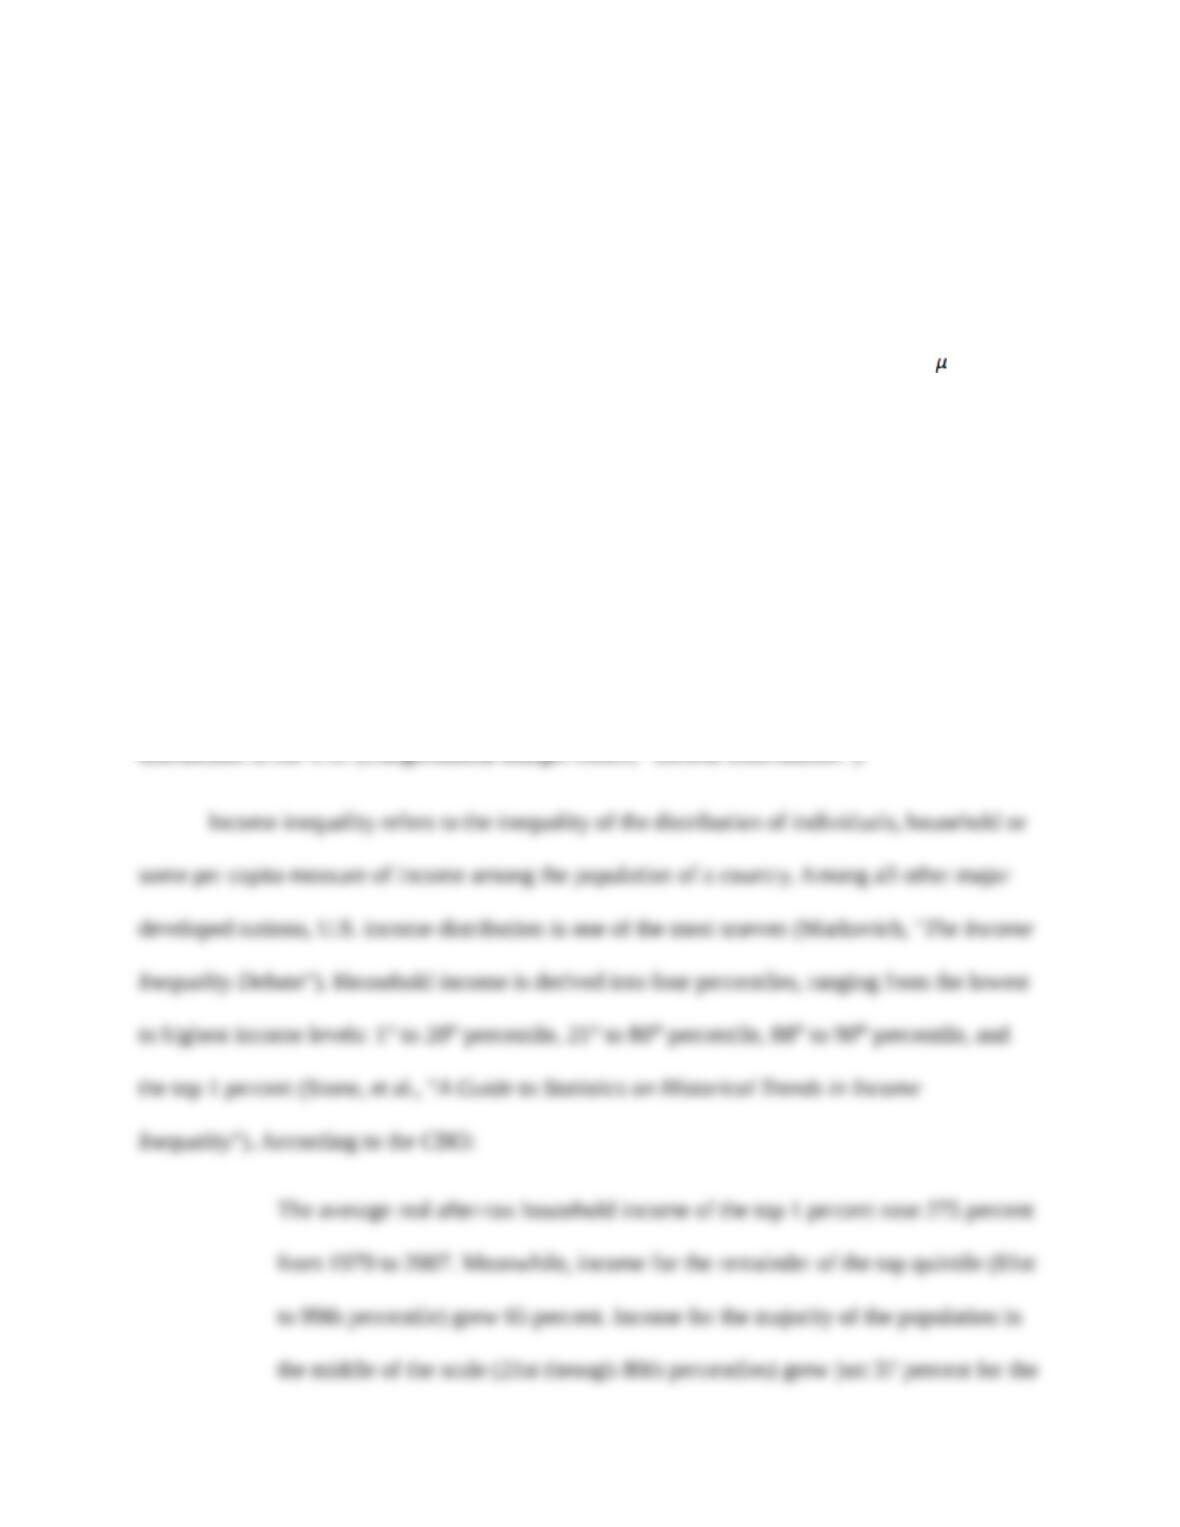
The most widely used index of inequality is the Gini Coefficient. It is a summary statistic
of the Lorenz Curve, a cumulative distribution function of the empirical probability distribution
of wealth or income. According to the Central Intelligence Agency (CIA), the Gini coefficient is
“most easily calculated from unordered size data as the “relative mean difference,” i.e., the mean
of the difference between every possible pair of individuals, divided by the mean size ”
(“Central Intelligence Agency Fact book”).
The non-partisan analysis group, Congressional Budget Office (CBO)–designed a model
that combines the CPS and SOI. Combining data and using Gini Coefficient measure helps
alleviate the mirrored flaws of both the CPS and SOI data sets. This allows an accurate portrayal
of average household income–both before and after taxes. CBO statistics are widely accredited
by many economists and politicians with providing non-partisan–accurate statistics on income