Eve’s temptation
project 3
MIGB 7723-002, Data-Driven Marketing
Decisions
Team 8
Huiya Wang
Jinwen He
Xintian Hu
Yiyan Chen
12/06/2017
Table of Contents
Key Findings 3
Flowchart 4
Data Analysis 5
Appendix 10
Key Findings
In this project, we found variables that have correlation with profit, and the relation
between independent variables and profit by using regression model. The result can help
managers predict the future profit and increase it by changing certain variables.
We selected two segments of customers with little similarities as our subjects to
conduct the model. The first segment has the largest number of customers while these
customers have not bought our products for a long time. The key findings in segment 1 are:
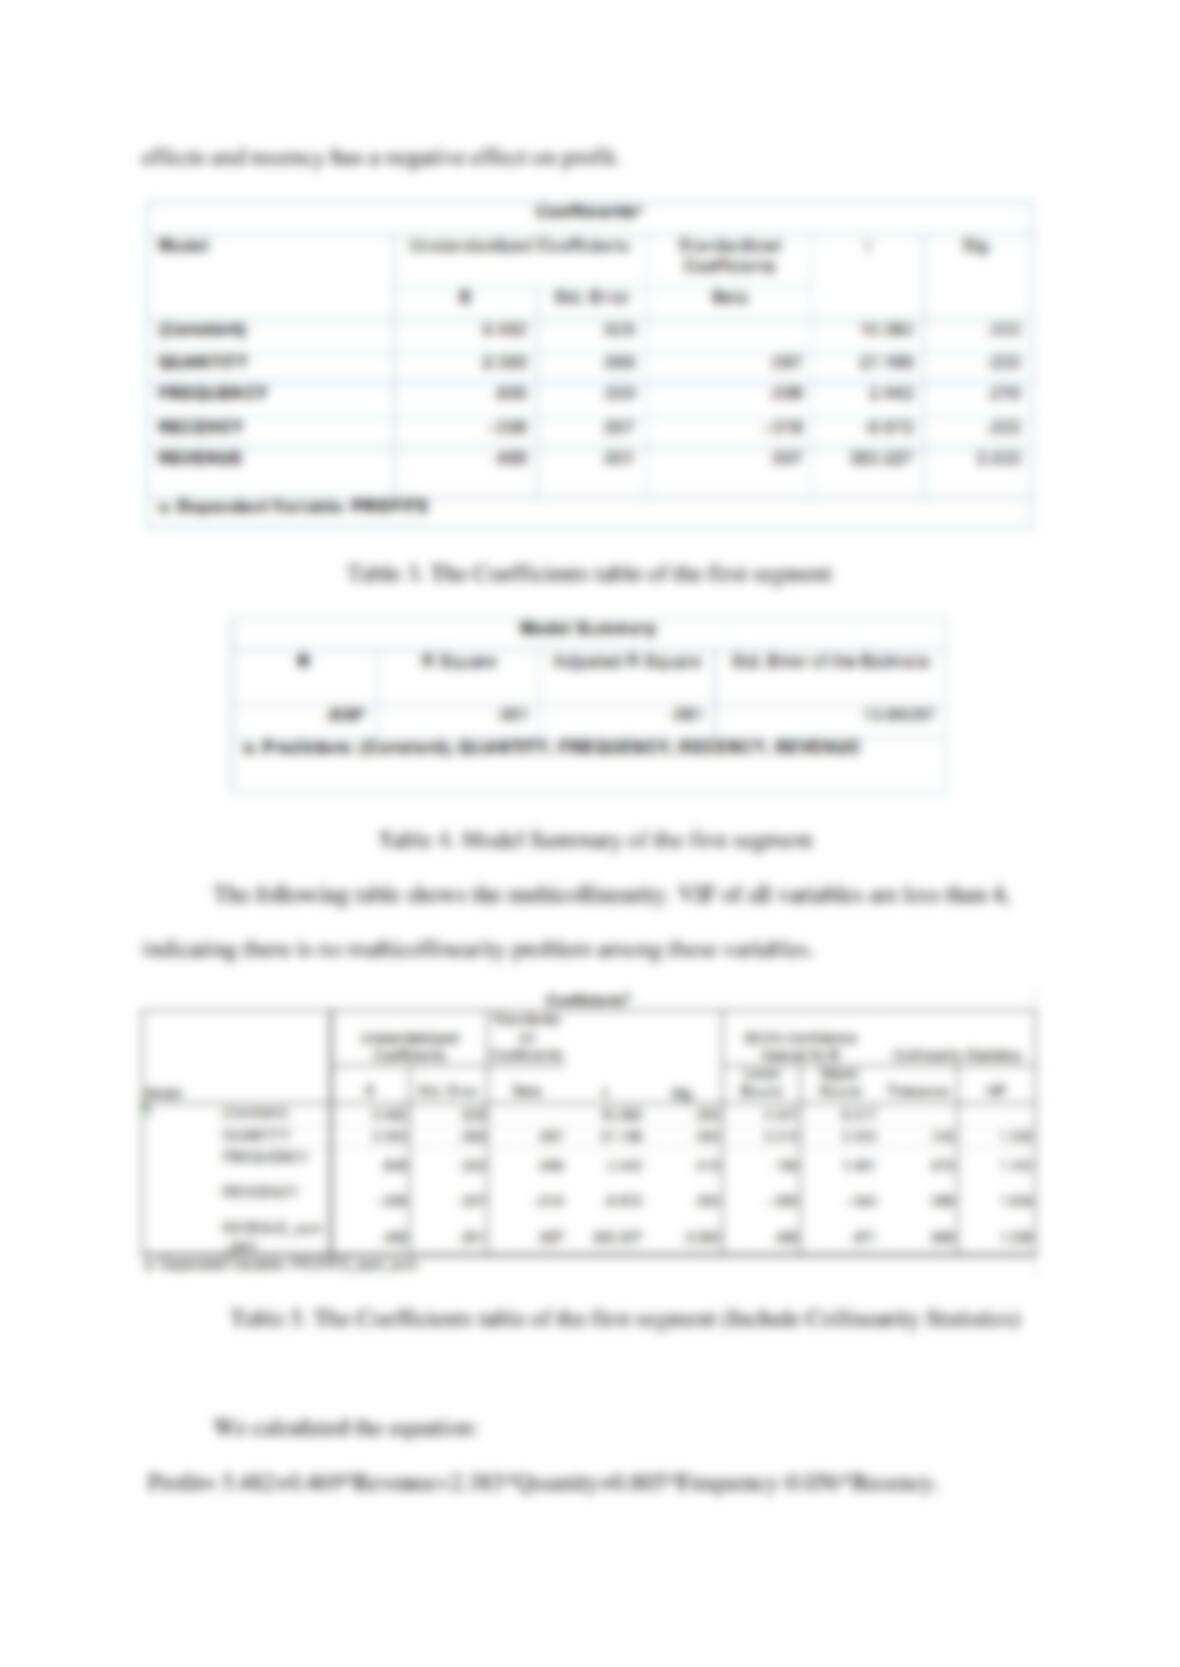
● Profit is related to revenue, quantity, frequency and recency
● Recency has weak negative effect on profit
● Quantity, revenue and frequency have positive effect on profit and quantity has
strongest relationship with it.
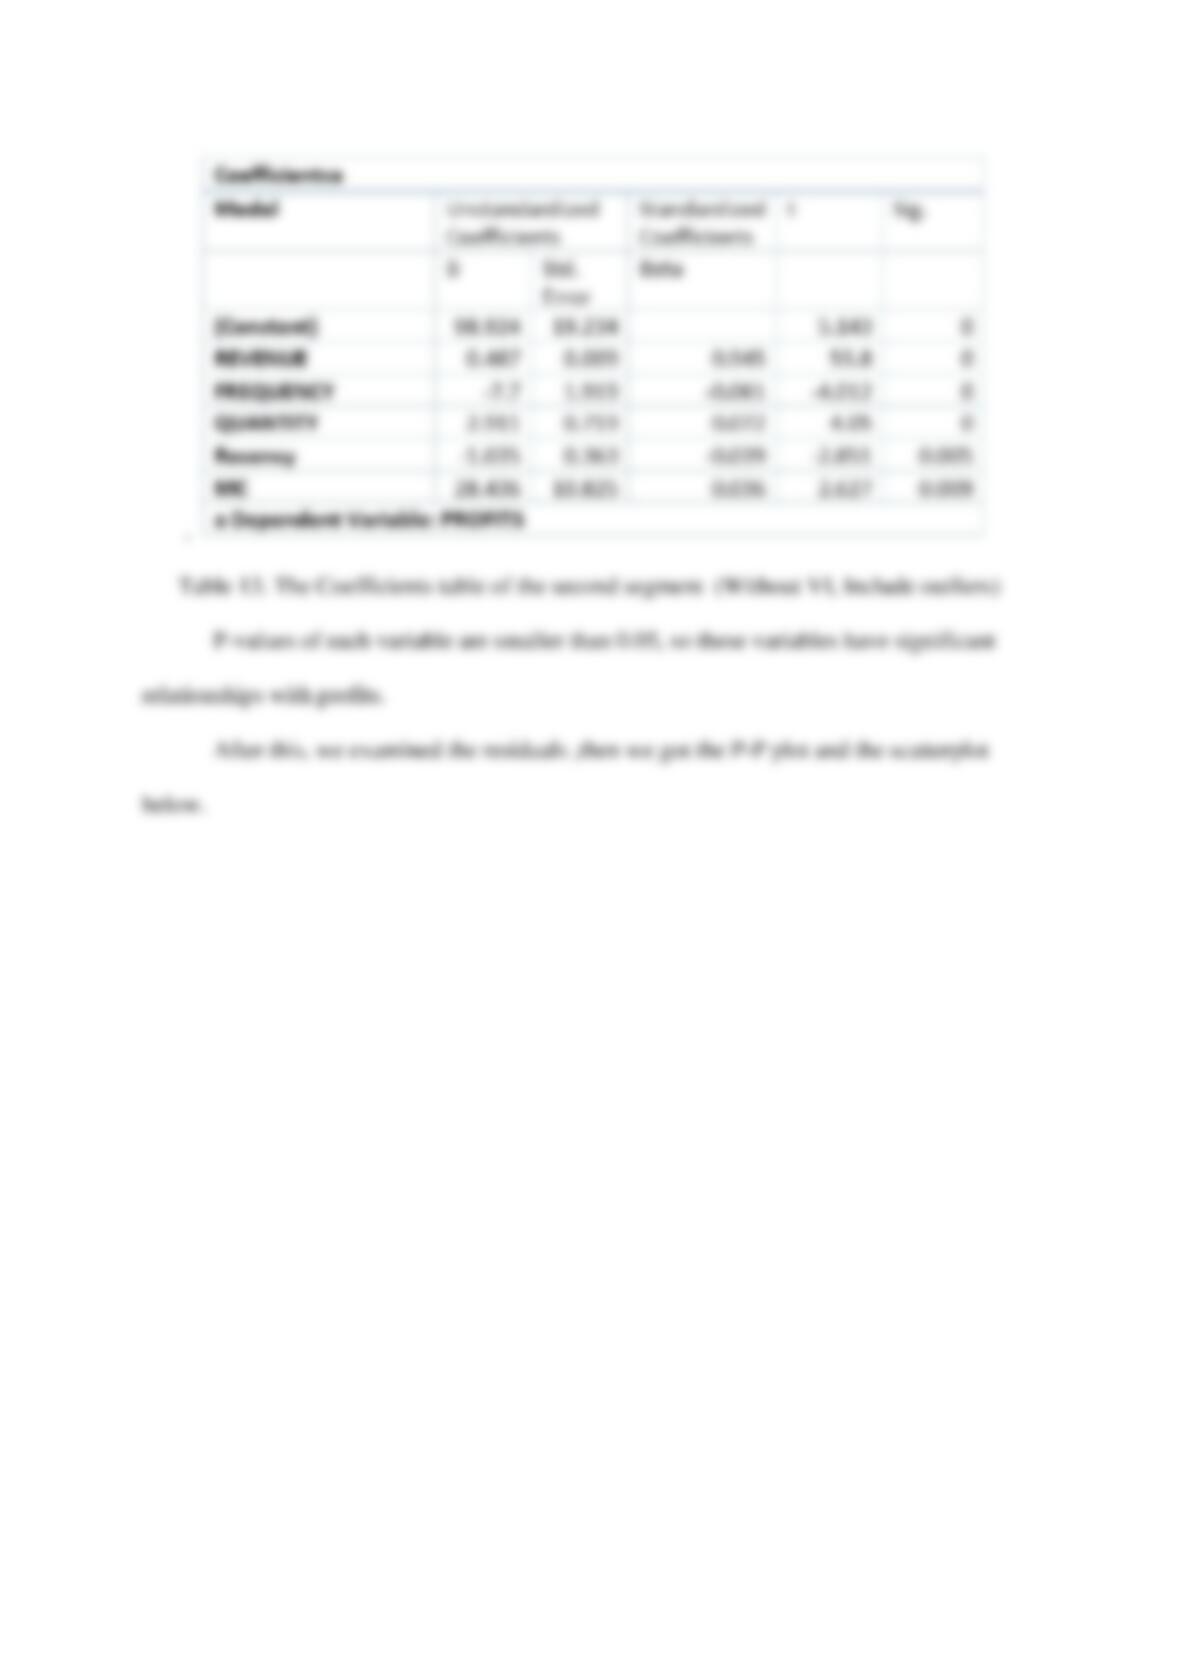
In the second segment, it has high recency for shopping, producing high profit and
revenue, but has a smaller number of customers. The key findings for segment 2 include:
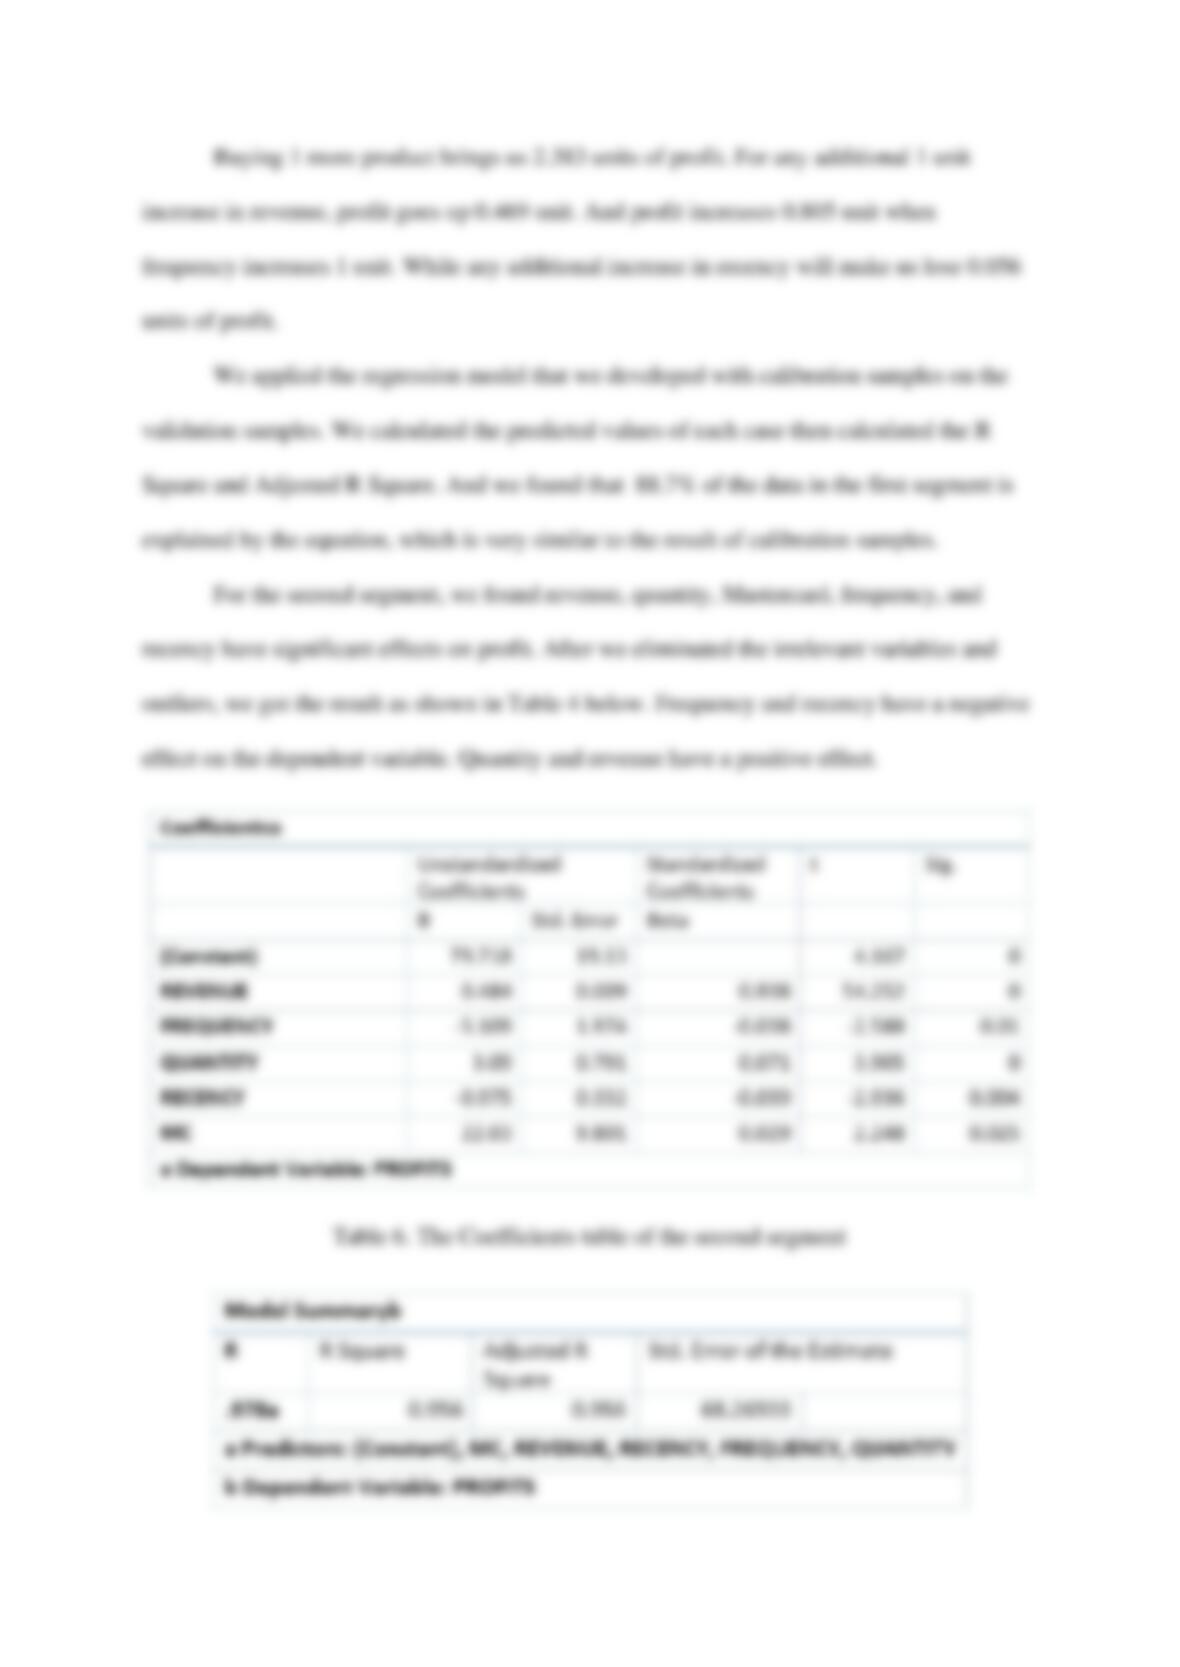
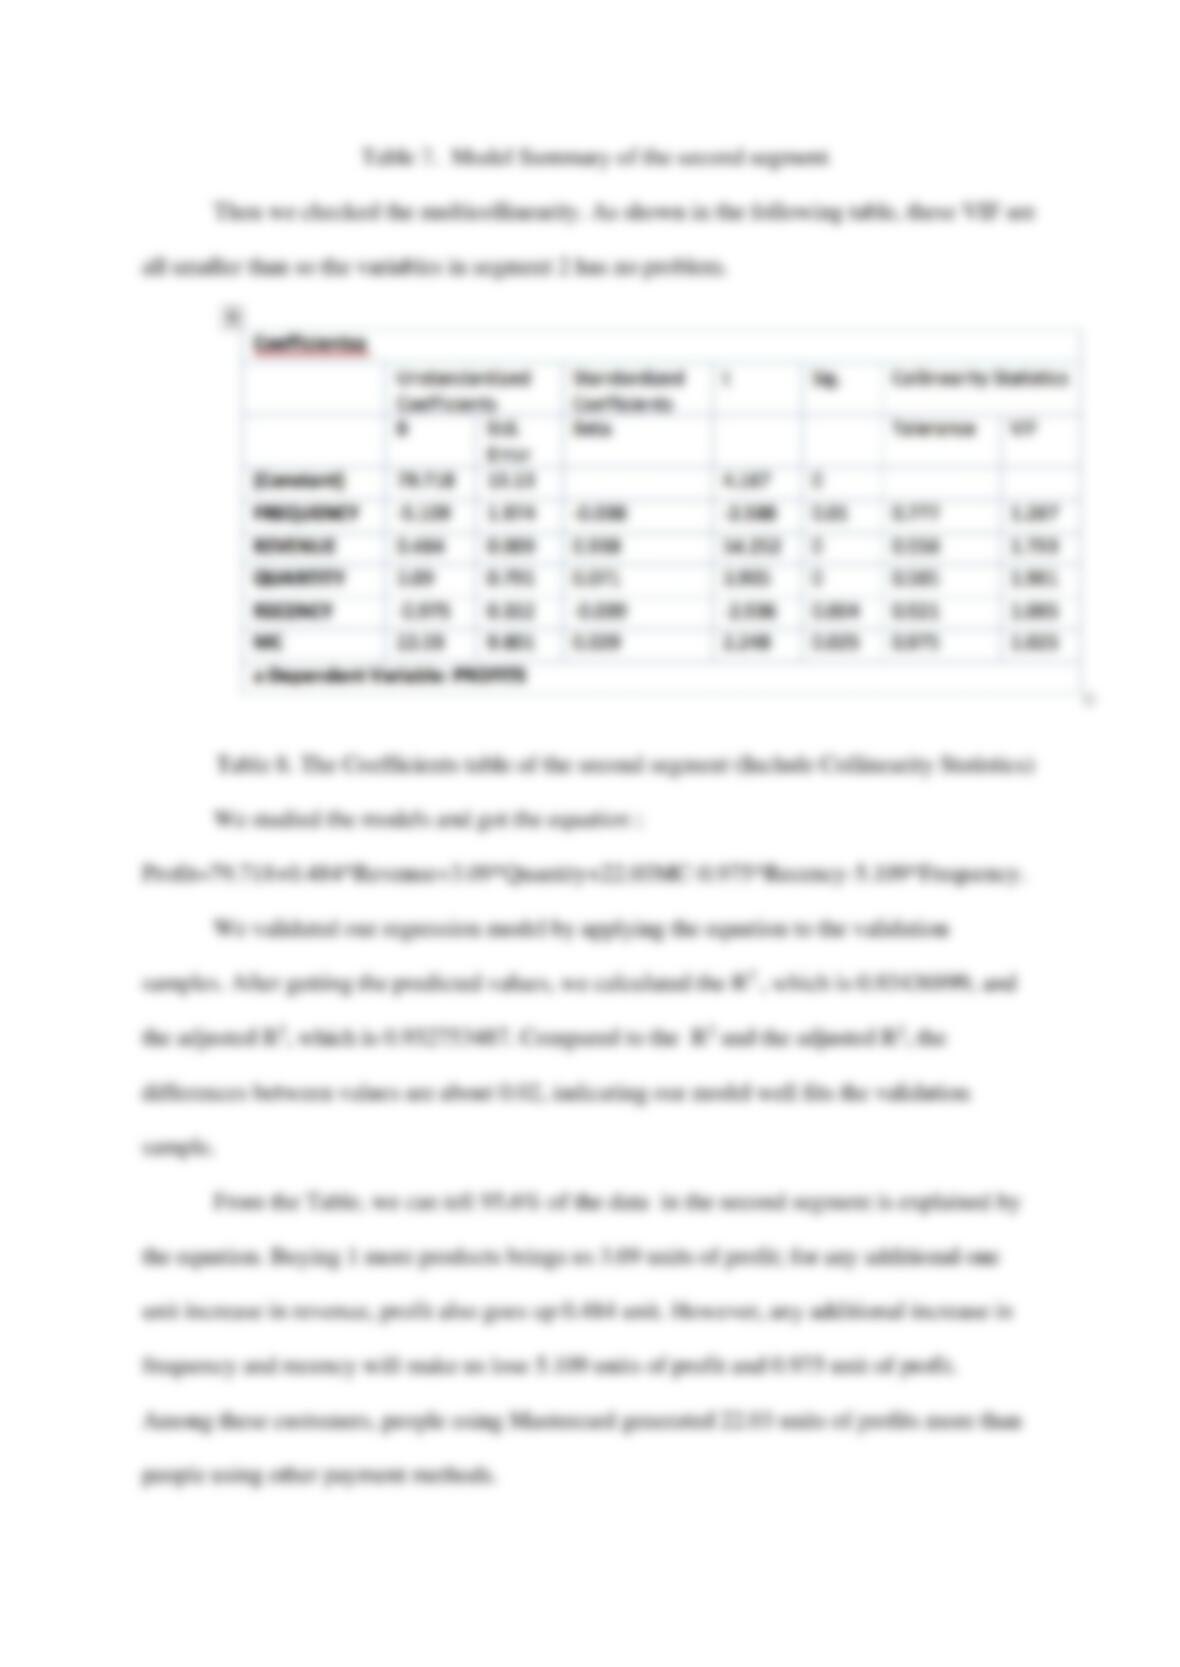
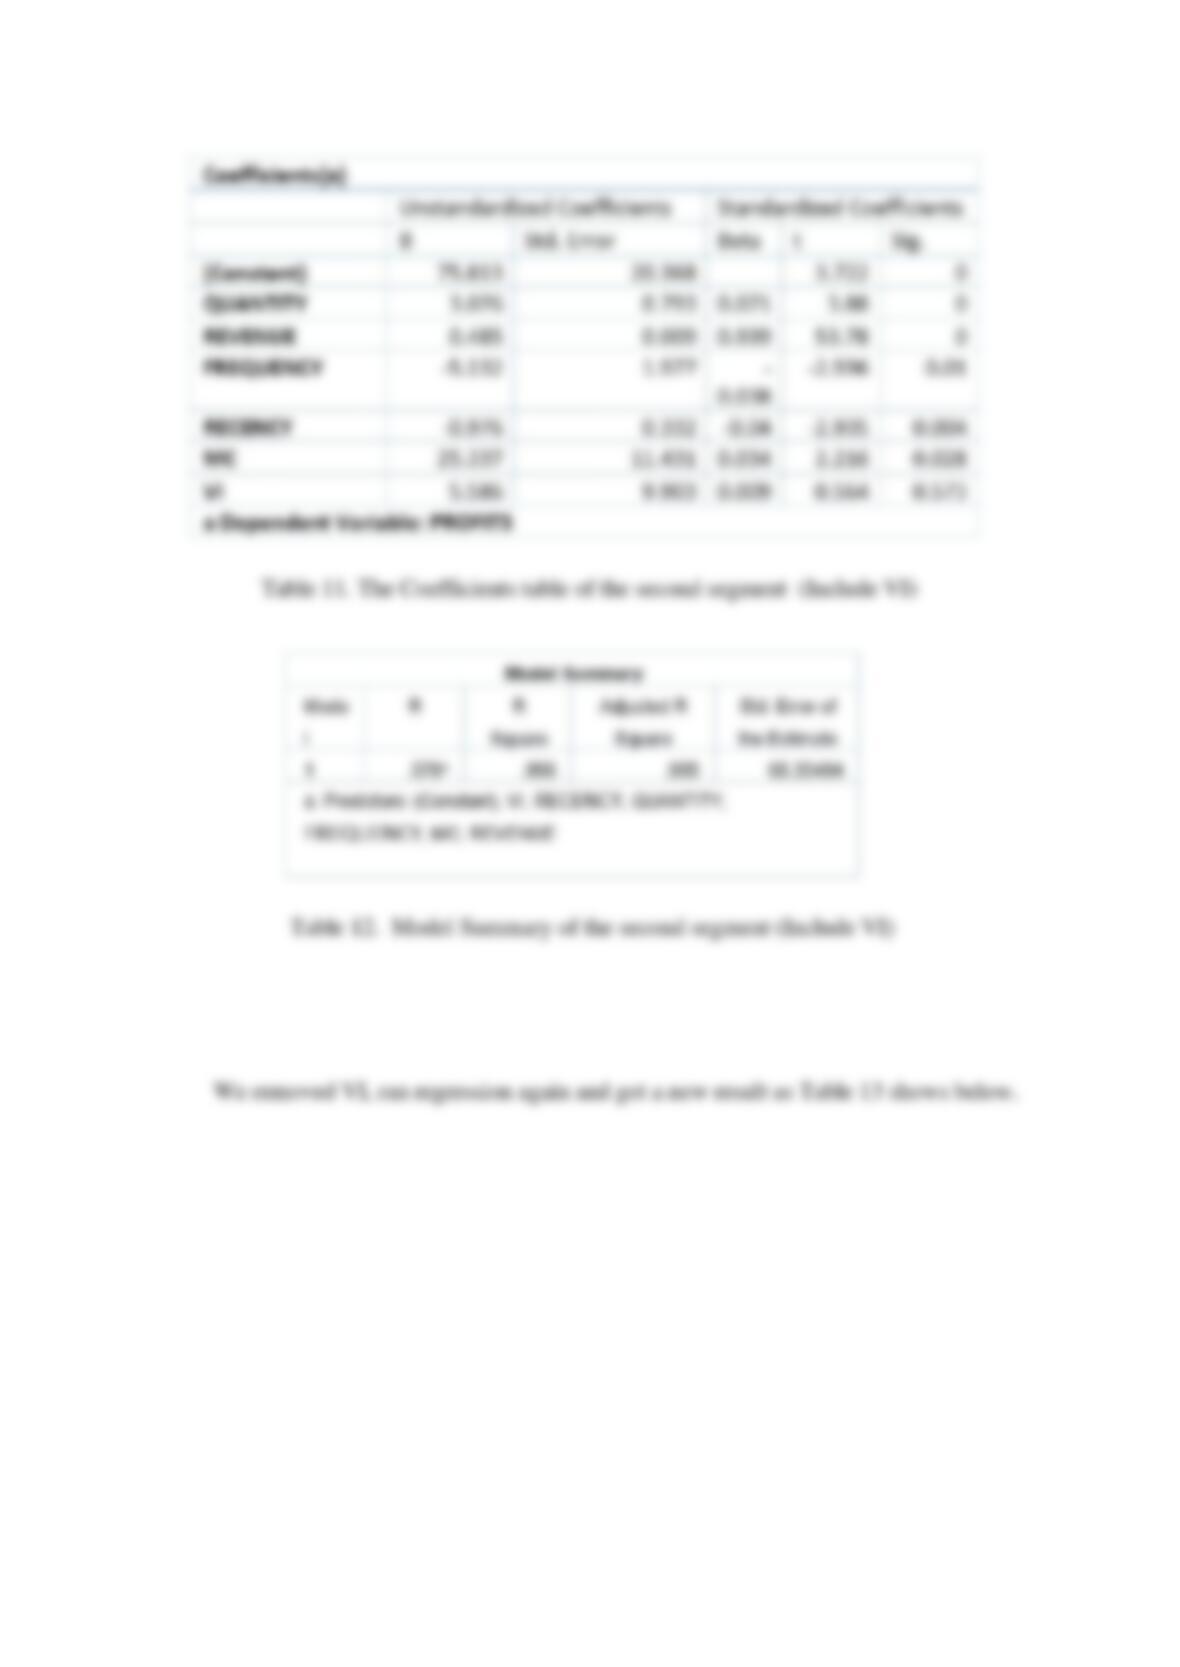
● Revenue, quantity, Mastercard, frequency, recency have significant effect on profit
● Frequency and recency have a negative effect; quantity, revenue have a positive effect
● People using mastercard generated more profits than other payment methods
Thus, for the first segment, we suggest that sending those customers time-limited
coupon and offer them more discount for buying more items at one time to incentive them to
purchase more products and more frequently. For the second segment, we should encourage
customers to buy more pieces of products, to have a more recent visit. There are two
surprising findings in segment 2: 1) Mastercard users have brought us much more profits
than other payment. We suggest the company cooperate with MasterCard to make these
people buy more. 2) Another is the negative effect of frequency on profit. So we probably
should not encourage these customers to visit too many times.
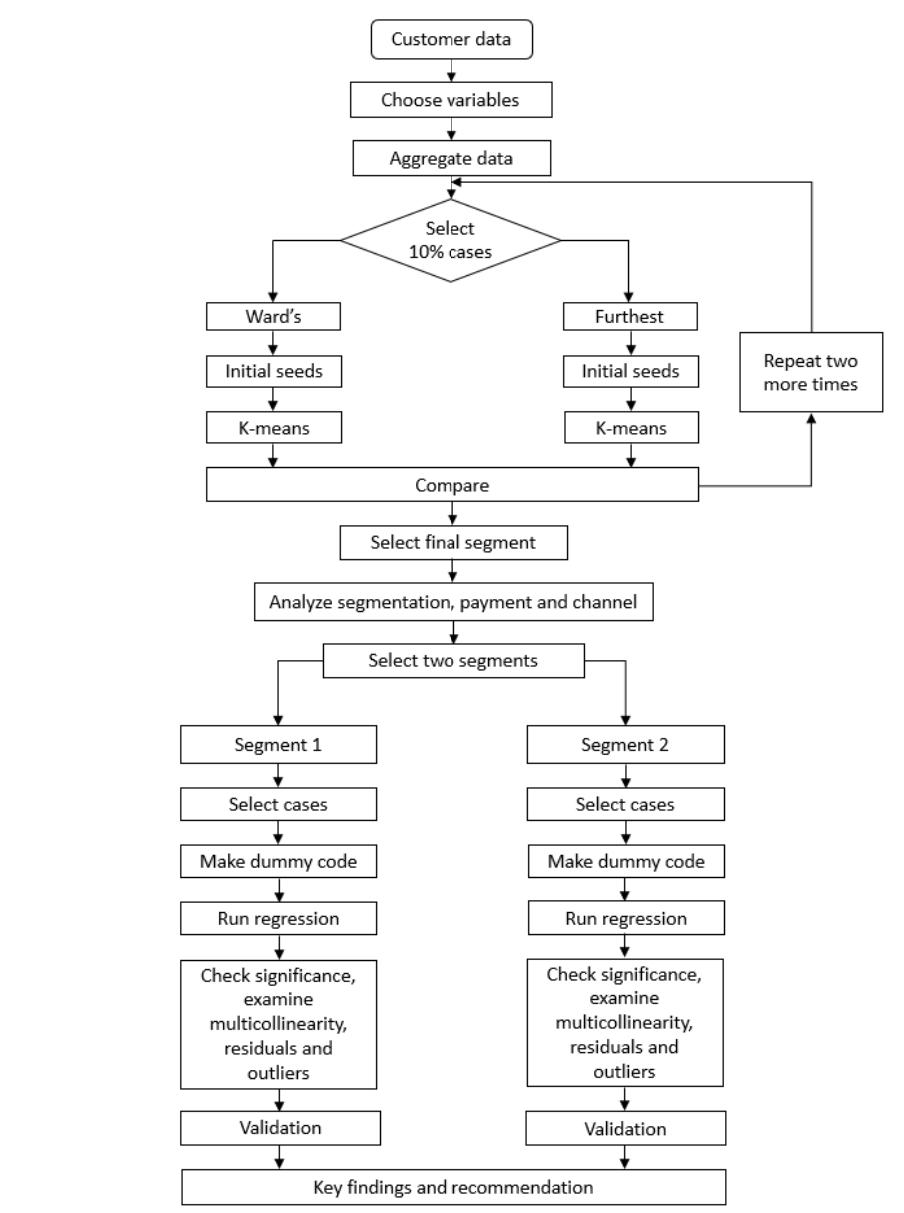
Flowchart
Table 1. The flowchart for project 2 and 3
Data Analysis
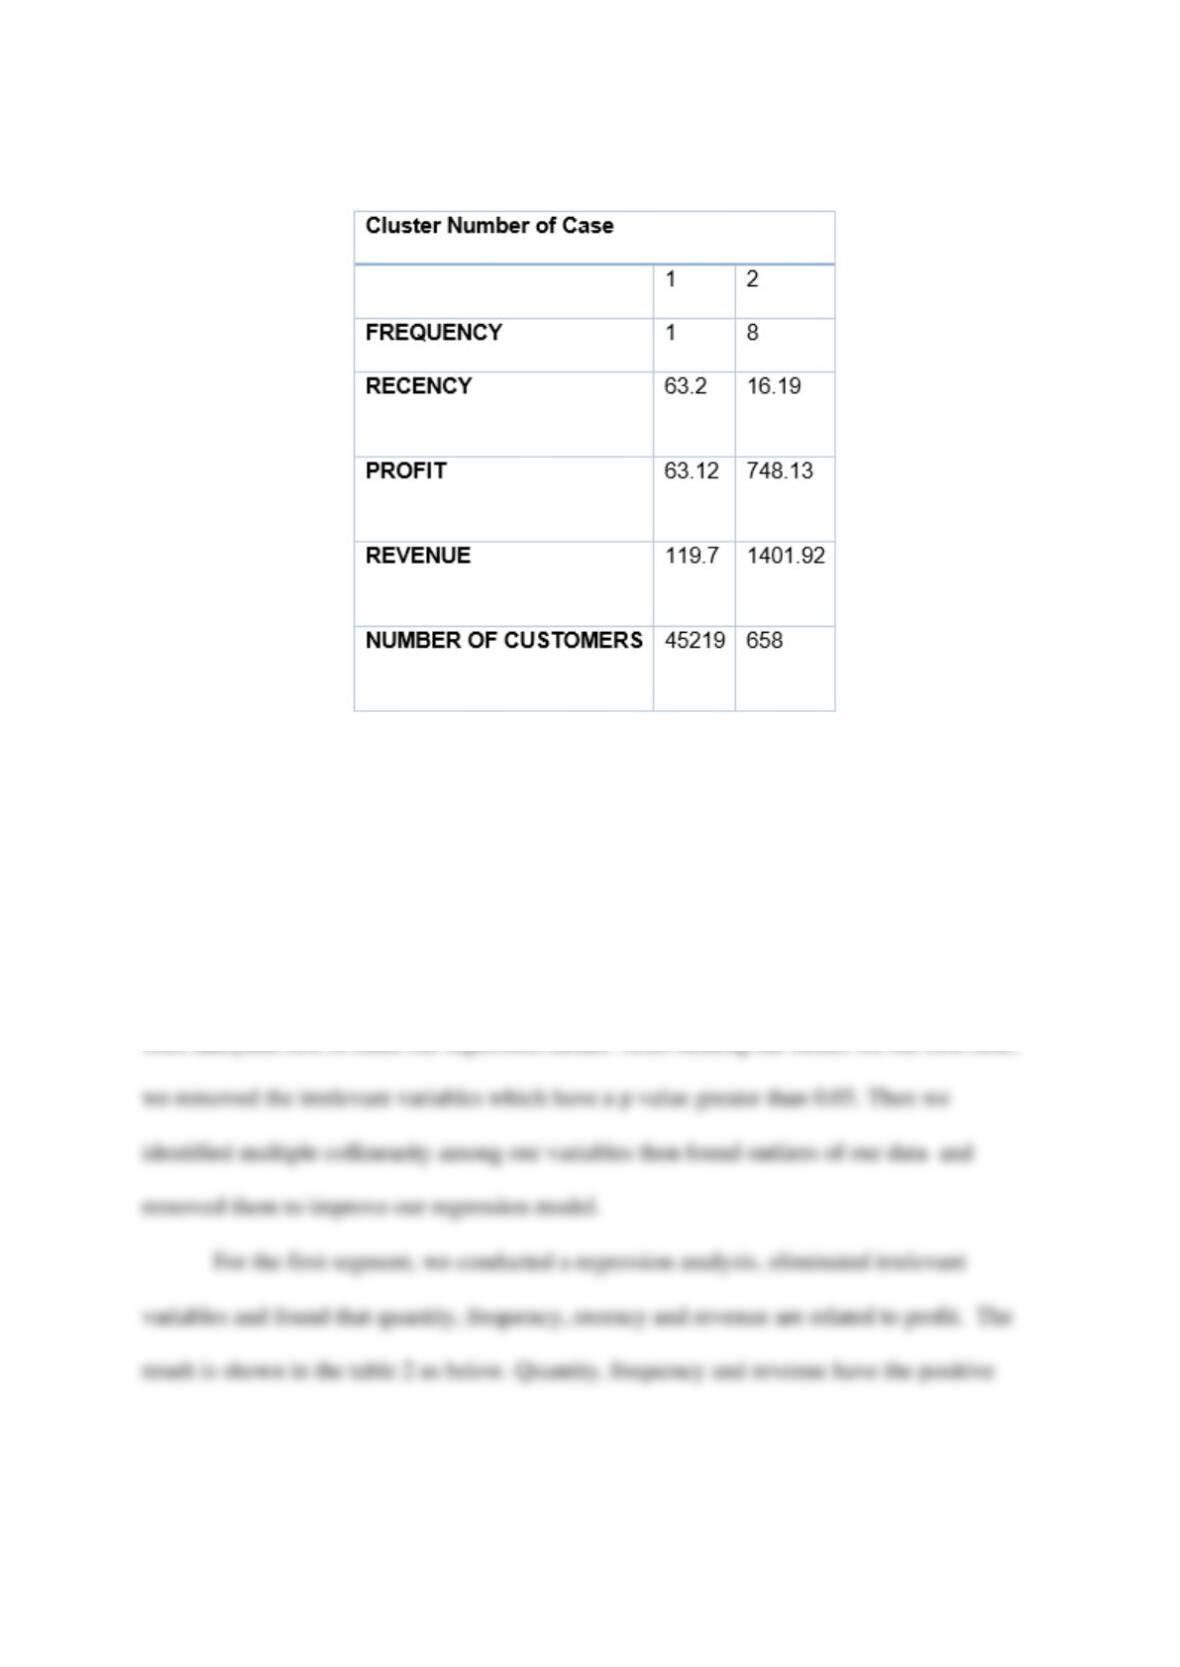
Table 2. The two selected segments
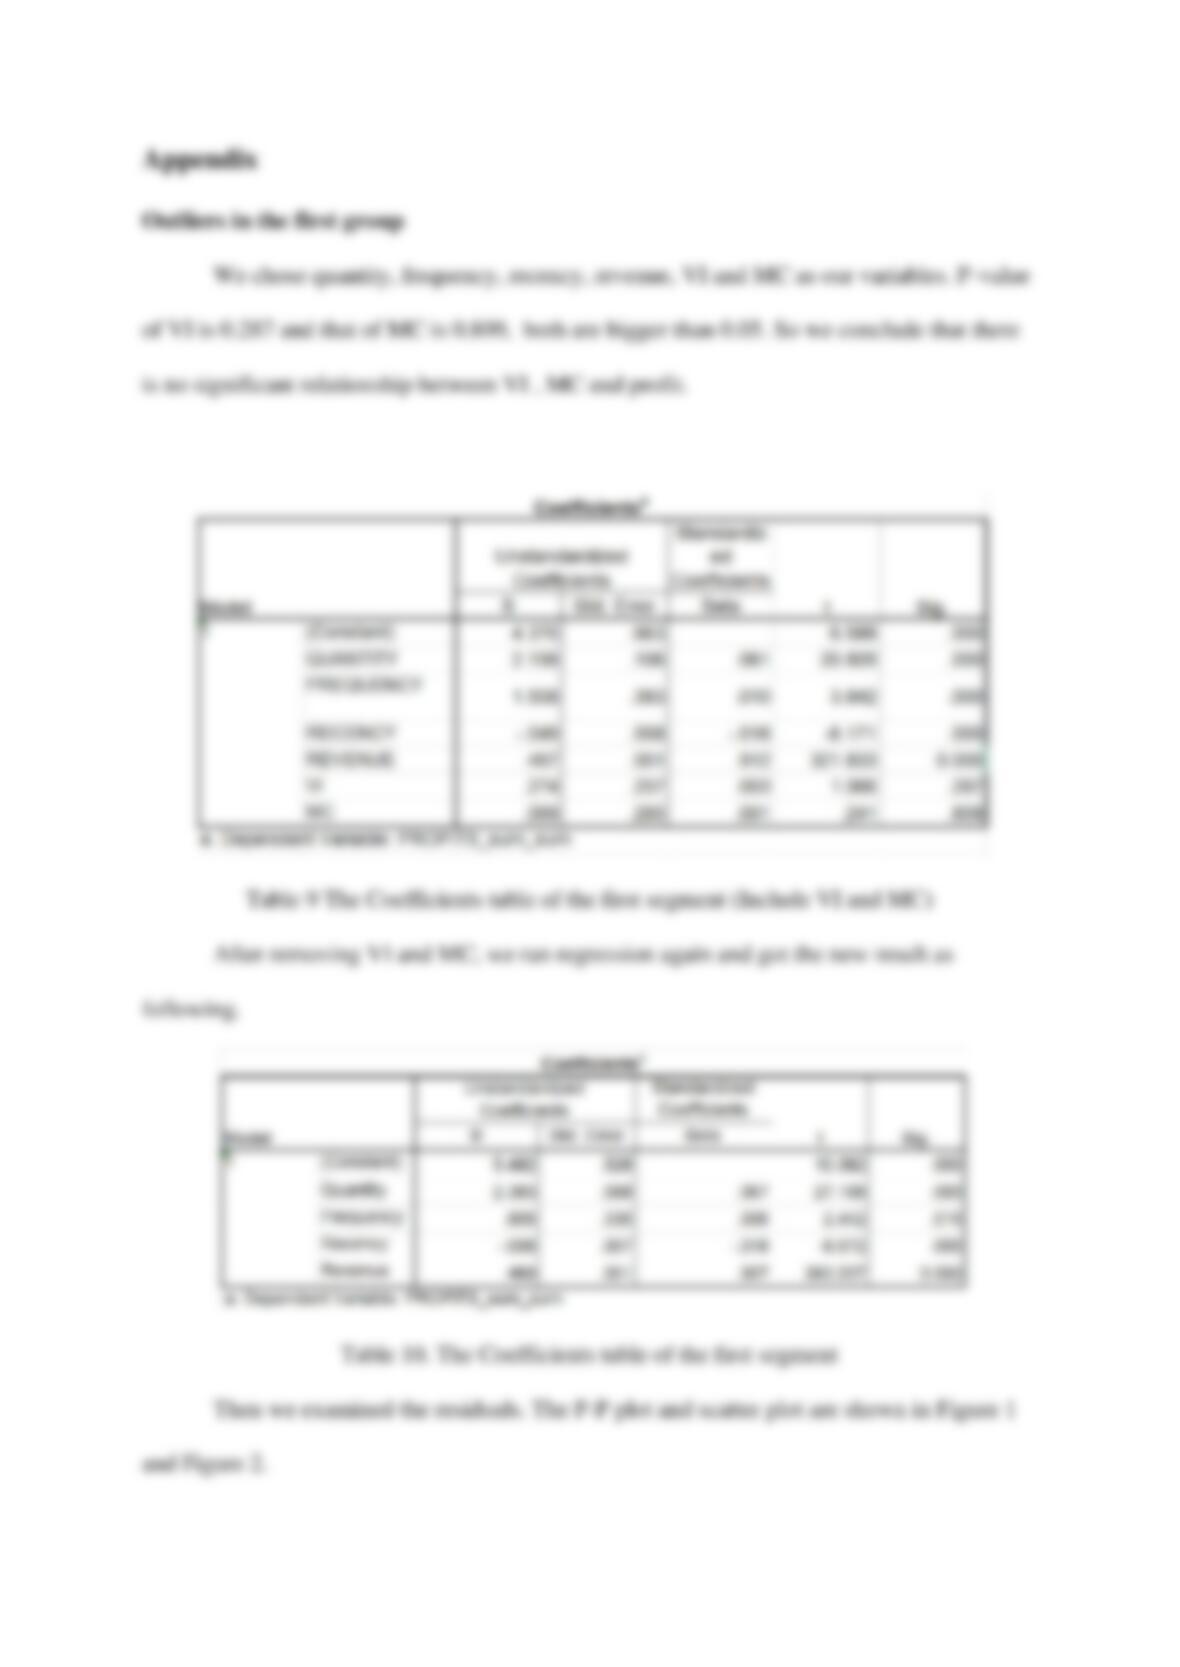
We chose frequency, recency, revenue, payment method, quantity as our original
variables. We dummy coded Visa and Mastercard from payment method as two new
variables for the regression. The overall data were randomly selected by 60% as calibration
sample; the rest were treated as validation samples. The calibration samples in the two groups