Rebecca Nugent, Department of Statistics, U. of Washington – 1 –
CSSS 508: Intro to R
3/10/06 Homework 9 Solutions
Load the MASS library into R. We’re going to look at Pima.te, a data set looking at
diabetes in Pima Indian women. The women are at least 21 years old, of Pima Indian
heritage, and living near Phoenix, Arizona. They were tested for diabetes according to
World Health Organization criteria.
library(MASS)
help(Pima.te)
attach(Pima.te)
The type variable is an indicator (Yes/No) for diabetic status.
table(type)
There are 109 diabetics and 223 non-diabetics.
The other variables are measurements taken by the US National Institute of Diabetes and
Digestive and Kidney Diseases: npreg, glu, bp, skin, bmi, ped, and age.
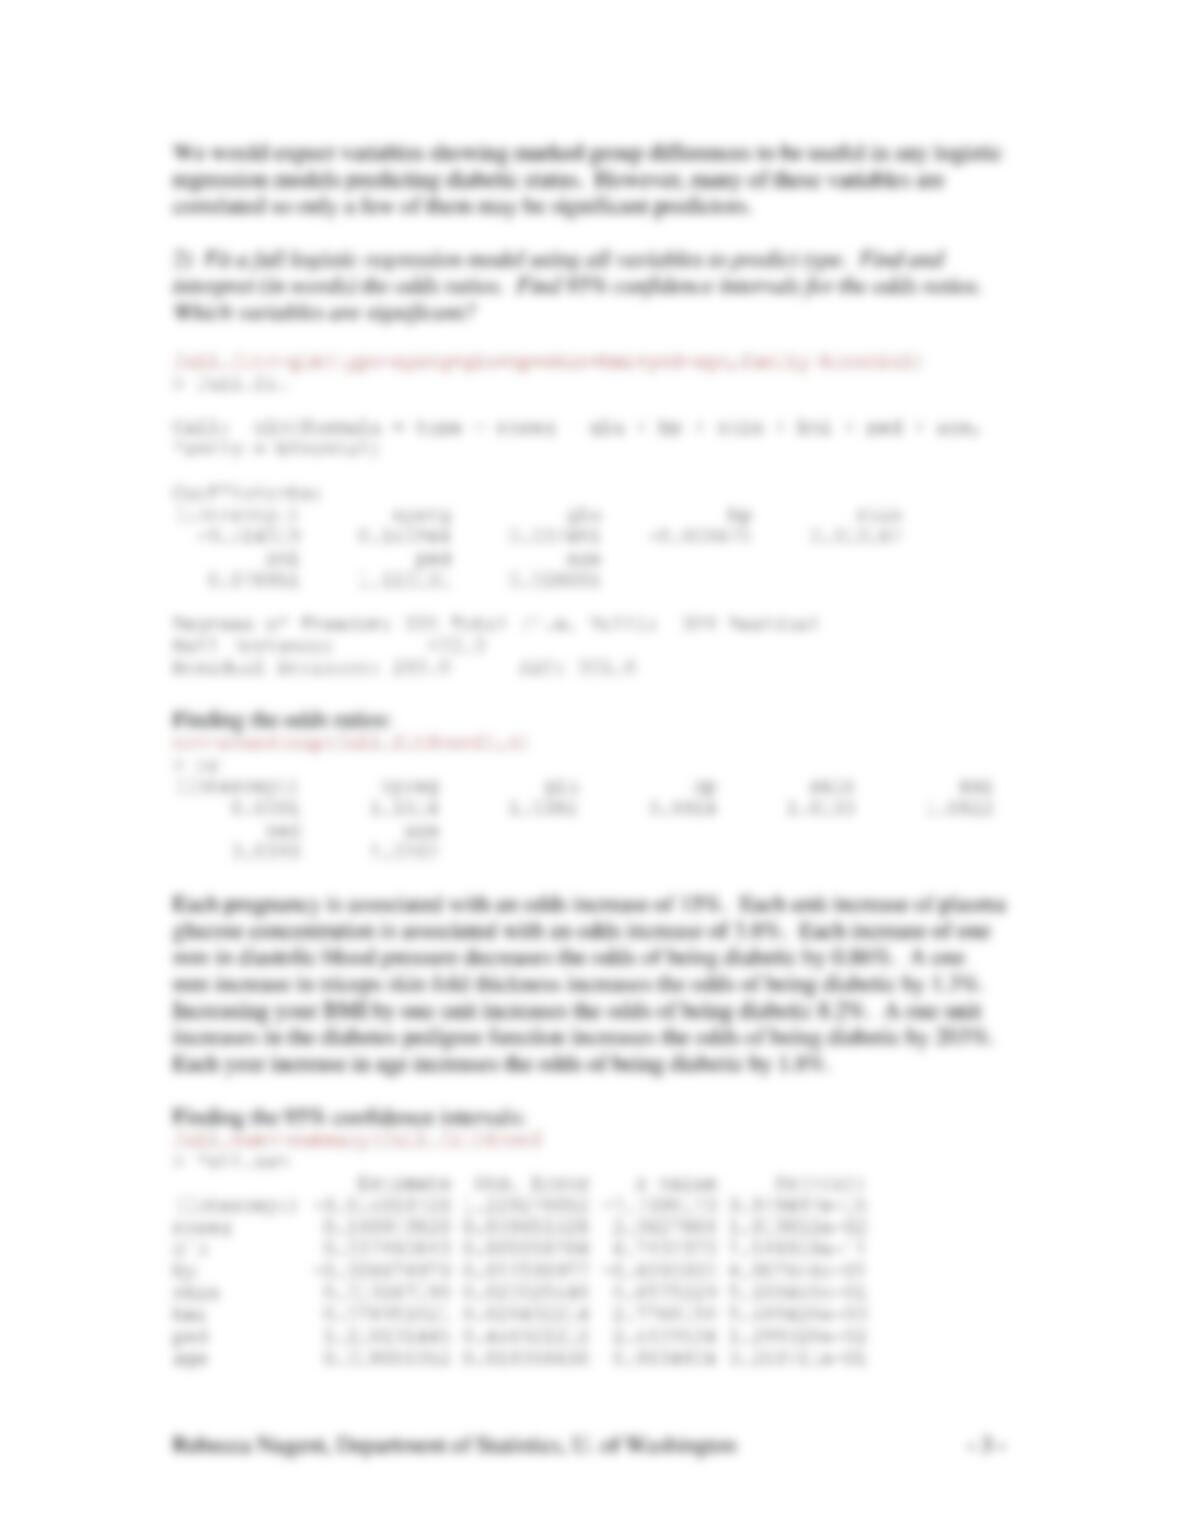
1) Use graphs to illustrate differences between the diabetic group and the non-diabetic
group. Discuss what you see.
We’re just comparing the measurements for two groups; boxplots and histograms are
easy, simple methods to show the differences in group distributions.
When we use histograms, we keep the same overall x-limits and y-limits so we can
compare the groups visually.
gr.label<-c(“Diabetic”,”Non–Diabetic”)
m<-matrix(c(1,4,5,2,3,6,7,8,9),3,3)
layout(m)
boxplot(age[type==”Yes”],age[type==”No”],names=gr.label,main=”Age”)
hist(npreg[type==”Yes”],breaks=seq(–
0.5,max(npreg)+0.5),ylim=c(0,60),xlab=”No. of
Pregnancies”,main=”Diabetic”)
hist(npreg[type==”No”],breaks=seq(–
0.5,max(npreg)+0.5),ylim=c(0,60),xlab=”No. of Pregnancies”,main=”Non–
Diabetic”)
boxplot(glu[type==”Yes”],glu[type==”No”],names=gr.label,main=”Glucose
Concentration”)
boxplot(bp[type==”Yes”],bp[type==”No”],names=gr.label,main=”Diastolic
BP”)
boxplot(skin[type==”Yes”],skin[type==”No”],names=gr.label,main=”Skin
Fold Thickness”)
hist(bmi[type==”Yes”],breaks=seq(min(bmi),max(bmi),length=20),ylim=c(0,
35),xlab=”Body Mass Index”,main=”Diabetic”)
hist(bmi[type==”No”],breaks=seq(min(bmi),max(bmi),length=20),ylim=c(0,3
5),xlab=”Body Mass Index”,main=”Non-Diabetic”)
boxplot(ped[type==”Yes”],ped[type==”No”],names=gr.label,main=”Pedigree
Function”)
Diabetic Non-Diabetic
20 40 60 80
Age
Diabetic
No. of Pregnancies
Frequency
0 5 10 15
010 30 50
Non-Diabetic
No. of Pregnancies
Frequency
0 5 10 15
010 30 50
Diabetic Non-Diabetic
60 100 140 180
Glucose Concentration
40 60 80 100
Diastolic BP
Skin Fold Thickness
Diabetic
Body Mass Index
Frequency
20 30 40 50 60
0 5 15 25 35
Non-Diabetic
Body Mass Index
Frequency
20 30 40 50 60
0 5 15 25 35
Pedigree Function