FI403E – FINANCIAL ANALYSIS
GROUP PROJECT – GROUP L
ALEXIS DA COSTA – CHRISTELLE GROTHE – SAMY BEN CHARFEDINE –
MARIEM DIALLO – FATOU DIARISSO – RUIXUE LEI – SUIAN YU – SAWA SHI
2017 – 2018

SUMMARY
Summary ……………………………………………………….…………………………………………………………. 0
Introduction ……………………………………………………………………………………………………………… 1
I – Context for the analysis: ……………………………………………………….………………………………. 2
A – A general context: Macroenvironment and Microenvironment analysis ……………………. 2
B – The Company’s Financial Context: ………………………………………………………………………. 3
II – An analysis of the financial structure:…………………………..……………………………………… 3
A- Solvency analysis ……………………………………………………….……………………………………… 3
B– Liquidity analysis………………………………………………………………………………………………. 5
C– Capital employed analysis…………………………..……………………………………………………… 6
III – Trend analysis ……………………………………………………………………………………………………. 6
A- Profitability analysis …………………………..……………………………………………………….……. 7
B– Efficiency Analysis…………………………………………………………………………………………….. 6
C– Leverage ……………………………………………………….…………………………………………………. 8
IV – Comparative analysis……………………………………………………….………………………………… 9
A- Efficiency ……………………………………………………….………………………………………………… 9
1 – Days sales in receivables (days) ……………………………………………………….……………….. 9
2- Day’s sale in inventory(days) …………………………..……………………………………………. 10
B– Liquidity and Solvency analysis ……………………………………………………….……………….. 10
1- Current ratio ………………………………………………………………………………………………… 10
2- Debt ratio ……………………………………………………………………………………………………. 10
C– Profitability Analysis ……………………………………………………………………………………….. 10
1- Return on assets (%) …………………………………………………………………………………….. 10
2- Return on equity (%) …………………………..……………………………………………………….. 11
3- Return on sales…………………………………………………………………………………………….. 11
V – Financial Cash Flow: …………………………..…………………………………………………………….. 12
A- Cash Flow from operating activities ……………………………………………………….…………. 12
B– Cash Flow from investing activities: ………………………………………………………………….. 13
C– Cash flow from financing activities ……………………………………………………………………. 13
D – Operating cash flow to total debt …………………………..…………………………………………… 14
E – Operating cash flow to dividend …………………………..…………………………………………….. 14
F – Net Cash Flow Changes ……………………………………………………………………………………. 14
VI – Conclusion: ……………………………………………………….…………………………………………….. 15
Bibliography…………………………..……………………………………………………….………………………. 16
Appendixes …………………………..……………………………………………………….………………………… 17

1
Introduction
Huawei Technologies Co. Ltd. (華為技術有限公司) is a Chinese company founded in 1987
and based in Shenzhen. It is a leading global information and communications technology
solutions providers. The deputy Chairman of the Board (CEO) and the founder is Ren Zhengfei.
It is a private and employee–owned company. The company has over 170,000 employees as of
September 2017, around 760,00 of them are engaged in research and development. It’s
considered as the largest telecommunications equipment manufacturer in the world and the
company beats Apple becoming the second largest smartphones maker. Huawei is a fast-rising
company that reached its highest annual revenue in 2017 (CNY603.6 million), an increase of
15,73% compared to 2016.
Huawei’s activities are divided into 3 segments:
– Career Network Business: Huawei build telecommunications services and network.
This is the most lucrative segment.
– Enterprise Business Segment: Huawei provides operational and consulting services and
equipment to enterprises and professional customers.
– Consumer Business segment: Huawei provide manufactured communication devices
for the consumer market such as smartphones or laptops.
The company is a pioneer on the telecommunication market developing constantly news
technologies as cloud computing: the company creates the company’s first ever Cloud Business
Unit in 2017, as AI and 5G. Huawei bets on innovation increasing massively its investments on
Research and Development these last year attaining almost CNY89,7 billion in 2017.
Huawei already represents the largest network service provider in the world with about 30% of
the global market shares. With the launch of the Honor smartphones brand and other products
related to, Huawei also compete in the ethernet switch market and telecommunication devices.
The last smartphone launched, the Honor 9 with a million copies sold in just 28 days, has more
and more success in the hexagon. However, the group wants to take full advantage of the
potential of its current assets and expects to create new partnerships they already have (Orange,
Vodafone…) to expand its network and partnership strategy to “Bring digital to every person,
home and organization for a fully connected intelligent world”, as its mission suggests.

2
I – Context for the Analysis:
A – A general context: Macroenvironment and Microenvironment analysis
The company must understand the impact of macro–environment external factors over the
business. The Information and Communication Technology Industry is a very hard challenging
environment and a constantly evolving one with continuous innovations on NTIC.
Consequently, Huawei must consider the mutations of its environment to elaborate new
strategies. The market is led by Apple and Samsung, but a lot of emerging actors as Xiaomi are
coming up and currently hold more than one third of the market shares. Huawei is placed just
behind Apple and Samsung and is progressively growing its market shares. To be on third place
in the market, Huawei have made the choice of the geographical implantation in China. They
play as a national role model and it warrants economic and political stability. To respond to the
customer demand, Huawei invests a lot on R&D as we said before, to be at forefront of
technology to maintain a competitive advantage in this highly competitive environment. It’s for
that Huawei can come up with innovative products holding many patents by Chinese standard
and recruiting high educated employees. To be at the top of the list, Huawei tries to find new
business opportunities and to anticipate future trend to outperform the company’s competitors
and achieve superior profitability.
Let’s focus on the micro–environment now. Huawei is focus on a business model based on
delivering the best value proposition to the customer while being profitable and cost-effective.
As his mission said “Bring digital to every person, home and organization for a fully connected
intelligent world” testifies its strong customer value proposition. Its strategy is to deliver a real
brand experience to its customers for maintaining a loyal customer base. Huawei have a huge
success in China and particularly in Europe and the company increased its market shares on the
hexagon market.
However, this strong brand image is also controversial due to Huawei‘s ban on entering the US
market and Huawei’s presence in South Asia and India which is relatively weak. This is a major
loss of revenue for a flourishing market such as the United States or these emerging countries.
Huawei also maintained its decision not to go public. In addition to the gain in notoriety, the
initial public offering offers the opportunity for a new source of financing. The capital increase
provides funds to ensure rapid development.
3
In the long term, the reluctance to go public and the exclusion from the American market and
his weak presence in emerging countries can be sources of reflection in Huawei‘s development
strategy. In case of a significant need for funds to finance new innovations, since an initial
public offering may be an appropriate response, thanks to the large source of funding it offers.
B – The Company’s Financial Context:
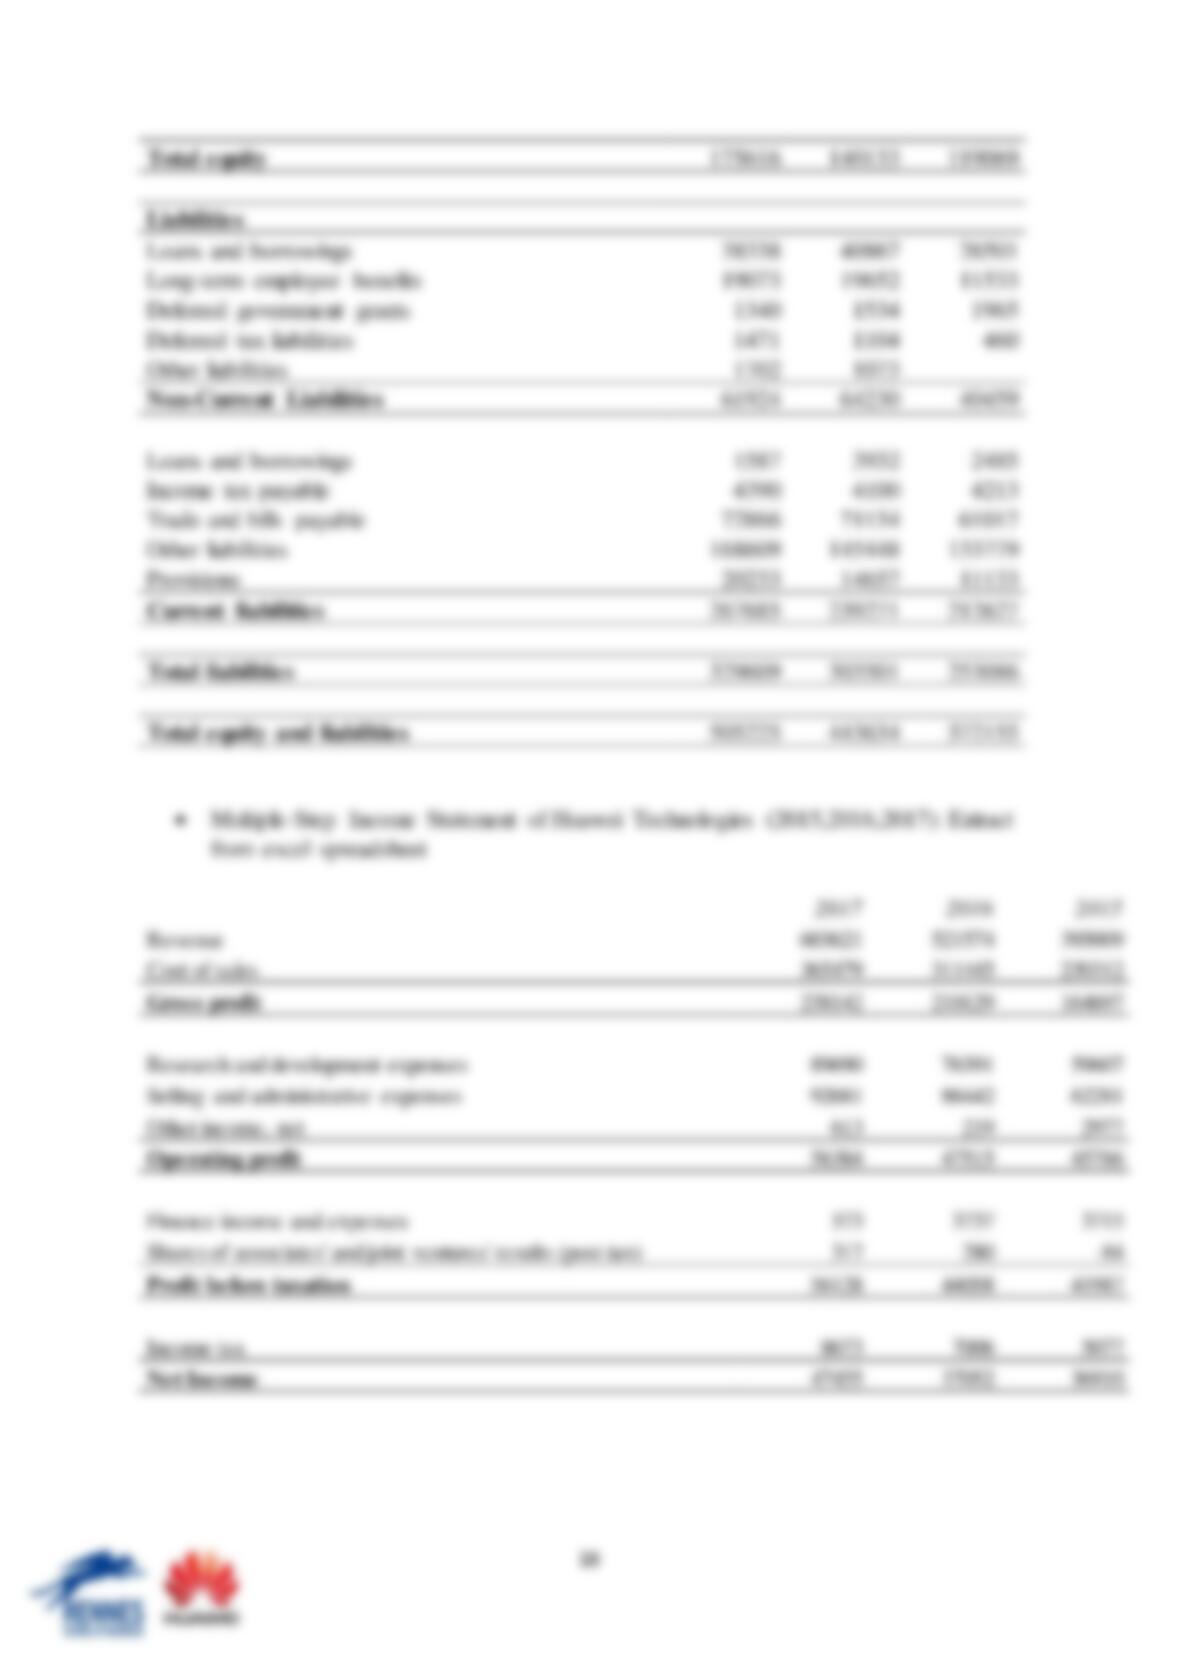
Despite a challenging market environment, Huawei has recorded revenue growth with a CAGR
of 20,36% these last 5 years. The revenue grew steady from CNY239,025 million to
CNY603,009 million. Sales don’t stope to increase for Huawei and show us how the company
is expanding. We must underline the fact that one of the biggest project of Huawei is developing
5G network. The company expect to create the first 5G network by 2020.
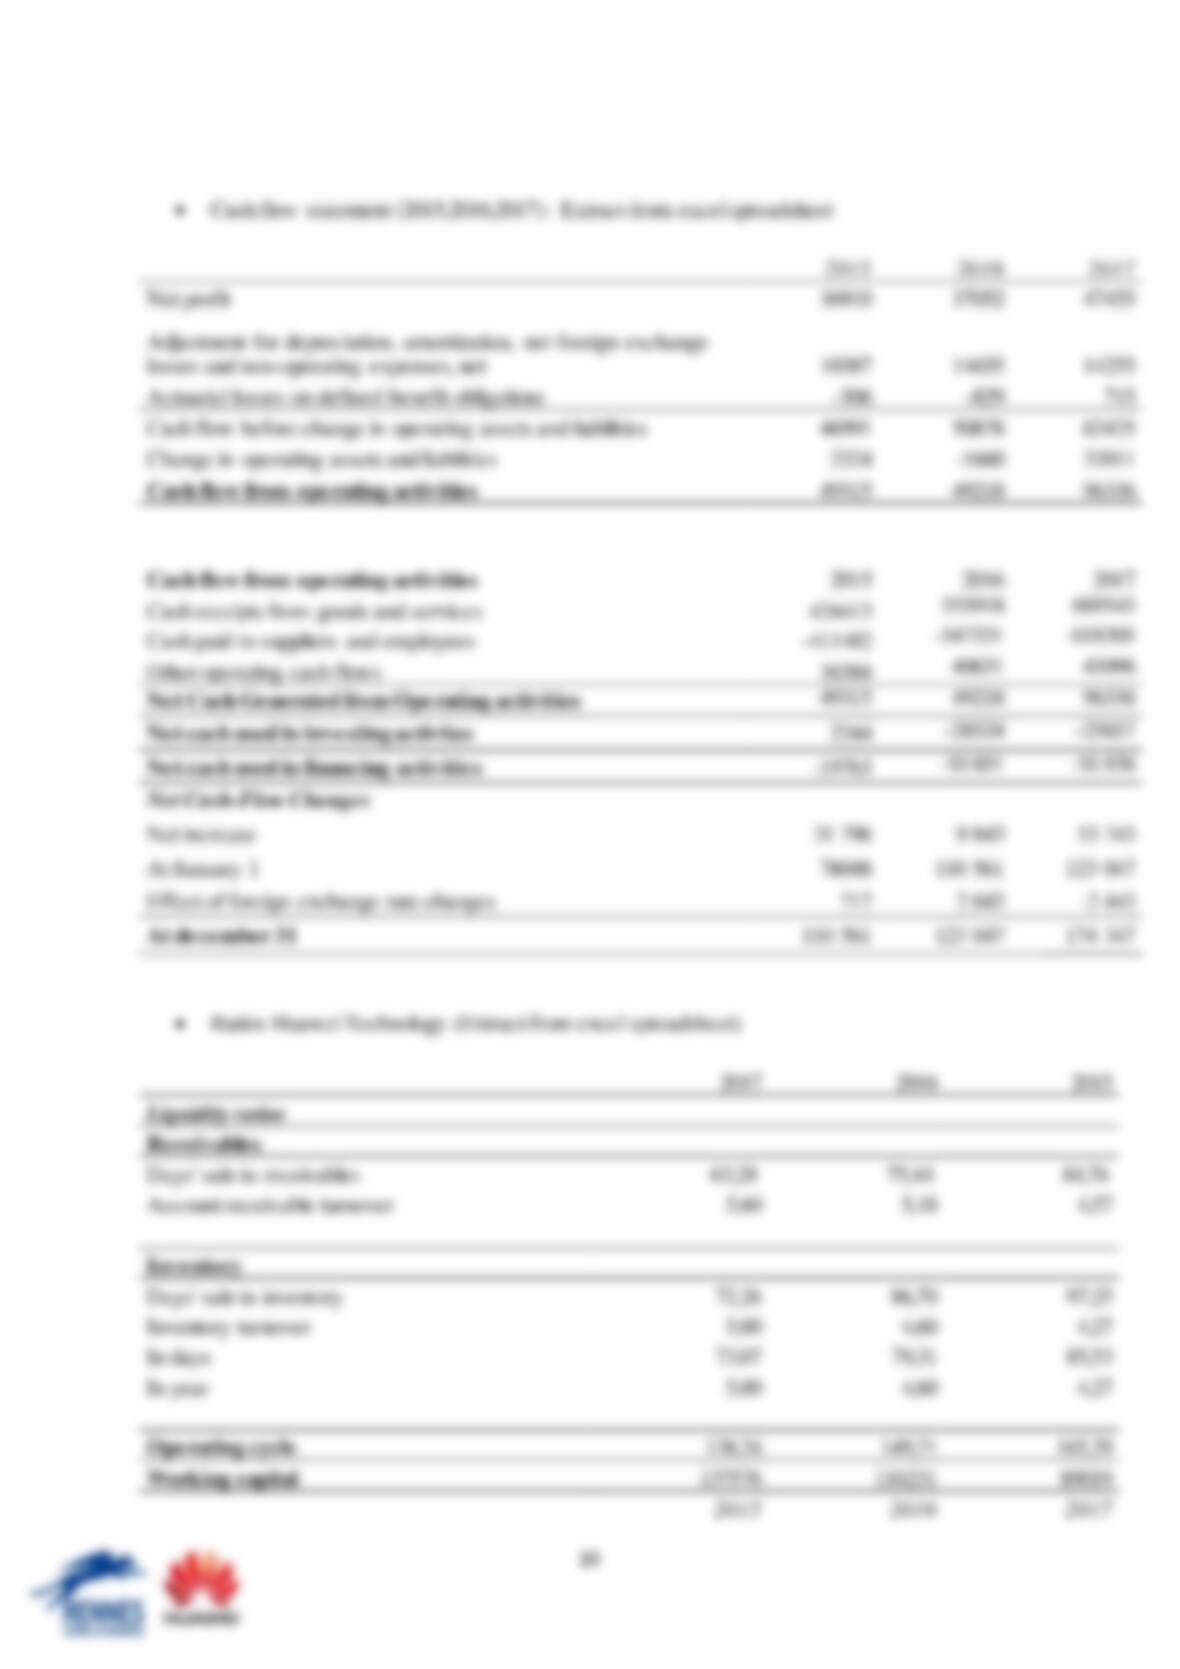
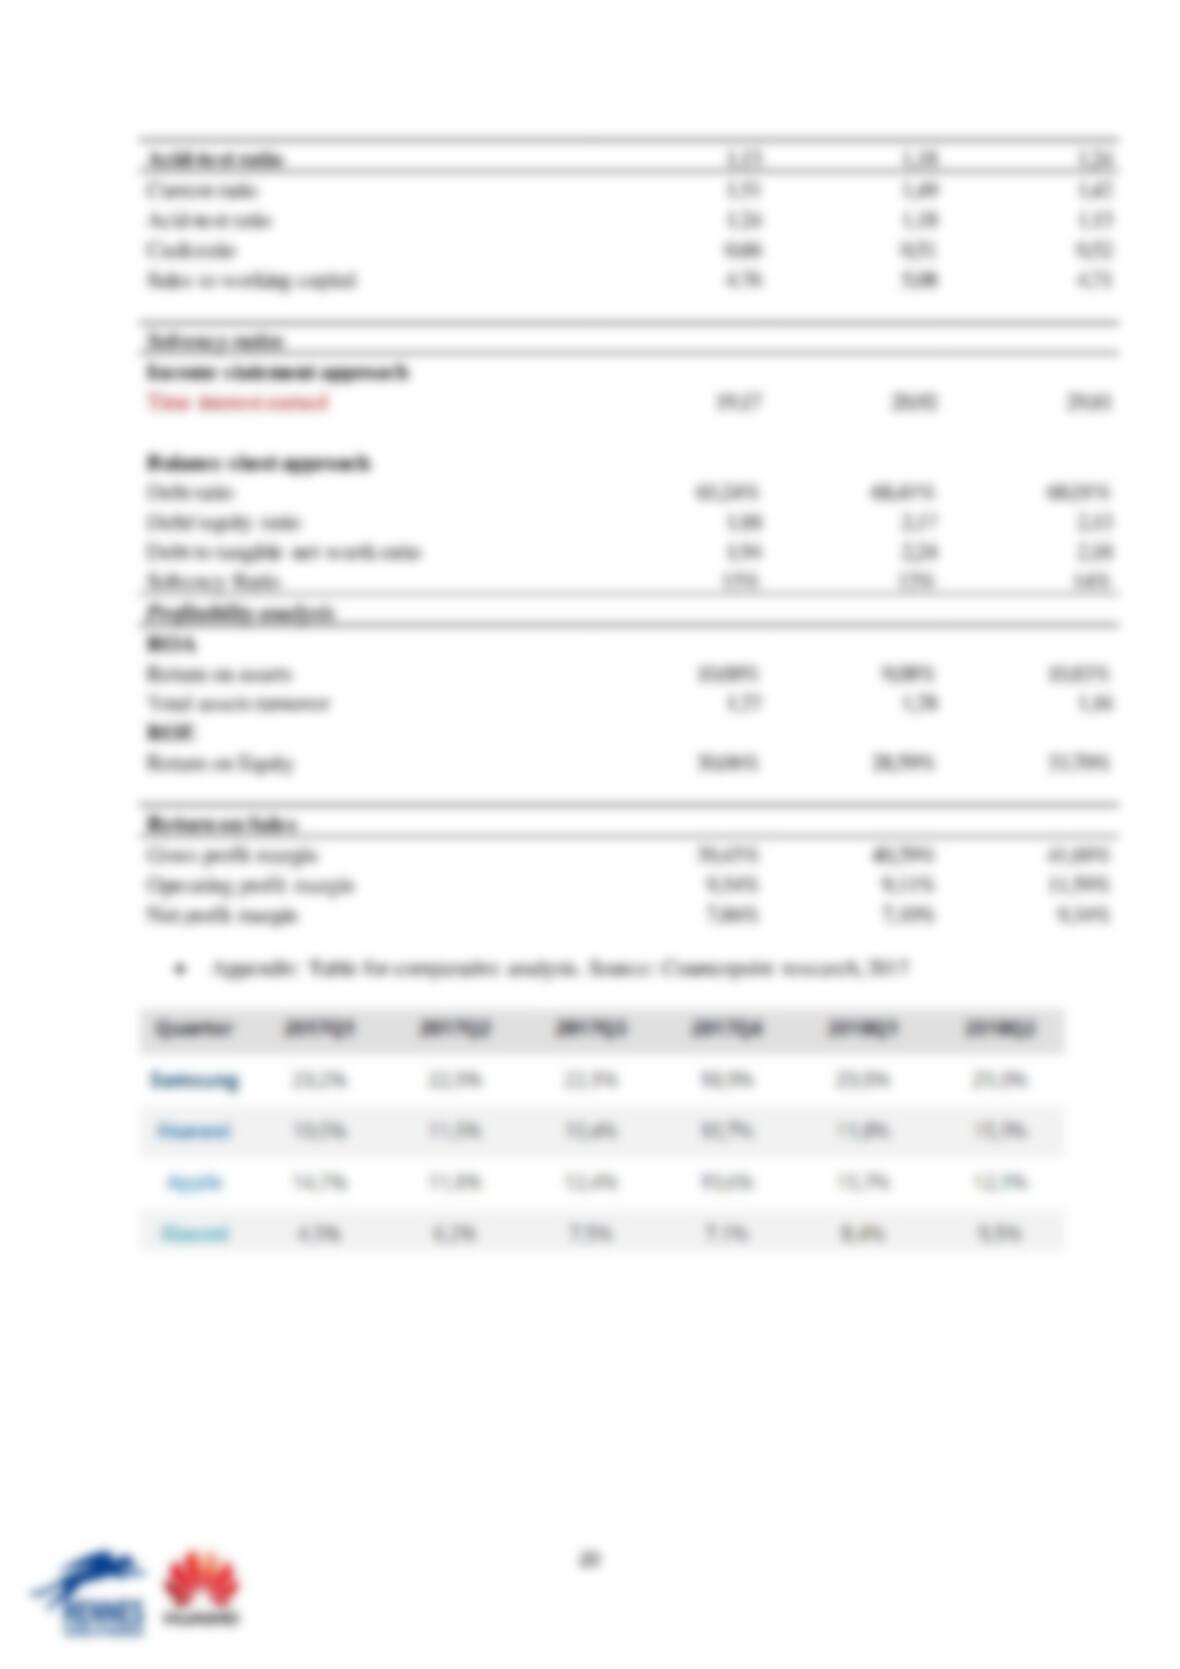
The ratios we have calculated will help us to analyse Huawei’s Health. During our work, we
will analyse ratios based on the Balance sheet, Income statement, and Cash Flows Statement.
The main purpose is to point out the qualities and dysfunctionalities of investments and current
operations of the company. We extracted figures directly from the Annual Report of Huawei
Investment and Holding Co. Ltd between 2013 and 2017 for having exact and authentic
information. We computed directly ratios on Excel sheet, an explanatory table will be attached
in appendix (Appendix). All our data are in millions of CNY (1 CNY = 0,13€).
II – An analysis of the financial structure:
The financial structure of the company permits us to analyse the Huawei’s financial health. This
part is focus on the liquidity and the solvency of the company by analysing financial resources
allocation.
A– Solvency analysis
The solvency analysis deal with the ability of the company to meet its long–term financial
obligations.
2015
2016
2017
Debt ratio (Total Liabilities/Total Assets)
68,01%
68,41%
65,24%
The debt ratio is relatively stable. It gives us the percentage of Huawei’s assets financed by
debt. We can point out that the ratio is lower in 2017 compared to 2016. It declined by 3
percentage points in 2017 which implies a more stable business with the potential of longevity
because a company with lower ratio also has lower overall debt. This trend can be understood
4
because the increase in total assets is higher than the increase in debt. Being greater than 65%,
we can say that most than the half of the assets are financed by debt and not by equity. Huawei
could improve this ratio by using more equity capital to finance its business.
Shareholders’ equity is constantly increasing and represents in average 33% of liabilities. This
is the real value of the company, in the case where all assets have been sold and liabilities have
been fully paid on a given date. This also reflects Huawei‘s solvency in the way that after
covering its obligations it remains a significant value.
2015
2016
2017
Debt/ equity ratio (Total liabilities/ Shareholders’ Equity)
2,13
2,17
1,88
For the debt to equity ratio, we can see that Huawei uses two times more credits than capital
coming from its shareholders. The debt to equity ratio is higher than 1 which means that
Huawei’s structure is risky for creditors. However, the fact that the ratio has decreased from
2,17 to 1,88 between 2016-2017 put the company in an advantageous position. The equity
registers a higher increase than increase of debt which means that Huawei is more financially
strong.
2015
2016
2017
Time interest earned (EBIT/ Interest Expense)
29,81
20,92
19,17
The interest times earned ratio underlines the ability of Huawei’s ability to honor its debt
payments and cover its interest expenses with its EBIT.
In this chart, the ratio remains relatively high despite a decline of 30% in 2016 and then 8% in
2017. Huawei can cover its interest expenses with its operating income but the decrease shows
that the coverage is more difficult for Huawei in 2017 than in 2016. For example, in 2017
Huawei can cover its interest expenses 19 times using its income. This ratio is a safety margin
for shareholders.
2015
2016
2017
Solvency Ratio ((Net Income+ Depreciation)/Total liabilities)
15%
12%
14%
The solvency ratio measures if Huawei has sufficient cash flow to meet its debt and obligations.
With a ratio which does not reach over 15% these last 3 years, it indicates that Huawei will not
cover its long–term debt. This ratio sends a bad signal for Huawei’s finance.
However, the situation improved in 2017 with a minor difference of two percentage points
passing from 12% to 14%.
B– Liquidity analysis
The liquidity approach is focus on short-term commitment; if Huawei can cover its short-term
liabilities.
One of the most representative is the current ratio.
2015
2016
2017
Current ratio (Current Assets/Current Liabilities)
1,42
1,49
1,51
The current ratio is strictly above 1 and has increased over the past 3 years, which shows that
the company has sufficient current assets to meet its short-term obligations by paying off its
creditors. As a result, the financial situation has improved for Huawei.
The Acid-test ratio can be used to know if the company can cover its short–term liability only
dealing with its liquid assets and not with the inventories. These liquid assets can be easily turn
into cash in the short-term.
2015
2016
2017
Acid-test ratio ((Current Assets – Inventory)/ Current Liabilities)
1,13
1,18
1,24