1. Model
1.1. Model with religious diversity index
Religious Diversity Index (RDI) combines the shares of eight major world religions and it
is constructed in a three stages. The shares are squared and summed in the first step and it
represents the maximum diversity when all major religions are considered. The second step is
called inverting, where the result in the first step is subtracted from 10. It means that when
the country belongs to one religious group, the score would become zero (10 – 10 = 0 – no
diversity). The result from the second step is divided to 875.
1
RDI is divided into four levels: low (between 0 and 3), moderate (between 3 and 5.5),
high (between 5.5 and 7) and very high (between 7 and 9.5). It has to be mentioned that
there is no precise breakpoint for the levels based on the size of the largest religious group.
Very high diversity is defined as no more than 50% of the population belonging to the largest
religious group. Accordingly, for the high, moderate and low diversity the largest religious
group accounts for less than 70%, between 70-85% and more than 85% of the population
respectively.
The reason for adding the RDI into the model is to check whether the diversity affects the
economic growth or not. In one study, Montalvo and Reynal-Querol (2004) found that when
the country is less diverse, it has a negative effect on economic development. They concluded
that less diversity reduces investments, while increasing government consumption.
After adding RDI into our model, our final equation will be formulated as:
𝑙𝑛𝐺𝐷𝑃𝑝𝑒𝑟𝑐𝑎𝑝𝑖𝑡𝑎 = 𝛽0+ 𝛽1𝑆 + 𝛽2𝐾 + 𝛽3𝑅𝐷𝐼 + 𝑢
where S is the gross savings, K is the total capital formation. In this formula RDI will have a
categorical variable.
1.2. Model with attendance at religious services and belief in god
This part of model uses the same economic indicators and adds two religious variables.
These two variables are in some way different from the RDI. They are based on the choices of
individuals and rely on the self-identification of respondents.
First dependent variable is attendance in religious services
2
. Theoretically, attending
religious services frequently might lower the productivity considering that it may require
1
It is obtained from the situation when all religious groups are equally distributed. Hence, in a scale of 0-10 the
score for each religion becomes 1.25. Subtracting it from 10 and dividing the result to 875 gives 10, which is the
maximum result for RDI – highest possible religious diversity.
2
In Barro and McCleary’s paper (2003), related variable is written as church attendance, which is nothing else than
attending the religious services. In order to avoid confusion, we called it by its own name.
people to spend more time on religious activities. On the other hand, religious activities help
people come together, which may inspire volition.
Second variable is belief in god. The data for the variable is obtained from sixth-wave of
World Values Survey (2010-2014) and it shows which fraction of the population believes in
god in a country. It is assumed that beliefs may influence people’s actions and behaviors.
According to the findings of Barro and McCleary (2003), first variable will be taken
account in every model, whereas inclusion of belief in god in the regression will be varied.
Final regression model is going to be:
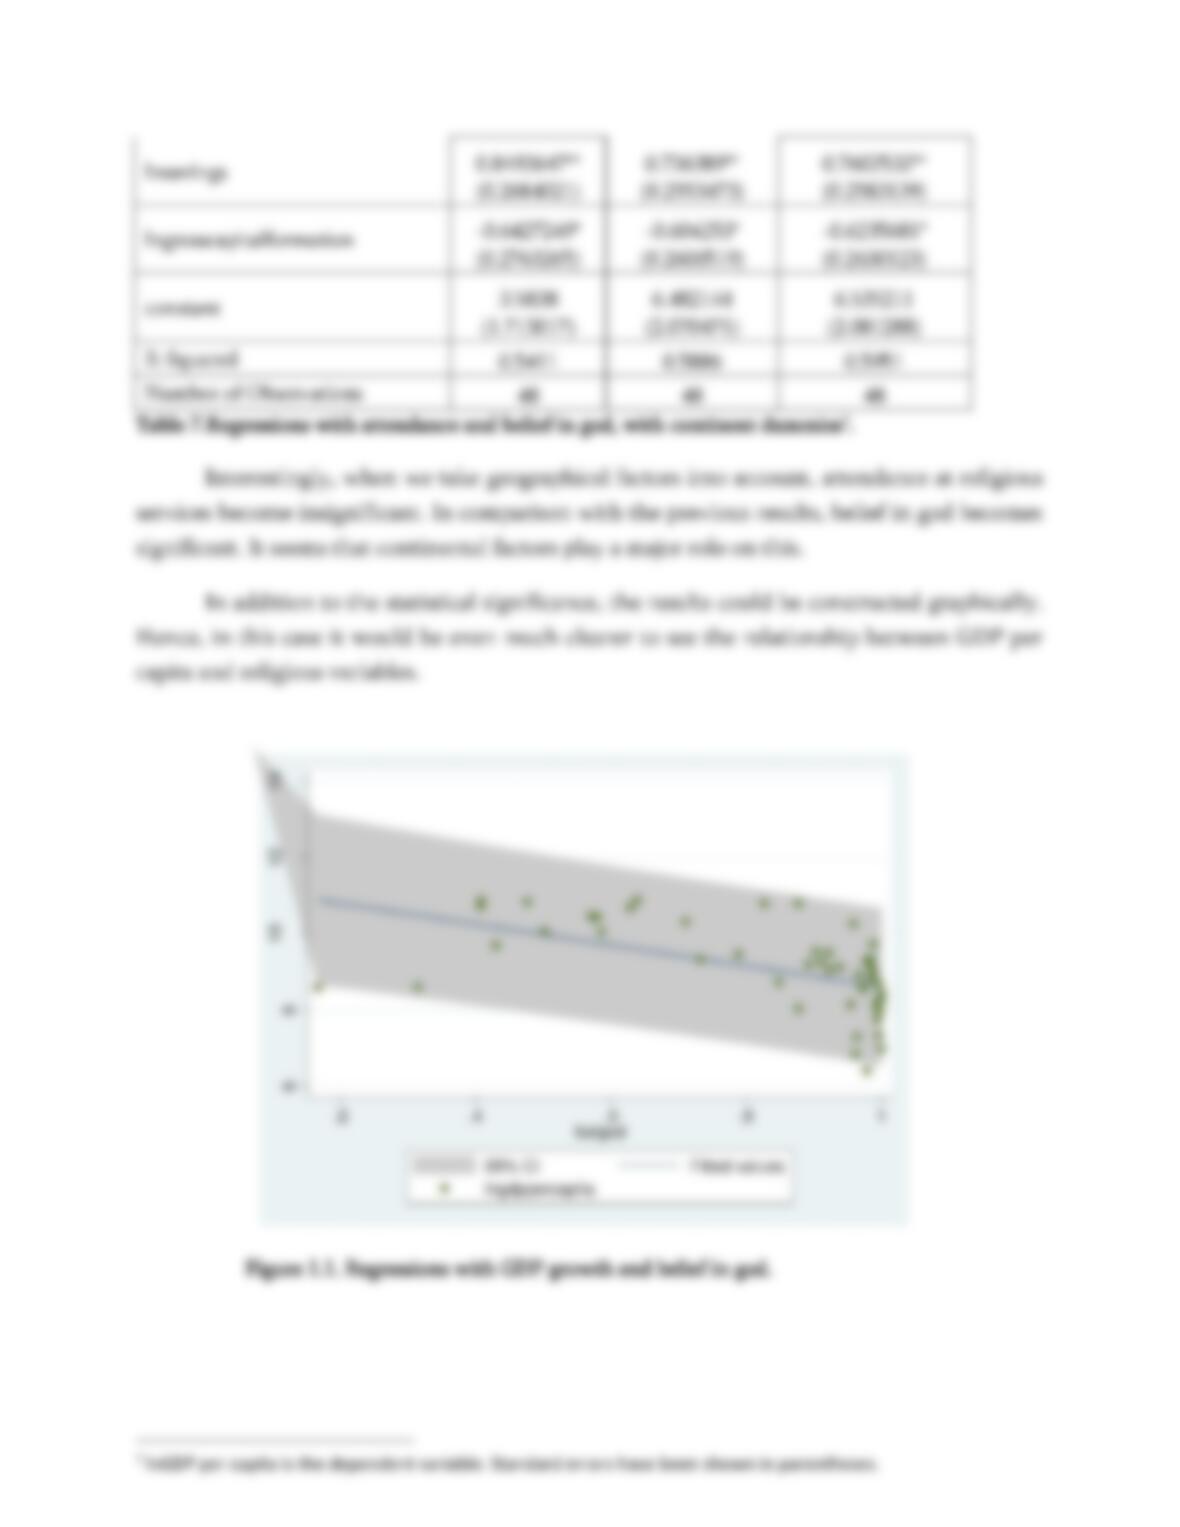
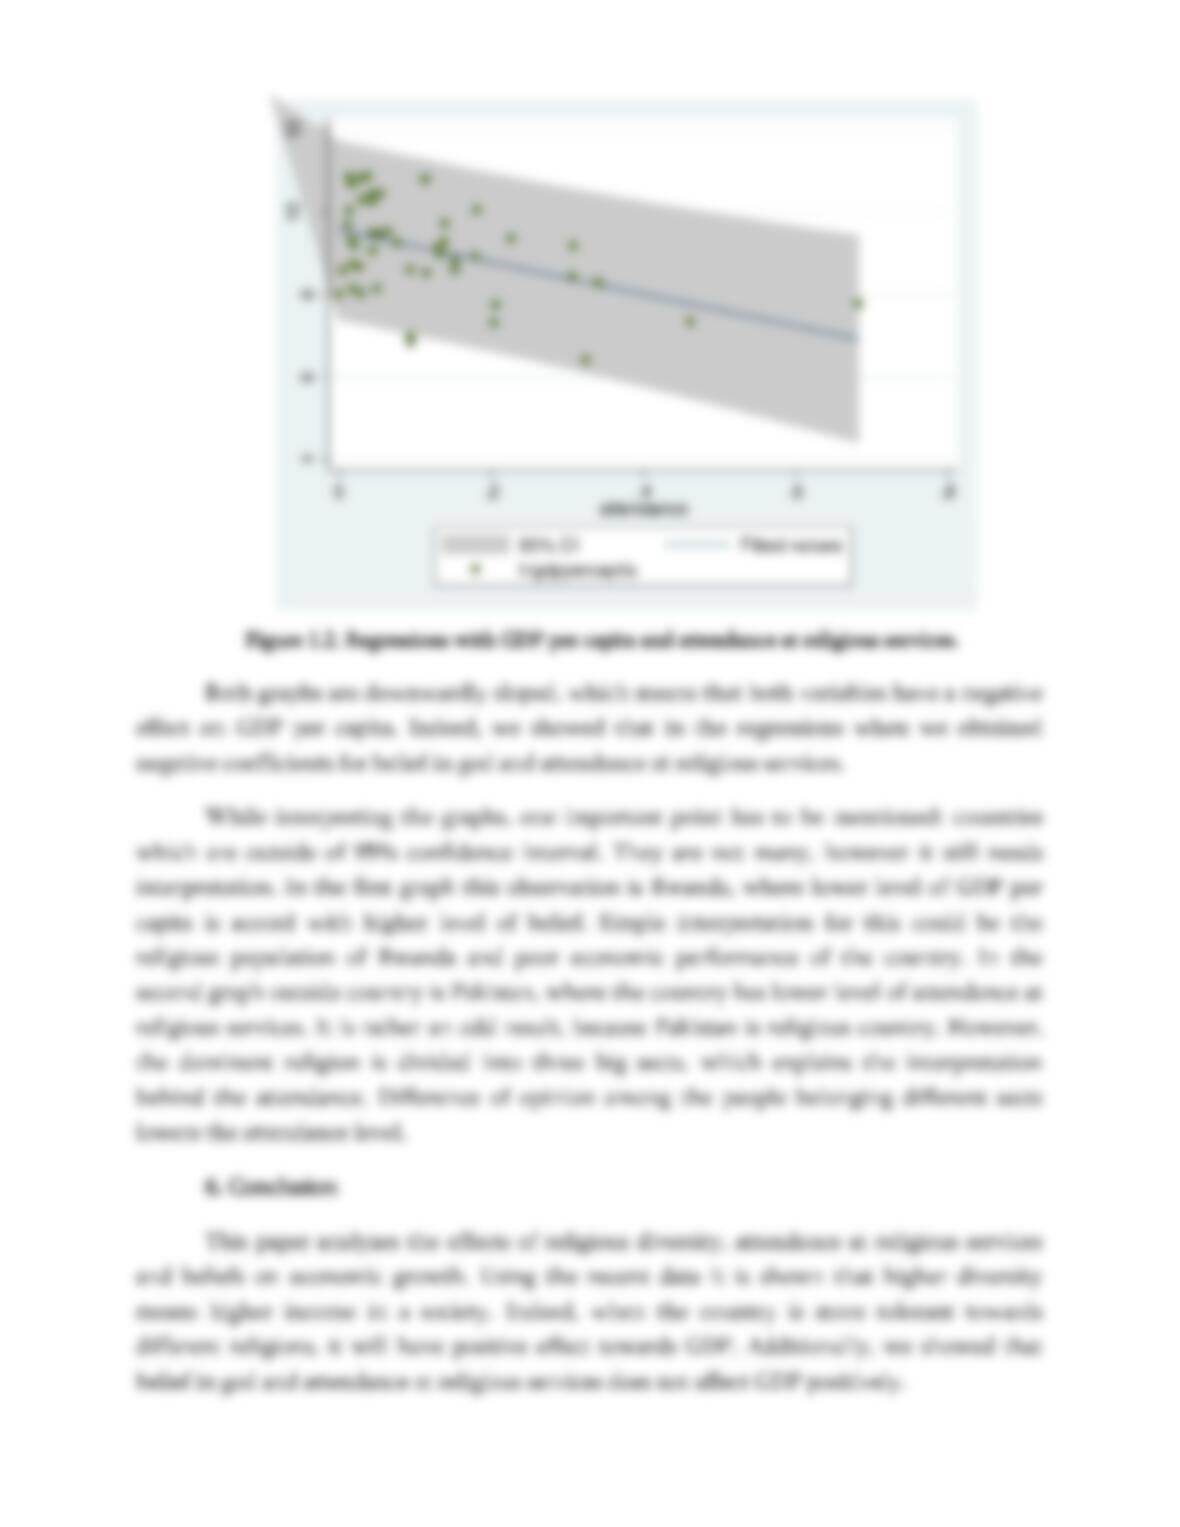
𝑙𝑛𝐺𝐷𝑃𝑝𝑒𝑟𝑐𝑎𝑝𝑖𝑡𝑎 = 𝛽0+ 𝛽1𝑆 + 𝛽2𝐾 + 𝛽3𝑎𝑡𝑡𝑒𝑛𝑑𝑎𝑛𝑐𝑒 + 𝛽4𝑏𝑒𝑙𝑔𝑜𝑑 + 𝑢
4. Data & Methodology
In this research we use two types of datasets, one for religiosity and one for the
determinants of the growth.
Religiosity dataset comes from two different data sources: World Values Survey
(WVS) and Pew Research Center (PRC). WVS data consists of six-wave aggregate of the
values studies and the number of participant countries changes from wave to wave. Hence, it
creates difficulty for the regressions, because there is going to be missing data issue. This
research uses only the last wave (2010-2014) for religious variables such as attendance in
religious services and belief in god. Eum (2011) applied the same approach and used the
fourth wave of the data, which was available during that time – in order to check the
consistency of previous studies. Table 1 shows the means and standard deviations of the
variables used to test the significance of religious activities and beliefs on GDP per capita. The
share of major religions is obtained from PRC’s database. These shares have been used to
construct RDI for each observation.
Variable
Obs
Mean
Std. Dev.
Min
Max
Lngdppercapita
48
9.0893
1.152816
6.412183
10.87978
lnsavings
48
24.72166
1.965623
20.64405
29.06862
lngrosscapitalformation
48
24.72711
1.910233
20.113
29.01928
percentchristian
48
0.5282449
0.3655805
0.001
0.995
percentmuslimm
48
0.2373061
0.3655641
0.001
0.999
percentunaffiliated
48
0.1403878
0.1772839
0.001
0.596
percenthindu
48
0.0255714
0.1171763
0.001
0.795
percentbuddhist
48
0.0504082
0.1531403
0.001
0.932
percentfolreligions
48
0.0131837
0.0358589
0.001
0.219
percentotherreligions
48
0.0057347
0.0153117
0.001
0.097
percentjewish
48
0.0016531
0.0025458
0.001
0.018
Belgod
48
0.826102
0.2217653
0.168
1
attendance
48
0.1205102
0.1339428
0.004
0.683
Rdi
48
3.546939
2.414548
0
9
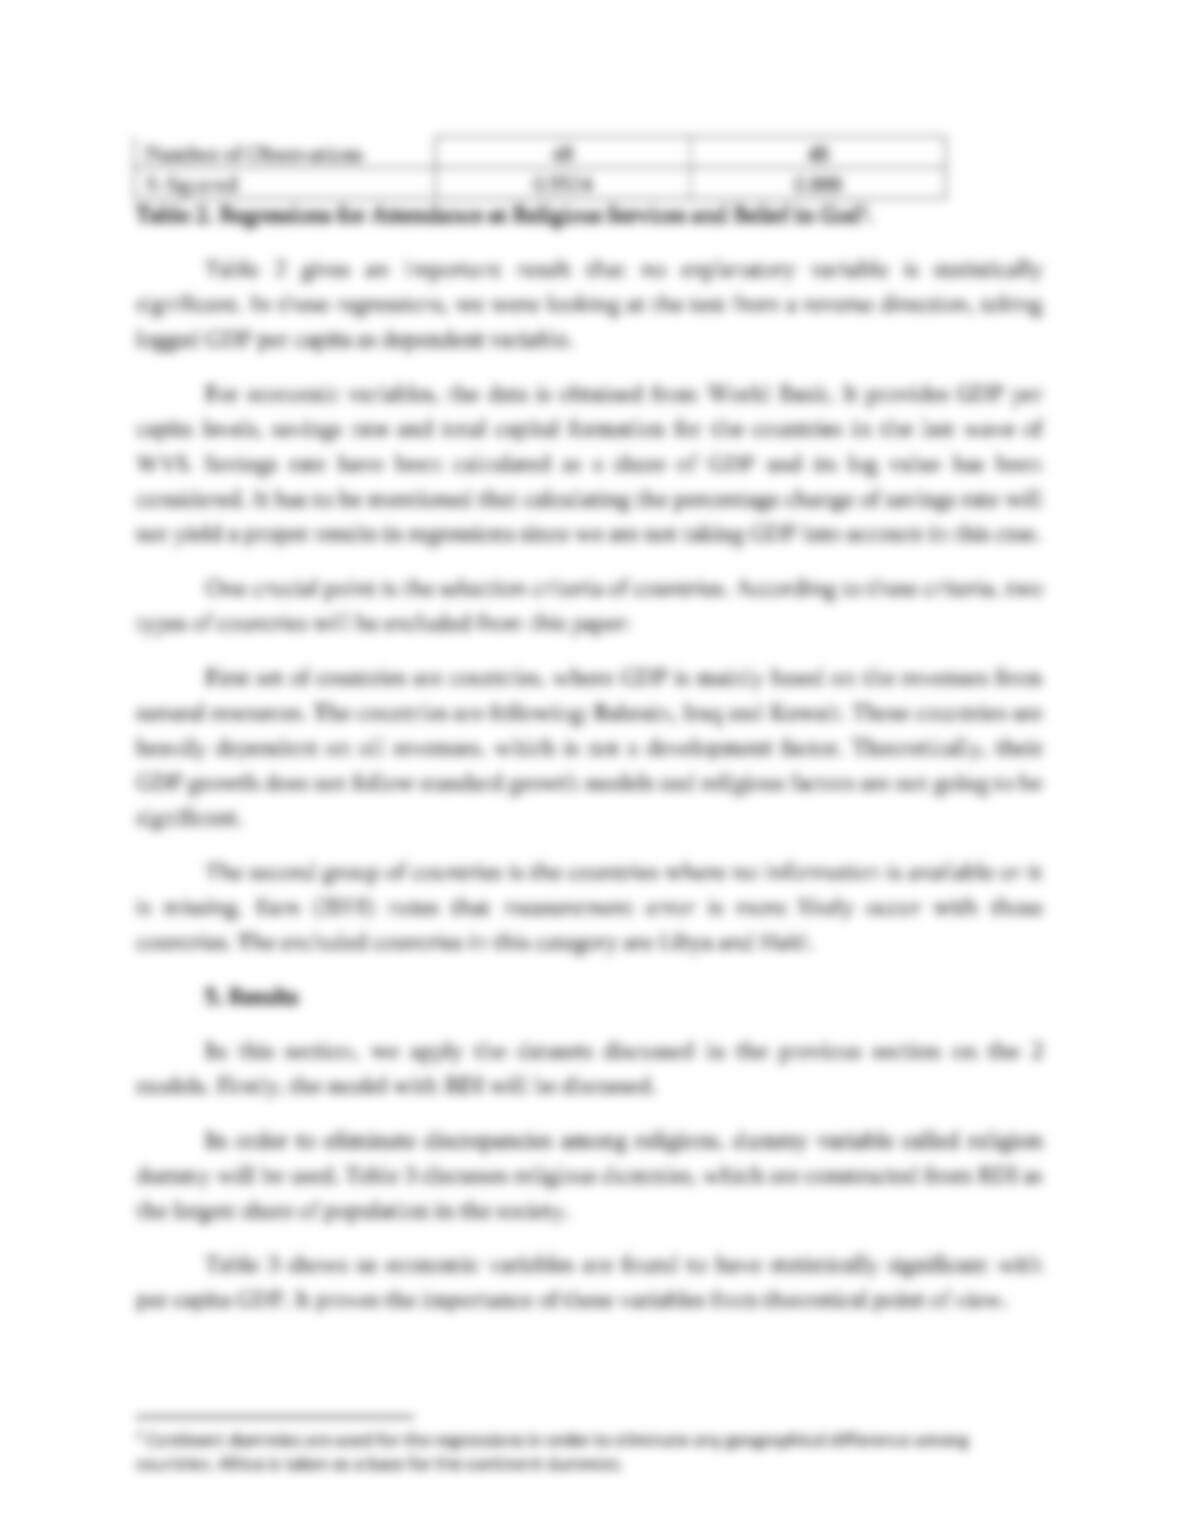
Table 1. Means and Standard Deviations for key variables in the research in religious activity and
beliefs
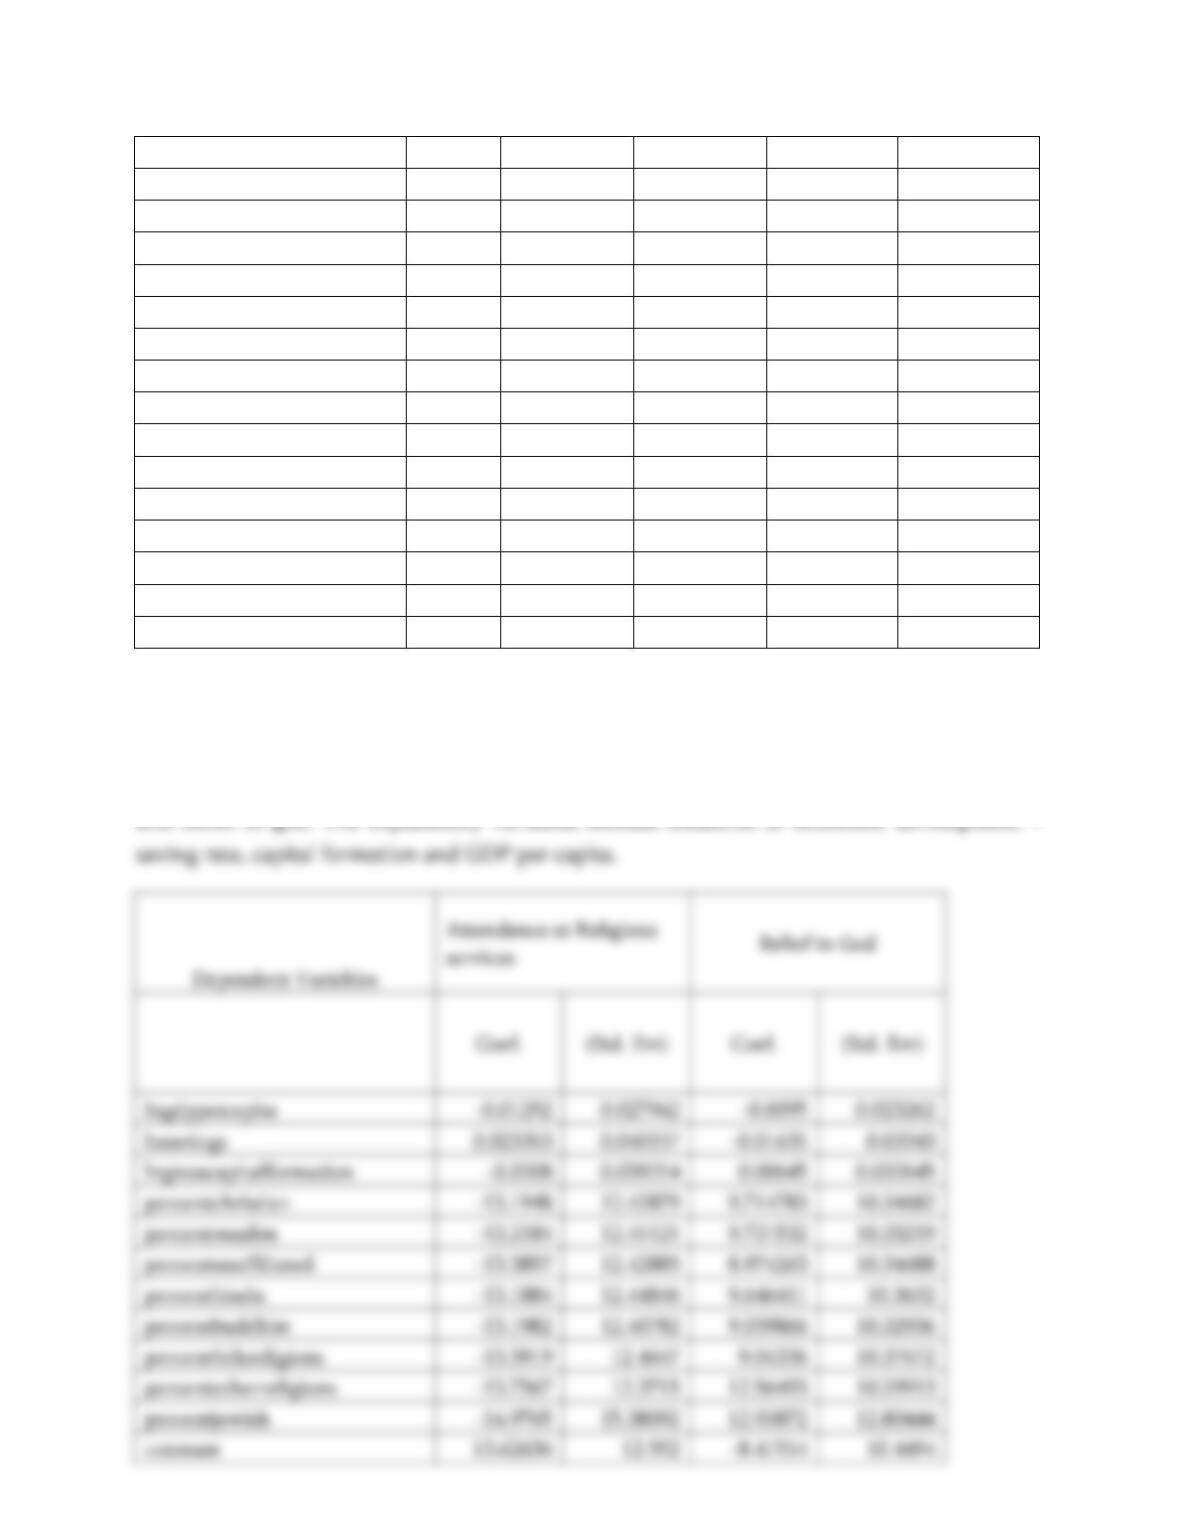
Using the religious adherence data from PRC and the last wave of WVS, Table 2
shows the possible regressions. The dependent variables are attendance at religious services
lnsavings
lngrosscapitalformation
-0.0208
percentchristian
percentmuslim
percentunaffiliated
percenthindu
percentfolkreligions
percentotherreligions
percentjewish
constant