How have changes in wind and temperature impacted Singapore’s climate?
1. Introduction
Climate change, the long-term shifts in temperatures and weather patterns, affects
precipitation intensity and frequency. Decreasing precipitation endangers Singapore’s
water security as droughts undermine reservoirs’ reliability as water sources. Increased
precipitation can cause intense floods, disrupting lives.
Understanding factors influencing Singapore’s climate patterns is crucial to better
protect ourselves. Thus, we investigate how precipitation relates to temperature and
wind speed to find the relationship between climate change and Singapore’s
precipitation levels.
2. Temperature
2.1 Hypothesis
Rising temperatures intensify Earth’s water cycle, increasing evaporation and inducing
more frequent and intense storms (The Earth Observatory, 2010) while contributing to
drying over some land areas. Storm-affected areas face higher precipitation and
flooding risk, while further areas experience less precipitation and increased drought
risk (NASA, n.d.).
The average of models by scientists shows large increases in precipitation near the
equator, particularly in the Pacific Ocean (Hausfather, 2018).
Located at the equator (Rosenberg, 2020), Singapore’s precipitation is higher than
others with more atmospheric moisture. Hence, we hypothesise that Singapore’s
precipitation will increase linearly with increasing global temperature over years.
2.2. Data collection
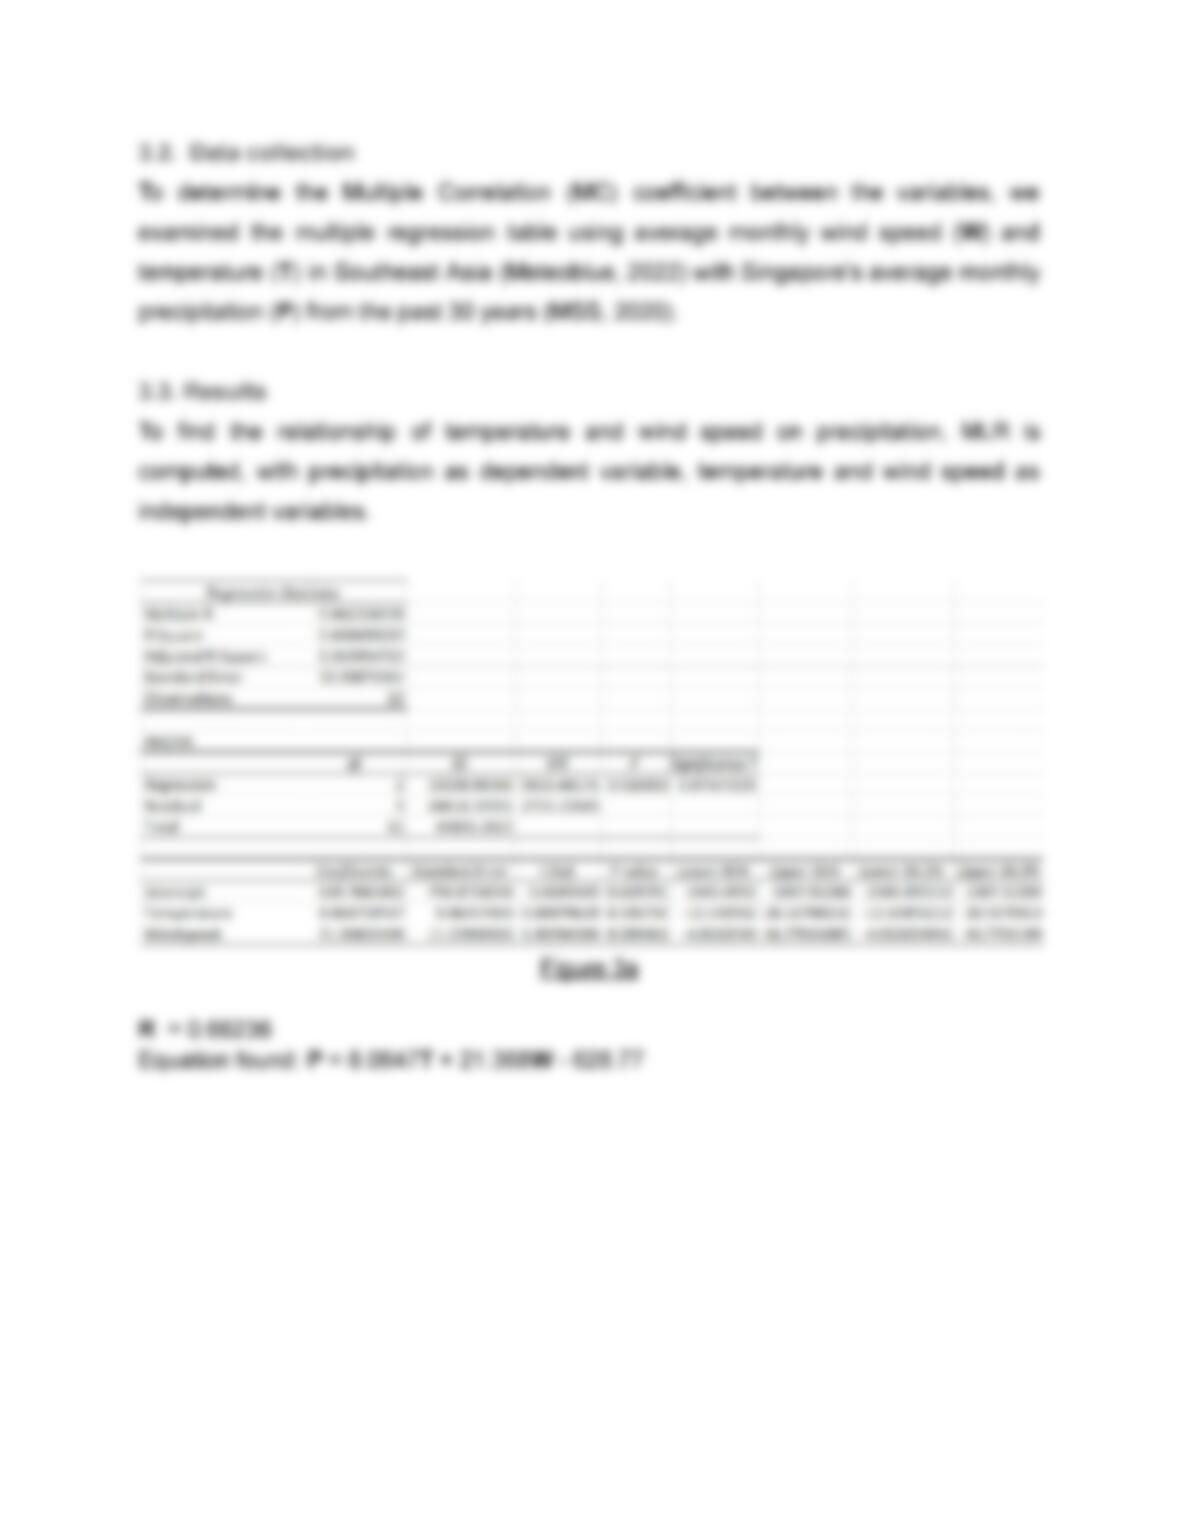
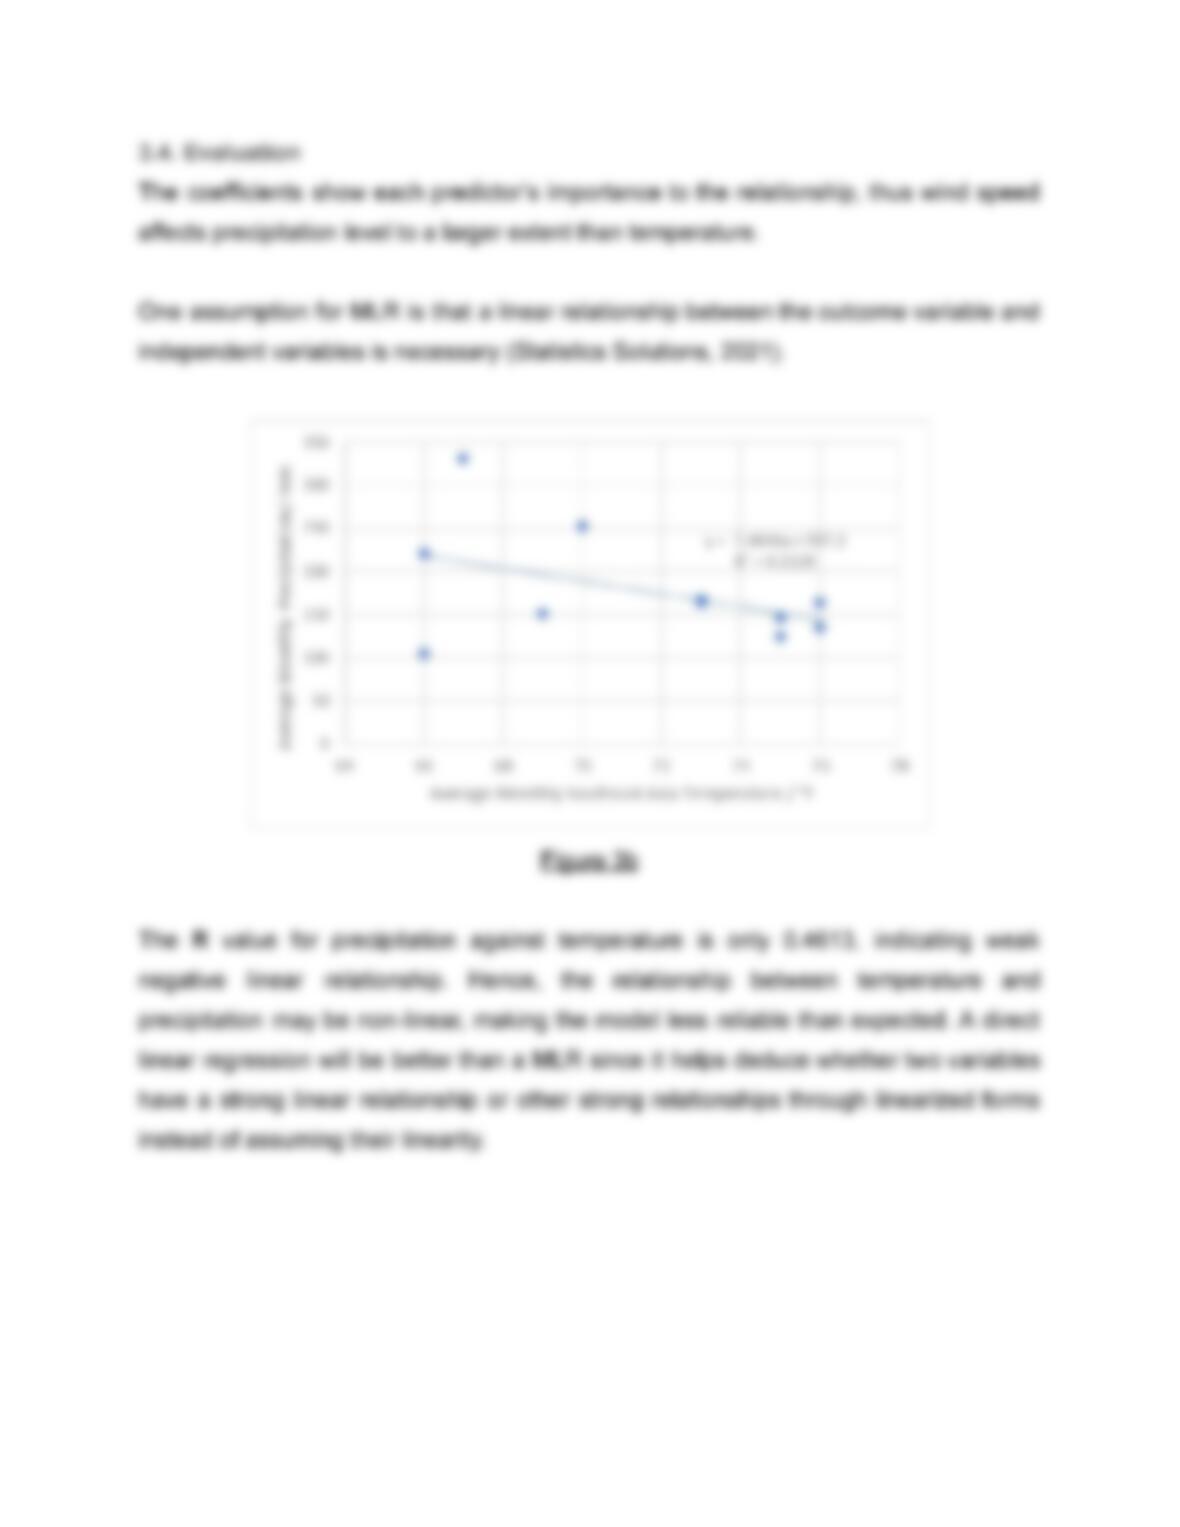
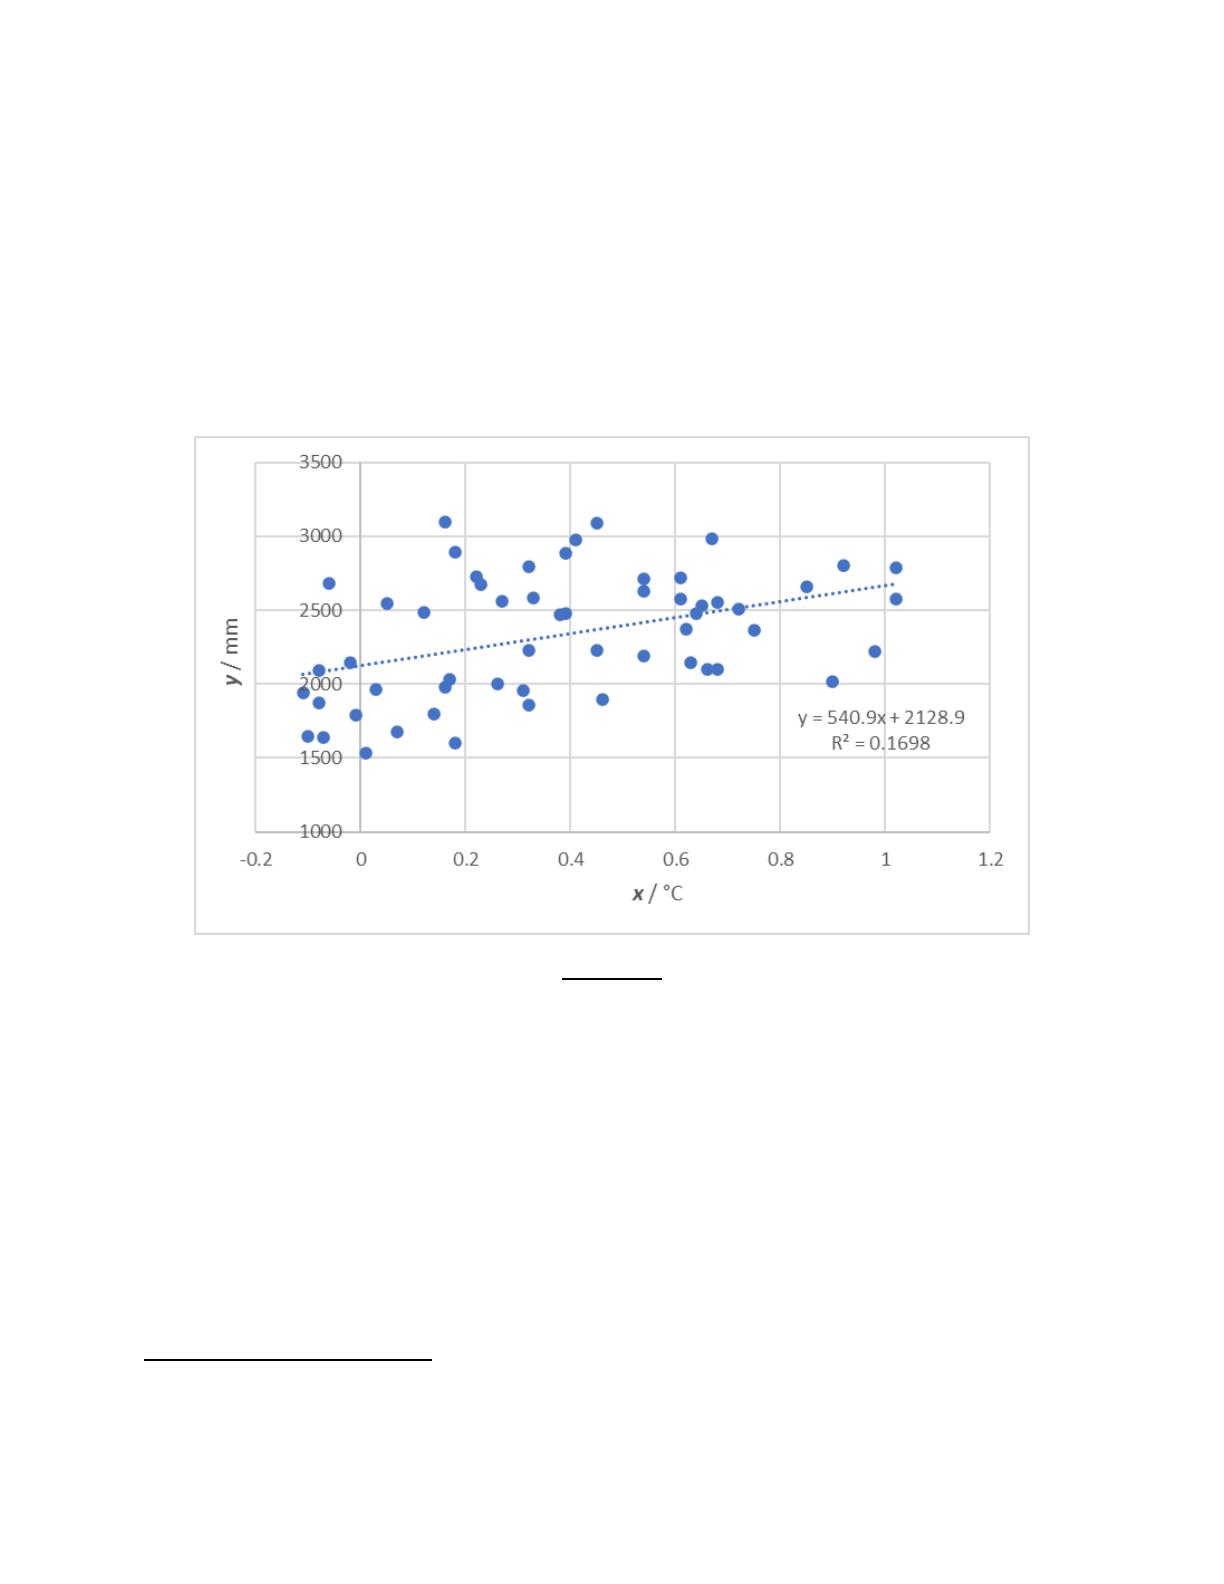
To determine the correlation between global temperature (Change, 2021) and
Singapore’s precipitation levels (World Bank Group, 2021), a scatter diagram is plotted,
with Singapore’s annual precipitation (x) against global temperature annual average
anomaly1for 1965 – 2020 (y).
2.3. Results
Figure 1a
R= 0.41202, showing weak positive linear correlation between the two variables.
1Base period for temperature anomaly is 1951-1980, where the change in global surface temperature is
relative to 1951-1980 average temperatures as per source NASA GISS GLOBAL Land-Ocean
Temperature Index
2.4. Evaluation
Both variables generally increase relative to one another. Assuming constant correlation
between temperature and precipitation over time and space, our hypothesis is
supported. However, the weak linear relationship is somewhat unreliable in predicting
Singapore’s precipitation levels based on global temperature anomalies. Hence, we
explore other linearised forms to obtain a higher Rvalue.
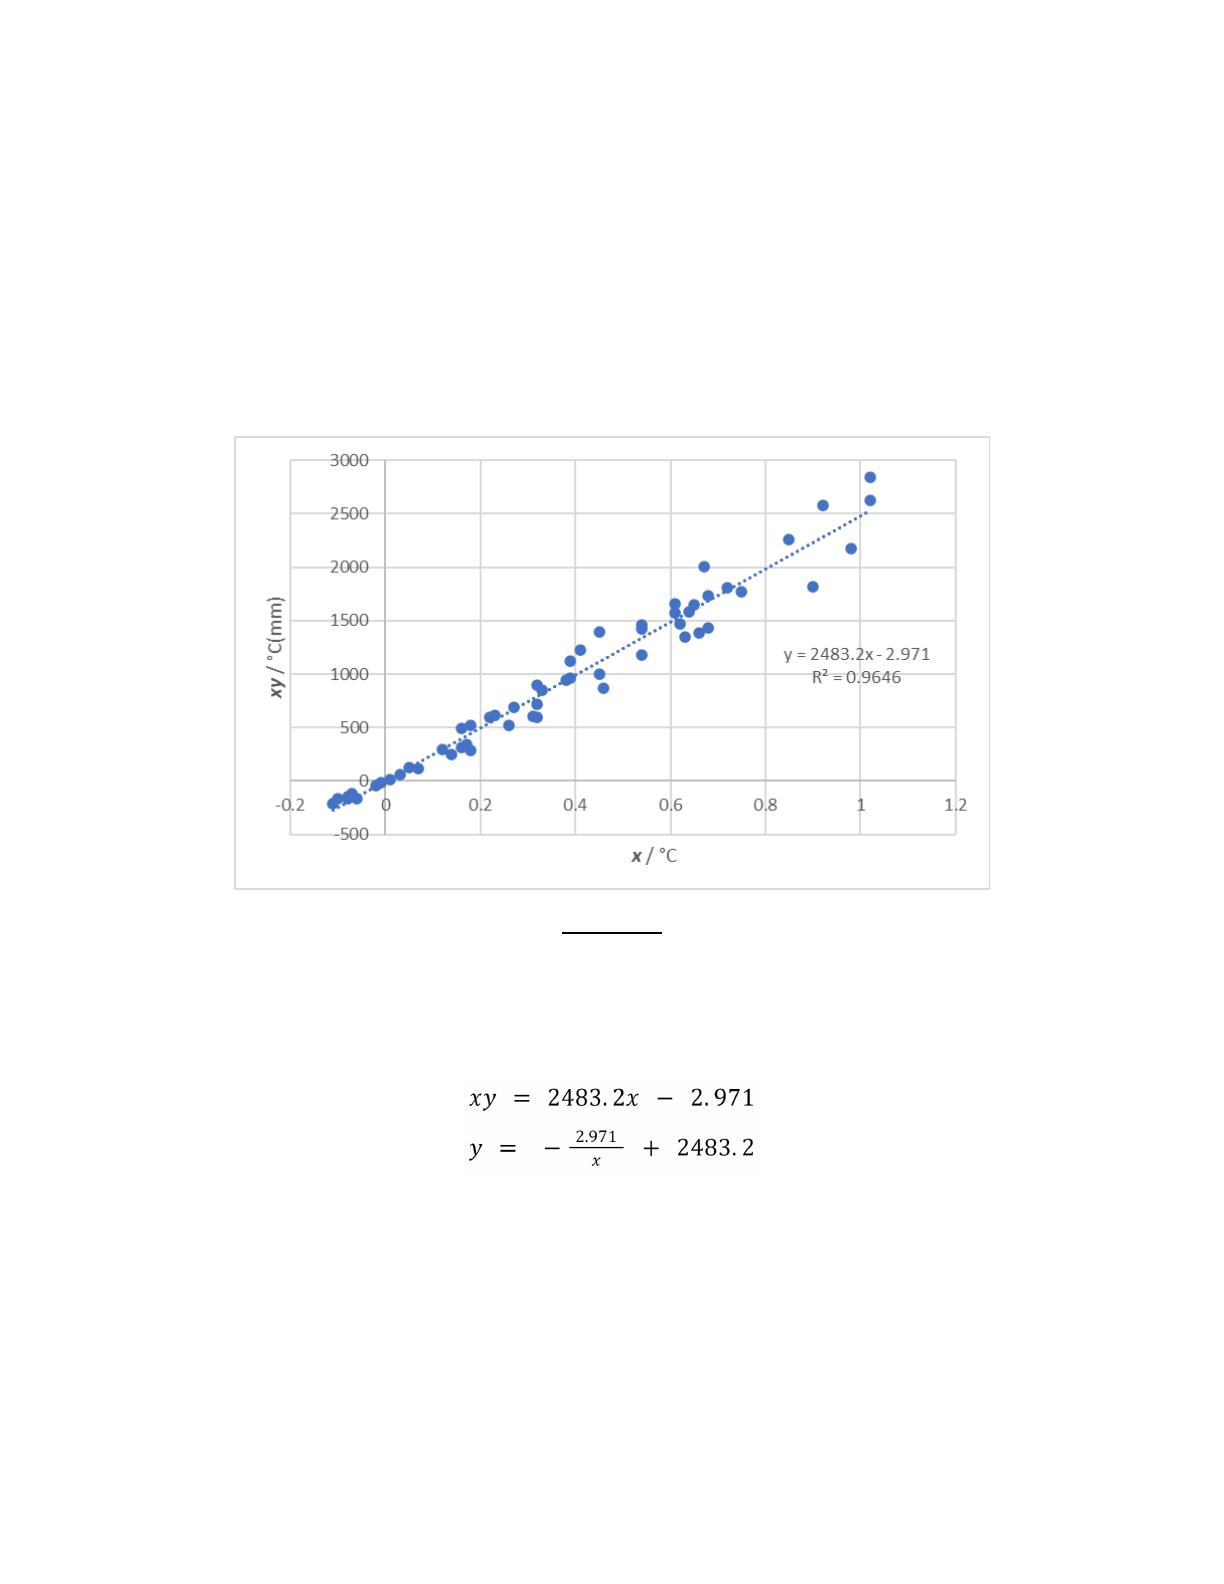
Figure 1b
Plotting xy against xgives a strong positive correlation, indicating strong nonlinear
relationship of xand y. Rearranging the formula:
yis inversely proportional to x, meaning yis more related to –1/x than to x.
However, simple regression can only be fit to data sets with a single dependent variable
and independent variable. Other factors, like wind speed, are also related to
precipitation level. Using multiple regression, we develop a model relating precipitation,
temperature and wind speed.
3. Multiple Linear Regression (MLR)
3.1. Rationale
MLR allows us to assess relationship strength between precipitation, temperature and
wind speed and each variable’s importance to the relationship. (ScienceDirect, 2018)