Savrasov Aleksei, group 181
Homework 3
Final Report
1-2. We just work with file and directory there (see do file),
3. We start our analysis with the dataset inspection.
Contains data from homework3.dta
obs: 969
vars: 14 20 Feb 2015 13:32
size: 26,163 (dta has notes)
Storage display value
variable name type format label variable label
id int %9.0g Identifier of the firm
year int %9.0g Survey year
country byte %8.0g Country identifier
cname str7 %9s Country name
styear int %9.0g Year of establishment
own byte %13.0g lab5 Ownership
industry byte %14.0g lab4 Industry of the firm
employ int %9.0g Full-time employment in the year before survey
export byte %9.0g lab21 Does the firm export?
restr1 byte %9.0g lab22 Developed new product?
grsales float %9.0g Sales growth, S2001/S1998
q14a1 byte %9.0g
q14a2 byte %9.0g
q14a3 byte %9.0g
We see, that in the dataset there are 969 observations for 14 variables. For the most of them there are the
meanings written. Among the data we see the identifiers of firms and surveys; the information about
location, type, industry, etc.
4-5. On this point we have to rename and label the «strange» raw variables q14a1, q14a2 and q14a3. These
variables are dummies and dedicated to the type of sales (percentage).
6. There we have to check the storage type of three variables in data editor and review the type (describe
function) storage display value
variable name type format label variable label
cname str7 %9s Country name
own byte %13.0g lab5 Ownership
industry byte %14.0g lab4 Industry of the firm
We declare that the variable cname has the string storage type, while the variables own and industry are
numeric and have byte type of storage.
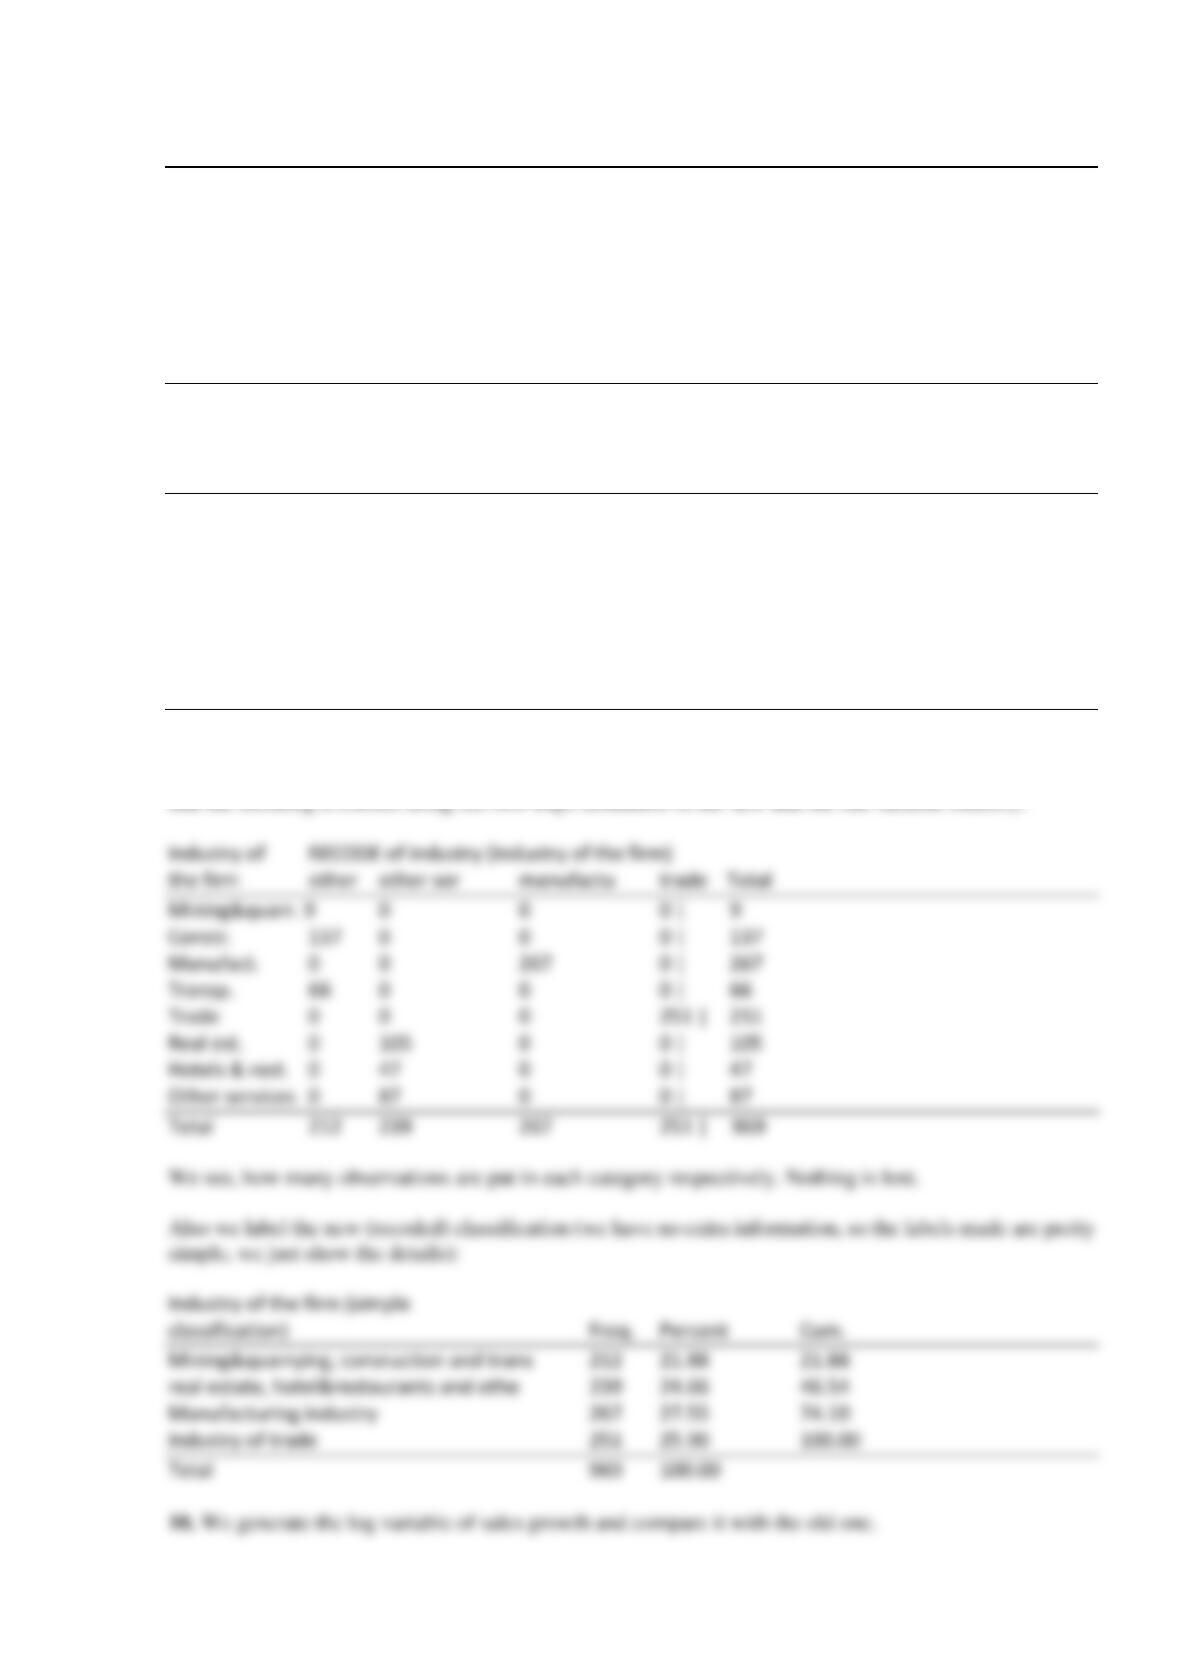
7. We generate frequency tables with labels and numeric codes for the variable industry
Industry of
the firm Freq. Percent Cum.
Mining&quarr. 9 0.93 0.93
Constr. 137 14.14 15.07
Manufact. 267 27.55 42.62
Transp.| 66 6.81 49.43
Trade 251 25.90 75.34
Real est. 105 10.84 86.17
Hotels & rest. 47 4.85 91.02
Other services 87 8.98 100.00
Total 969 100.00
Industry of
the firm Freq. Percent Cum.
1 9 0.93 0.93
2 137 14.14 15.07
3 267 27.55 42.62
4 66 6.81 49.43
5 251 25.90 75.34
6 105 10.84 86.17
7 47 4.85 91.02
8 87 8.98 100.00
Total 969 100.00
8-9. We aggregate several categories of the variable industry and simplify the split. We can easily check,