Pedro Perez
Salil Benegal, PhD
Research Design & Writing
Homework assignment 2
1. It is categorical since there’s groupings you can choose based off your age. Based
on this, I’d say it’s more appropriate to use mode to describe age5 since it will
encompass all groups respective ages as well as giving us the central tendency.
2. Mean: 3.954899
Median: 4
Mode: 5
I calculated these numbers using the command features average, mode, and median
within excel and encompassed all the values in the C column. Essentially, what the
following numbers conclude is that the mean of age5 is within group three which
consists of individuals 40-49 years old. Along with that, the mean also indicates that the
average age of participants was closer to 49 than 40 since 3.954899 is closer to 4 than
it is to 3. On the other hand, the median of age5 is within group four which consists of
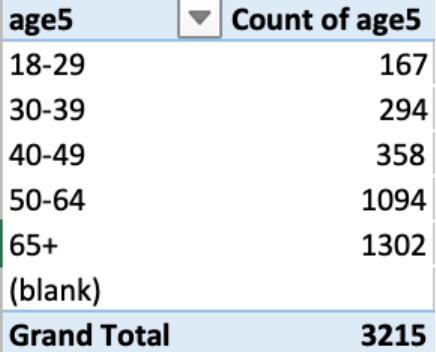
individuals 50-64 years old. Looking at the number of respondents in each age group,
there is a heavy negative skew, meaning most respondents were older. This can be
seen by looking at a pivot table of the counts of respondents (as seen below) or by
looking at a visual representation using a histogram of the data set.
3. Pid3 and Pid7 are variables asking respondents to identify what their respective political
affiliation in a variety of ways. For example, Pid7 is a Likert Scale because it is an ordinal
variable which allow for differences in political affiliation to be made (democrats, moderates,
strong democrats, republicans, strong republicans, etc.). On the other hand, Pid3 is an example
of a categorical variable because there are no meaningful differences when comparing
categories.
The most effective way to evaluate Pid7 would be using median since it will show us
where the middle of the data set is located. This in turn will give us the coded variable
corresponding to the Likert scale. Medians are effective when evaluating Likert scales because