Home Warranties Market: All data gotten from the US Census Bureau and are estimates
Data was only given for people 18 and under but since I’m trying to find the market for people who can
buy a home I took another 5% off every states population to account for the age group of 25 and under
since they’re highly unlikely to buy homes. I had trouble finding reliable numbers on things such as home
ownership rates, people with disability rates (less likely to own homes), and marriage rates. Therefore, I
stopped my calculation at people who are considered old in enough by societies standards to own a home.
18U means 18 and under (same applies to 25U)
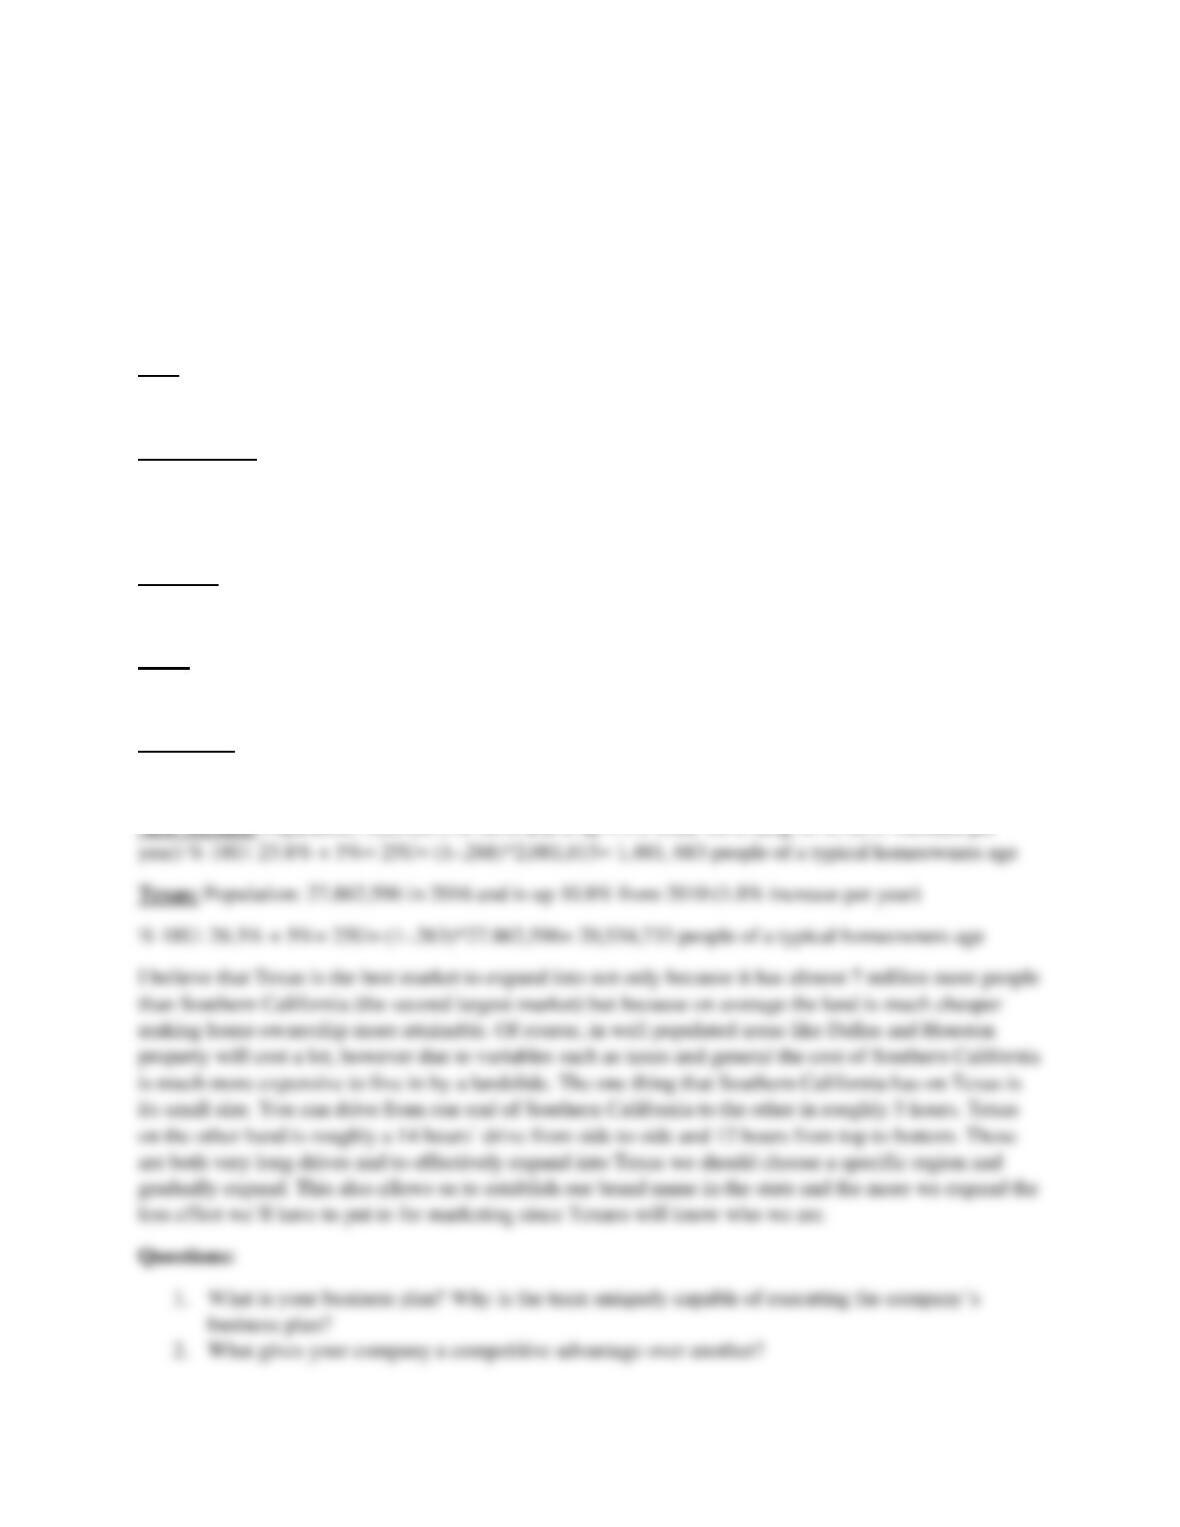
AZ: Population: 6,931,071 in 2016 and is up 8.4% from 2010 (avg. of 1.4% increase per year)
% 18U: 23.8% + 5%= 25U=(1-.288)*6,931,071= 4,934,923 people of a typical homeowners age
Southern CA: I couldn’t find a reliable # for its population so I cut the total population in half
Population: 19,625,009 in 2016 and is up 5.4% since 2010 (avg. of 0.9% increase per year)
% 18U: 23.3% + 5%= 25U= (1-.283)*19,625,009= 14,071,132 people of typical homeowners age
Nevada: Population: 2,940,058 in 2016 and is up 8.9% since 2010 (avg. of 1.48% increase per year)
% 18U: 23.1% + 5%= 25U=(1-.281)%*2,940,058= 2,113,902 people of a typical homeowners age
Utah: Population: 3,051,217 in 2016 and is up 10.4% from 2010 (avg. of 1.73% increase per year)
% 18U: 30.5% + 5%= 25U= (1-.355%)*3,051,217= 1,968,035 people of a typical homeowners age
Colorado: Population: 5,540,545 in 2016 and is up 10.2% since 2010 (avg. of 1.7% increase per year)
% 18U: 23% + 5%= 25U= (1-.28)*5,540,545= 3,989,192 people of a typical homeowners age