Please see General Disclaimers on the last page of this report.
Current Environment ……………………………………………………………………………….. 1
Industry Profile ………………………………………………………………………………………. 13
Industry Trends ……………………………………………………………………………………… 14
How the Industry Operates ……………………………………………………………………. 23
Key Industry Ratios and Statistics …………………………………………………………. 27
How to Analyze a Homebuilding Company ……………………………………………. 31
Glossary …………………………………………………………………………………………………. 38
Industry References ………………………………………………………………………………. 39
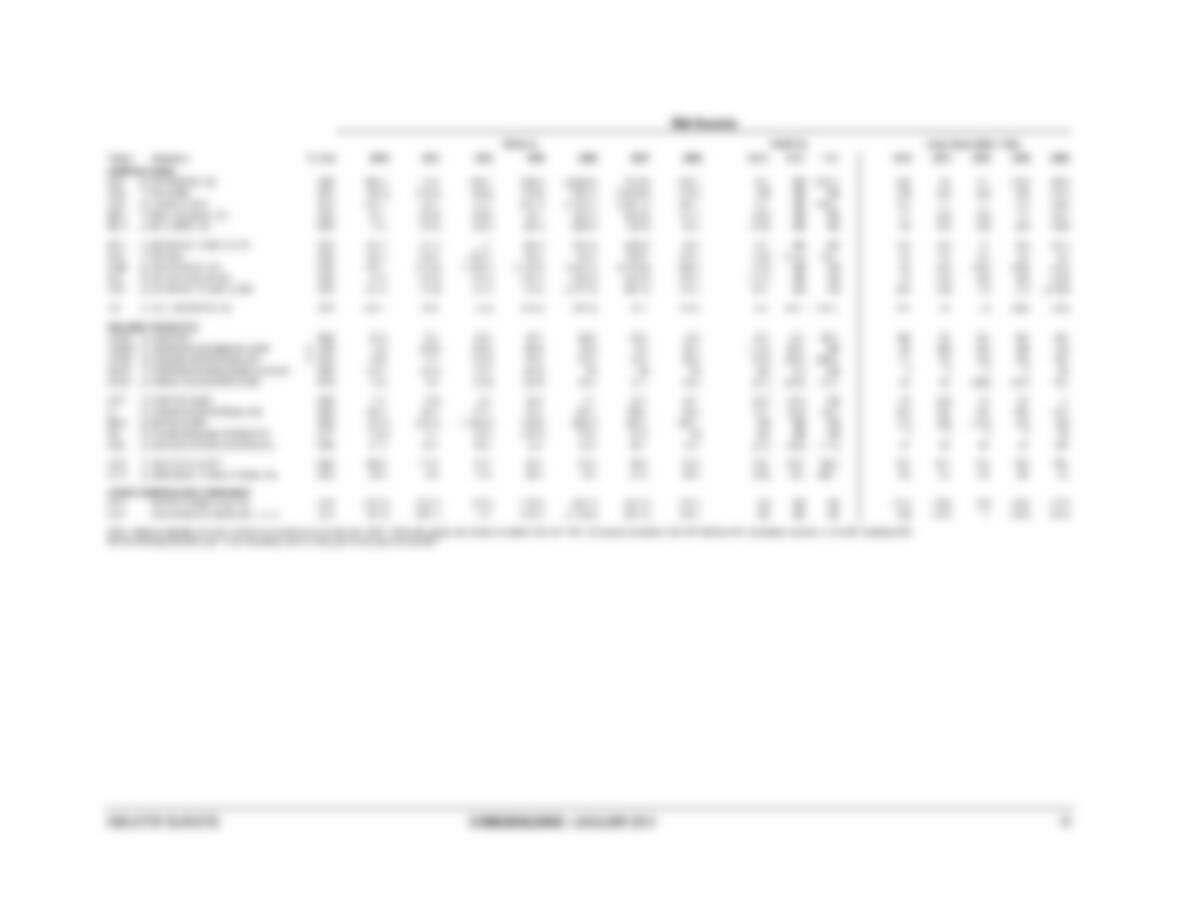
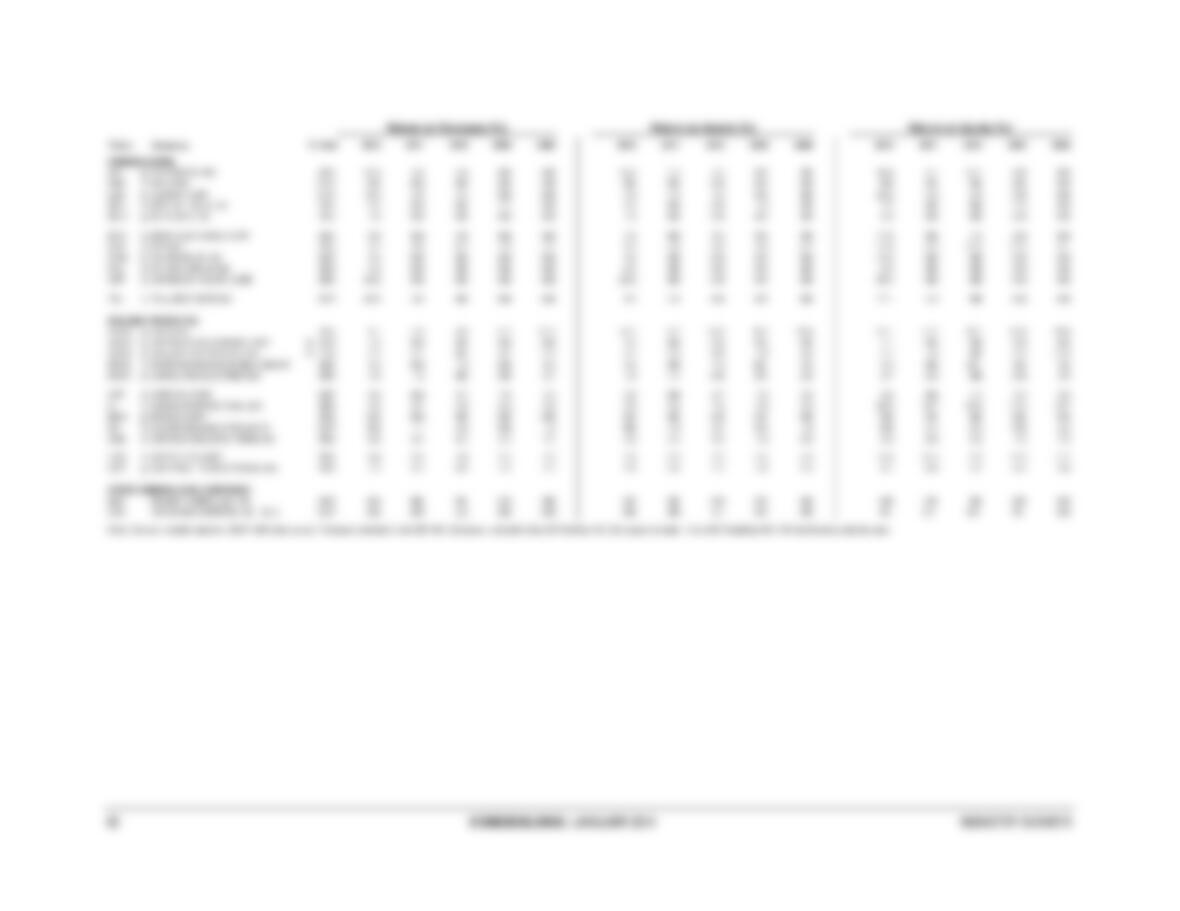
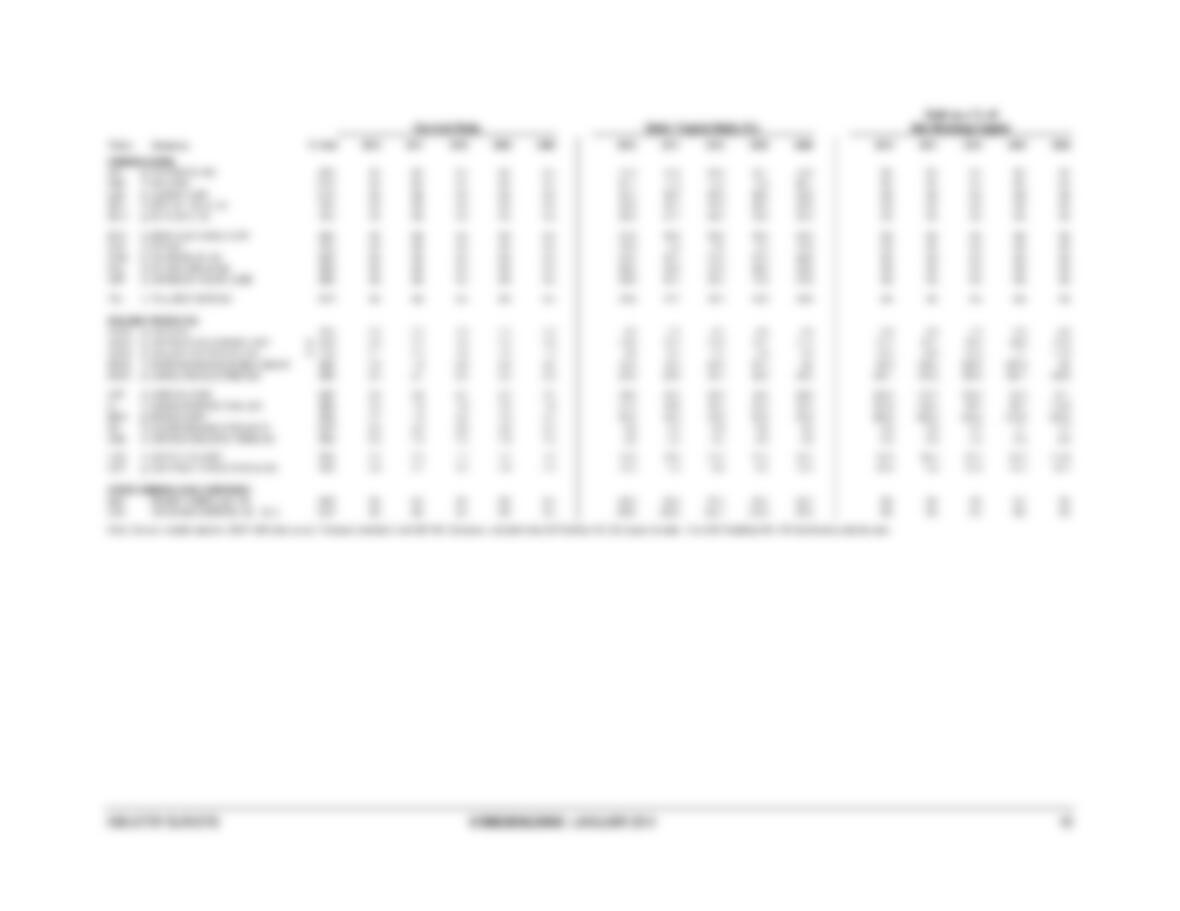
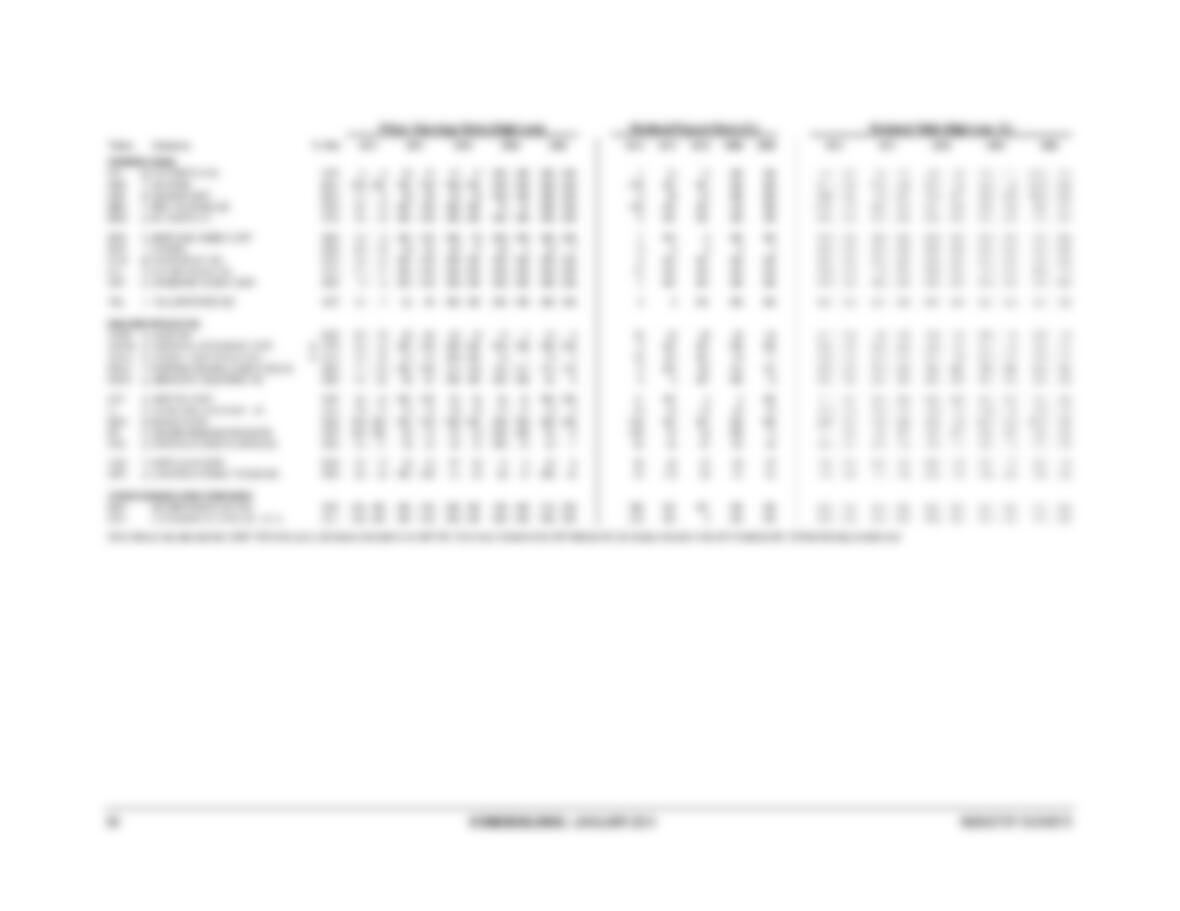
Comparative Company Analysis ……………………………………………………………. 40
This issue updates the one dated July 2013.
The next update of this Survey is scheduled for July 2014.
Industry Surveys
Homebuilding
Michael Souers, Homebuilders Equity Analyst
JANUARY 2014
CONTACTS:
INQUIRIES & CLIENT RELATIONS
800.852.1641
clientrelations@
standardandpoors.com
SALES
877.219.1247
wealth@spcapitaliq.com
MEDIA
Marc Eiger
212.438.1280
marc.eiger@spcapitaliq.com
S&P CAPITAL IQ
55 Water Street
New York, NY 10041

Topics Covered by Industry Surveys
Aeros
p
ace & De
f
ense
Airlines
Alcoholic Beverages & Tobacco
Apparel & Footwear:
Retailers & Brands
Autos & Auto Parts
Banking
Biotechnology
Broadcasting, Cable & Satellite
Chemicals
Communications Equipment
Computers: Commercial Services
Computers: Consumer Services &
the Internet
Computers: Hardware
Computers: Software
Electric Utilities
Environmental & Waste Management
Financial Services: Diversi
f
ie
d
Foods & Nonalcoholic Beverages
Healthcare: Facilities
Healthcare: Life Sciences
Tools & Services
Healthcare: Managed Care
Healthcare: Pharmaceuticals
Healthcare: Products & Supplies
Heavy Equipment & Trucks
Homebuilding
Household Durables
Household Nondurables
Industrial Machinery
Insurance: Life & Health
Insurance: Property-Casualty
Investment Services
Lodging & Gaming
Metals: Industrial
Movies & Entertainment
Natural Gas Distribution
Oil & Gas: Equipment & Services
Oil & Gas: Production & Marketing
Paper & Forest Products
Publishing & Advertising
Real Estate Investment Trusts
Restaurants
Retailing: General
Retailing: Specialty
Semiconductor Equipment
Semiconductors
Supermarkets & Drugstores
Telecommunications: Wireless
Telecommunications: Wireline
Thrifts & Mortgage Finance
Transportation: Commercial
Global Industry Surveys
Airlines: Asia
Autos & Auto Parts: Europe
Banking: Europe
Food Retail: Europe
Foods & Bevera
g
es: Euro
p
e
Media: Europe
Oil & Gas: Europe
Pharmaceuticals: Euro
p
e
Telecommunications: Asia
Telecommunications: Europe
S&P Capital IQ Industry Surveys
55 Water Street, New York, NY 10041
EXECUTIVE EDITOR: EILEEN M. BOSSONG-MARTINES ASSOCIATE EDITOR: CHARLES MACVEIGH STATISTICIAN: SALLY KATHRYN NUTTALL
CLIENT SUPPORT: 1-800-523-4534.
VISIT THE S&P CAPITAL IQ WEBSITE: www.spcapitaliq.com
S&P CAPITAL IQ INDUSTRY SURVEYS (ISSN 0196-4666) is published weekly. Redistribution or reproduction in whole or in part (including inputting into a
computer) is prohibited without written permission. To learn more about Industry Surveys and the S&P Capital IQ product offering, please contact our Product
Specialist team at 1-877-219-1247 or visit getmarketscope.com. Executive and Editorial Office: S&P Capital IQ, 55 Water Street, New York, NY 10041. Officers of
McGraw Hill Financial: Douglas L. Peterson, President, and CEO; Jack F. Callahan, Jr., Executive Vice President, Chief Financial Officer; John Berisford, Executive
Vice President, Human Resources; D. Edward Smyth, Executive Vice President, Corporate Affairs; Charles L. Teschner, Jr., Executive Vice President, Global
Strategy; and Kenneth M. Vittor, Executive Vice President and General Counsel. Information has been obtained by S&P Capital IQ INDUSTRY SURVEYS from
sources believed to be reliable. However, because of the possibility of human or mechanical error by our sources, INDUSTRY SURVEYS, or others, INDUSTRY
SURVEYS does not guarantee the accuracy, adequacy, or completeness of any information and is not responsible for any errors or omissions or for the results
obtained from the use of such information.
Copyright © 2014 Standard & Poor’s Financial Services LLC, a part of McGraw Hill Financial. All rights reserved.
STANDARD & POOR’S, S&P, S&P 500, S&P MIDCAP 400, S&P SMALLCAP 600, and S&P EUROPE 350 are registered trademarks of Standard & Poor’s Financial
Services LLC. S&P CAPITAL IQ is a trademark of Standard & Poor’s Financial Services LLC.

INDUSTRY SURVEYS HOMEBUILDING / JANUARY 2014 1
CURRENT ENVIRONMENT
Housing on the mend
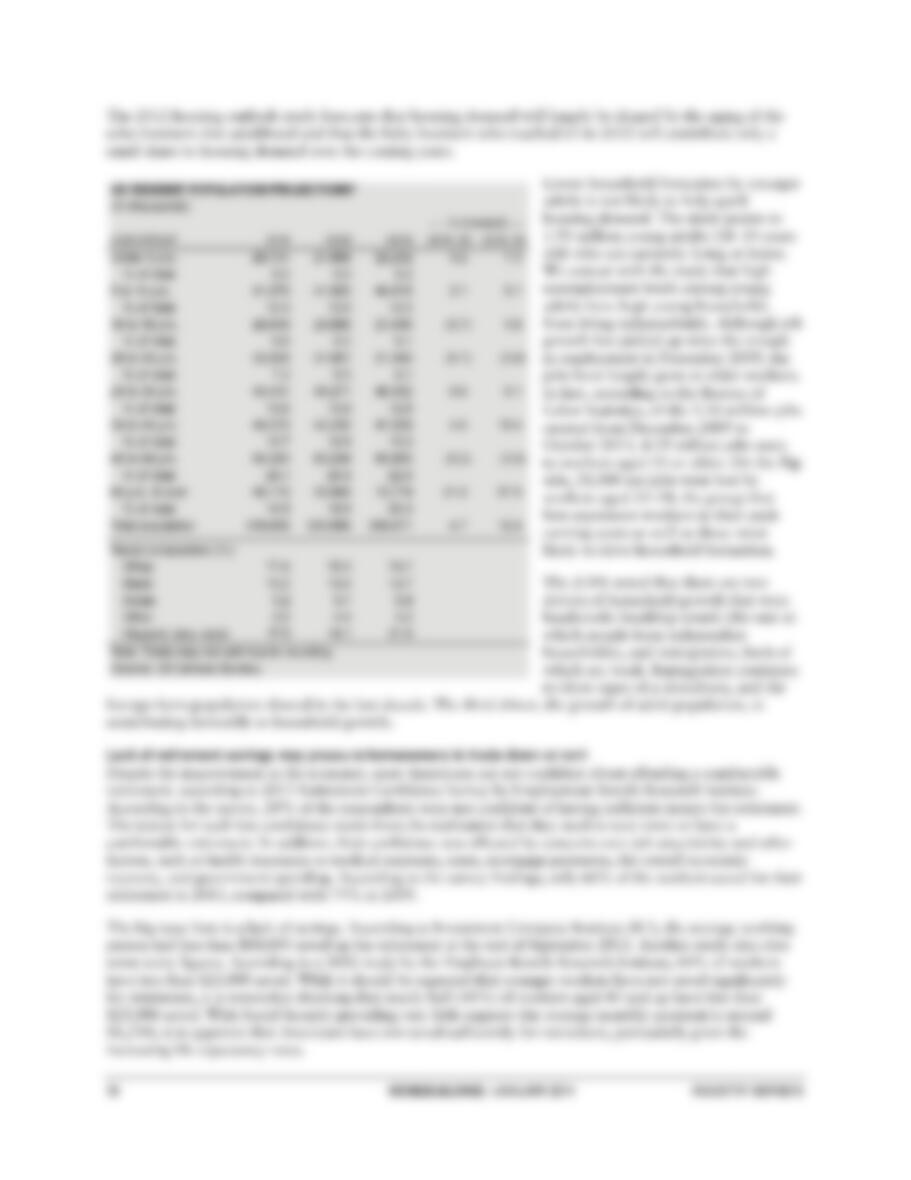
The US housing market continued its recovery in 2013 after improving sharply in 2012, although it remains
weak when measured against historical averages. While the demand for multifamily homes (mostly used for
rental properties) has continued to lead the recovery, as it has over the past couple of years, demand for
single-family homes also continued to increase after rebounding sharply in 2012. Contributing to this was a
pickup in investment demand for housing, along with a dwindling amount of supply as foreclosures continue
their steady, modest decline. Prices have also continued rising into 2013, and look poised for another strong
yearly gain. That said, through September 2013, prices remained approximately 20% below their June 2006
peak. We expect the housing market to continue its recovery in 2014, but we expect the pace of improvement
to decelerate from 2013 levels. In addition, we think the recovery will be rather choppy.
We think that beyond the normal seasonal pattern for residential sales lie several challenging issues: a tight
lending market; foreclosed homes up for resale; and the hard-to-quantify shadow inventory of both bank-
owned unsold homes and underwater mortgages (i.e., mortgages that exceed their homes’ values) that might
lead to foreclosure or short sale. While we believe the publicly traded homebuilders have strong balance sheets
with ample liquidity, the rapid rise of land prices has many homebuilders remaining hesitant about
aggressively pursuing land acquisitions for new communities without seeing stronger signs of a sustainable
recovery.
Boosted by record affordability levels as a result of the actions taken by the US Federal Reserve to lower
interest rates, the S&P/Case-Shiller US 20-City Composite Home Price Index, which tracks the change in
housing prices of 20 major metropolitan areas, turned positive in June 2012. Year to date through
September 2013, the S&P/Case-Shiller US 20-City Composite Home Price Index was up 13.3% year-over-
year. The US Federal Housing Finance Agency (FHFA), an agency within the US Department of Housing
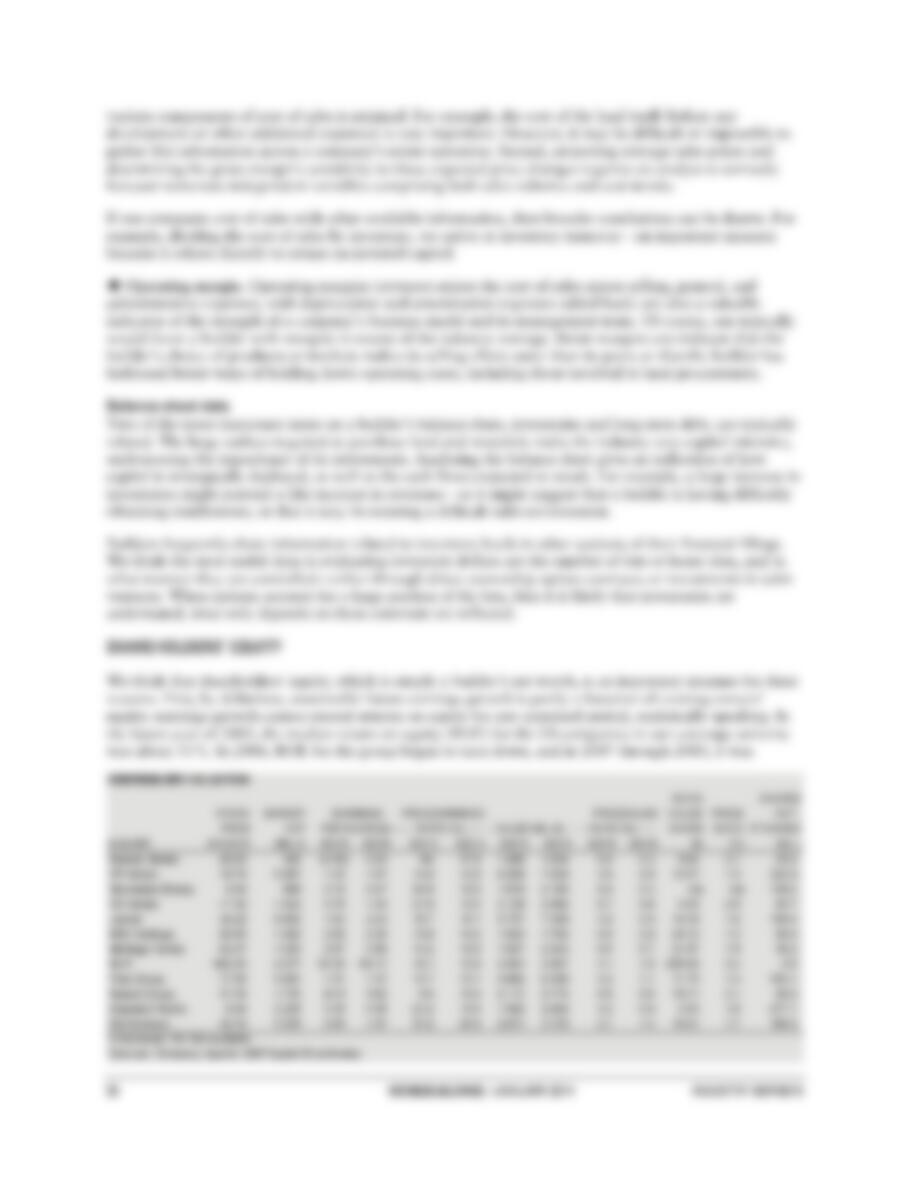
Table B14: MONTHLY
HOUSING INDUSTRY
STATISTICS
M ONT HL Y HOUSING INDUSTRY STATISTICS
—- 2012-13 RANGE —- LATEST
STATISTIC AND SOURCE HIGH LOW READING METHODOLOGY PROBLEMS OR LIMITATIONS
HOUSING STARTS
1,005,000 707,000 Aug. ’13 Seasonally adjusted annual rate. Start The seasonally adjusted annual rate varies
US Census Bureau 891,000 of construction is defined as the beginning sharply from month to month, especially in
US Dept. of Commerce of excavation f or the foundation of the the w inter, w hen actual starts are few er,
Released: Third Tuesday building. Based on a sample of the 17,000 because the multiplication factor is greater.
of follow ing month permit-issuing places in the United States. Excludes mobile homes and conversion
or rehabilitation of existing structures.
BUILDING PERMITS
1,005,000 714,000 Aug. ’13 Seasonally adjusted annual rate. Permits are generally a leading indicator of
US Census Bureau 926,000 Permits are issued in areas covering housing starts. How ever, not all permits are
US Dept. of Commerce approximately 92% of all US housing used, and a long time may elapse betw een
Released: Third Tuesday construction. permit issuance and completion of
of follow ing month construction.
NEW SINGLE– FAMILY
458,000 338,000 Aug. ’13 Seasonally adjusted annual rate. Based on Month-to-month changes are sometimes
HOME SALES
421,000 an estimate of the actual number of new irregular, but less so than for those of
US Census Bureau homes sold during the month. A sale is housing starts and building permits.
US Dept. of Commerce assumed to occur w hen a buyer signs a Excludes mobile home sales. Sales are
Released: 4-5 w eeks contract or makes a deposit. often a leading indicator of future building
after end of month permits and housing starts.
AVG. NEW- HOME PRICE
$337,000 $265,700 Aug. ’13 The prices of homes included in the sample Indicates not only the direction or actual
Fed. Home Loan Bank Bd. $318,900 are totaled and divided by the number of level of home prices, but also the mix of
Released: First Tuesday homes to arrive at a simple average. homes sold. When luxury homes are selling
of follow ing month w ell, it rises quickly; and w hen low er-cost
home sales predominate, it falls sharply.
MEDIAN P RICE
$279,300 $221,700 Aug. ’13 This statistic is derived from a nationw ide This gives a better indication of the
OF A NEW HOME
$254,600 sample of home prices. direction and level of home prices in
US Dept. of Commerc e general. No real “national” home market
Released: 1-month lag exists, how ever; home prices vary
dramatically from one part of the country to
the next.

2 HOMEBUILDING / JANUARY 2014 INDUSTRY SURVEYS
and Urban Development, tracks only the prices of homes backed by mortgages sold or guaranteed by the
Federal National Mortgage Association (Fannie Mae) and Federal Home Loan Mortgage Corp. (Freddie
Mac), and excludes new-home sales. In the third quarter of 2013, the FHFA’s house price index improved
8.4%, year over year, marking the ninth straight quarter of positive changes in home prices after 20 straight
quarterly declines.
MACROECONOMIC CHALLENGES
Despite the fact that the housing market is recovering from recent lows, the US continues to face various
challenges at the macroeconomic level, including high unemployment, significant shadow inventory of
homes, consumers’ limited access to capital from mortgage lenders, and psychological factors.
Unemployment remains high
In October 2013, nonfarm payroll growth accelerated from the previous month, adding 204,000 new jobs
(versus 163,000 in September). However, this pace of job growth is only about what is needed to keep up
with population growth. The private sector added 212,000 new jobs in October 2013, with continued growth
in professional and business services, leisure and hospitality sectors, manufacturing and healthcare services,
and retail trade sectors. Over the past 12 months, payroll growth has averaged 194,000 per month. While
this growth is solid, it is still shy of what would be expected during an economic growth cycle. In our
opinion, a sustained recovery in housing cannot occur without stronger improvement in the labor force.
The unemployment rate increased marginally to 7.3% for October 2013 from 7.2% in the prior month,
largely attributable to the federal government’s partial shutdown. On a year-over-year basis, the
unemployment rate has fallen from the 7.9% rate in October 2012. However, in our view, this decline in
the unemployment rate has much more to do with people completely dropping out of the labor force (about
3.1 million over the past year) than it does with any meaningful improvement in the job market. To better
illustrate this, we note that the labor force participation rate fell to 62.8% in October 2013, the lowest rate
in 35 years (from 63.8% in October 2012), while the employment-to-population ratio dropped to 58.3%
(from 58.7% last October). These ratios are at levels not seen since the early 1980s, when single-income
families were far more prevalent. We think these metrics more accurately reflect the health of the labor force
than does the official U-3 unemployment rate. As of December 2013, Standard & Poor’s Economics (which
operates separately from S&P Capital IQ) was projecting a 7.5% unemployment rate for 2013 after an
8.1% average rate in 2012. For 2014, it expected the unemployment rate to decline to 6.9%.
Recent job growth is not constructive for household formation
We believe the key to a sustainable housing recovery is household formation. Population growth can
certainly help household formation, but is likely to average only 1% annually, the average over the past
decade. Therefore, in our opinion, the key to household formation lies with the labor market, as quality
jobs will give more people the ability to afford new homes.
In terms of job growth, things look fairly good to us on the surface. Since the trough of the labor market in
December 2009, approximately 5.5 million jobs have been created through October 2013. However, as
discussed earlier, though the official unemployment rate has dropped from its October 2009 peak, much of
the improvement has come from people dropping out of the labor force. Making matters worse is that the
quality of jobs has been poor and not conducive to increased household formation.
Some of that weakness is reflected in wage growth, which has averaged only about 2% since late 2009. Of
greater concern is that the jobs created have been part-time jobs, as companies remain reluctant to hire full-
time staff. In fact, nearly 60% of the jobs created since the trough of the labor market pay less than $14 per
hour. Another statistic that we found to be extremely representative of the poor job quality is that all of the
5.5 million jobs created between December 2009 and October 2013 have gone either to workers aged 16–
24 or to those aged 55 and older (there are net 21,000 fewer workers in the 25–54 age range). Given the
makeup of the labor force in this country, with nearly two-thirds of workers in the 25–54 age cohort, the
amount of new job creation in the young and older cohorts is even more peculiar. Regardless of the reasons
behind this, job growth remains weak for the age cohort (25–54) that typically drives new housing demand.

INDUSTRY SURVEYS HOMEBUILDING / JANUARY 2014 3
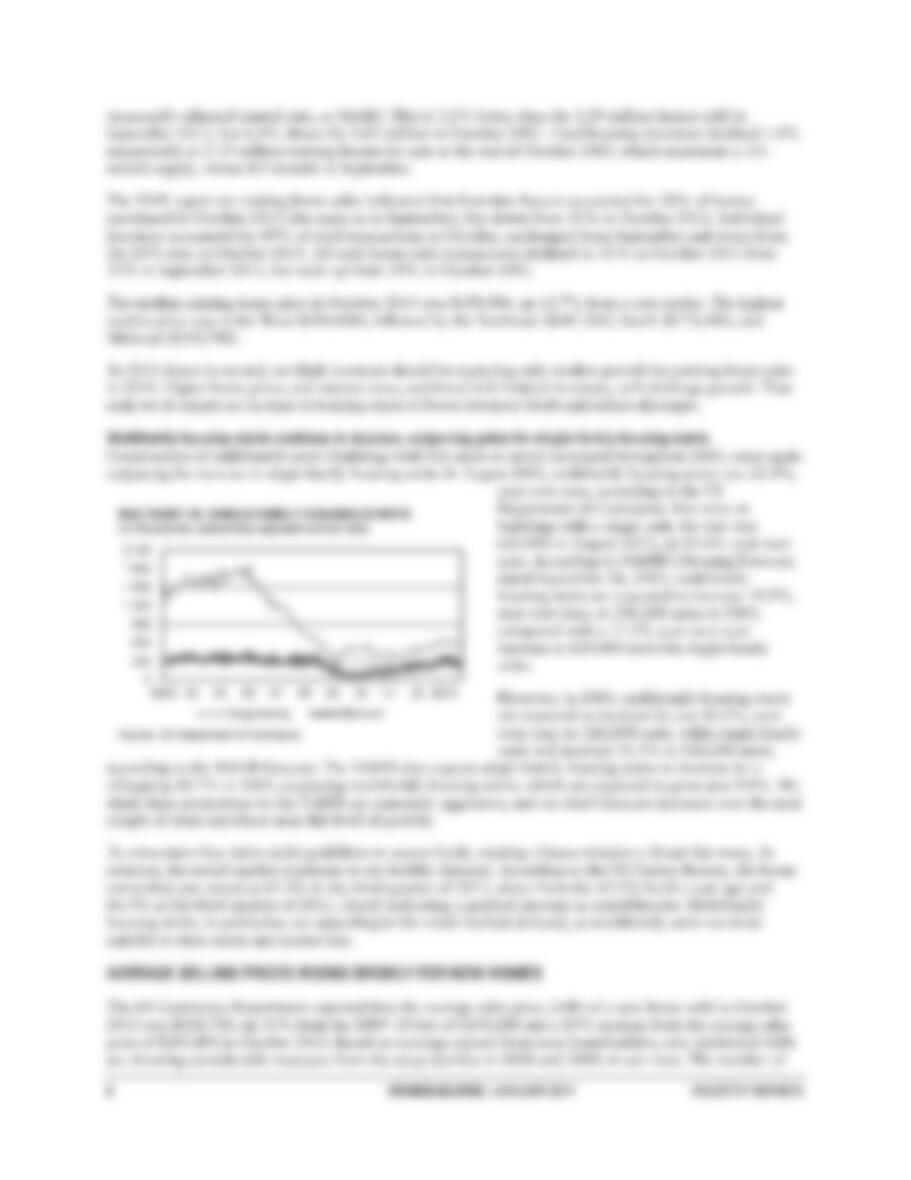
“Shadow” inventory and foreclosure concerns
The inventory of existing homes for sale in October 2013 declined 1.8% sequentially to 2.13 million, which
represented a 5.0-month supply at the existing sales pace, up from the 4.9-month supply in September,
according to the National Association of Realtors (NAR). The months of supply has fallen considerably
from the 9.5 months reported in June 2011 and has been declining from a recent peak of 11.0 months in
November 2008, a level that hadn’t been seen since 1982’s all-time record of 11.5 months. In each year
from 2000 to 2005, inventories of existing homes for sale averaged less than 5.0 months’ supply. (The
“normal” level is considered to be about six months of supply.) By this measure, it would appear that
supply is extremely constricted and that further house price appreciation is very likely. However, that might
not necessarily be the case.
Despite this decline, the number of months’ supply does not take into account the “shadow” inventory that
banks are holding on their books. [Shadow inventory is defined as real estate owned by banks and mortgage
companies due to foreclosures and other actions (such as deeds in lieu of foreclosure), as well as real estate
that is at least 90 days delinquent.] According to the latest available data from CoreLogic, a market and
business research company, the shadow inventory stood at 1.9 million homes as of July 2013 (which equals
about 3.7 months’ supply). The 1.9 million figure included 874,000 seriously delinquent units and 661,000
in some stage of foreclosure, with the remaining 318,000 units being real estate owned (REO) by lenders.
While the shadow inventory is down 22% from the 2.4 million units in July 2012, it remains approximately
five times the amount of inventory at the peak of the housing bubble in mid-2006. CoreLogic postulates
that shadow inventory of over one month’s supply remains an obstacle to the improving housing markets as
it exerts downward pressure on prices. In addition, if we count homeowners who are 30 days or more
delinquent on their mortgage payment, the numbers rise further. According to Lender Processing Services, a
leading provider of mortgage and consumer loan processing services, 4.4 million mortgages were 30 or
more days delinquent or in foreclosure as of October 2013.
Foreclosures in 2013 continued with the declining trend seen in 2011 and 2012, according to RealtyTrac, a
web-based firm that tracks and markets foreclosed homes. In October 2013, foreclosure filings were reported
on 133,919 properties, a 2% increase from September 2013, but a 28% drop from October 2012. In 2012,
foreclosure filings totaled 2,304,941 on 1,836,634 properties, a 3% decline from filings in 2011, and a 36%
decline from the peak of 2.9 million filings set in 2010. We expect foreclosure activity to flatten out in late
2013 before resuming a gradual decline in 2014, with improving home prices and job growth offsetting
some of the foreclosure backlog in judicial states (as discussed in more detail later in this section).
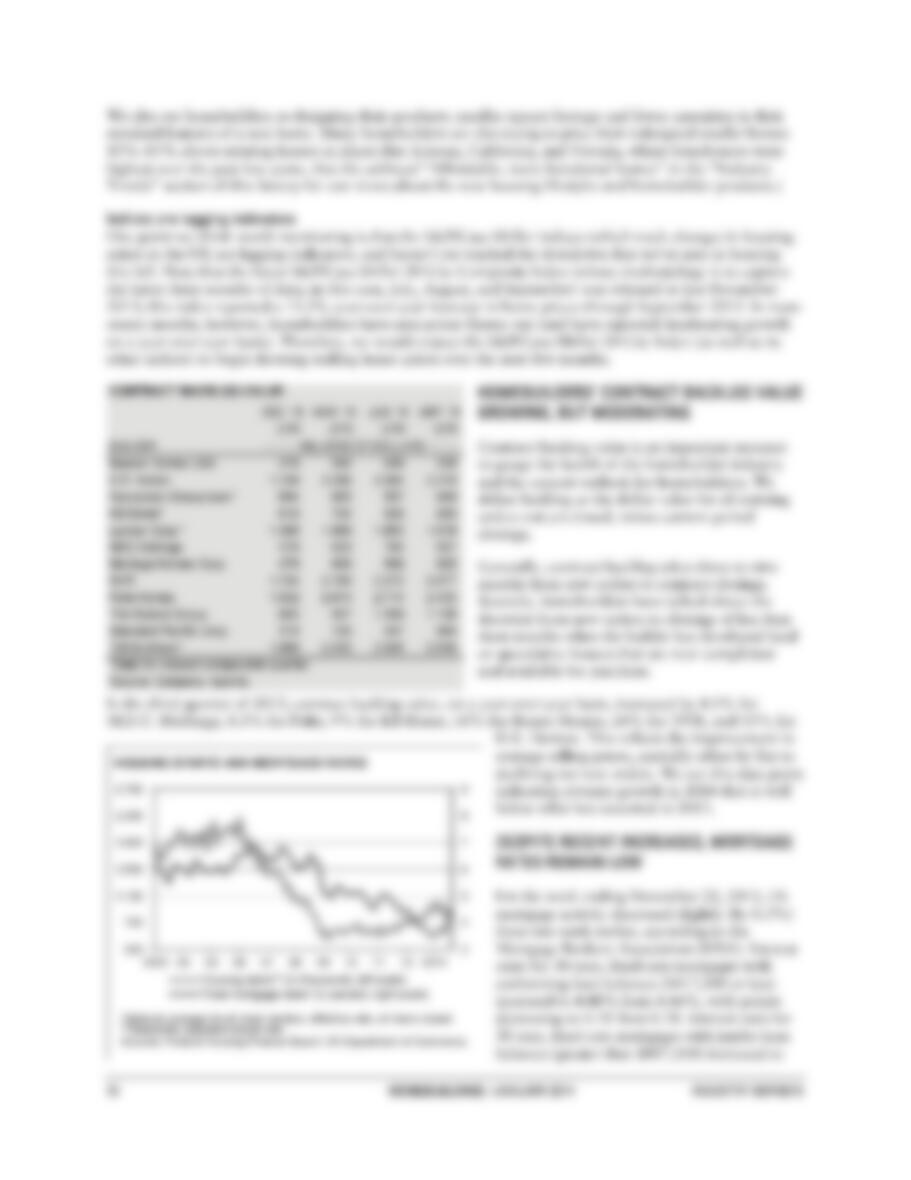
Lending standards remain tight
The Federal Reserve has tried to provide stimulus to the US housing market by lowering the federal funds
rate to just over 0%, which in turn has helped reduce the 30-year, fixed-rate mortgage rate. However, with
the Federal Reserve hinting that it might taper off its latest quantitative easing program, interest rates have
risen over the past several months. The 30-year, fixed-rate mortgage rose to 4.29% for the week ending
November 27, 2013. This is up from the 3.35% average in December 2012 and from the record low of
3.31% set in November 2012.
While low rates have provided a modest boost in demand from prospective homebuyers, continued tight
bank lending practices have mitigated the effort. While it became common practice in the last decade to
purchase a house with a down payment of 5% or less, banks in today’s environment are often asking
homebuyers for a 20% down payment. In addition, banks are requiring higher Fair Isaac Credit
Organization (FICO) scores in order for prospective homebuyers to qualify for a mortgage.
While current lending standards may be tight compared with the recent housing boom years of the 2000s,
when no-money-down home purchases were rampant (with lenders even allowing prospective homebuyers
with poor credit to do this), we believe credit is still much looser than it was pre-1980, when a 20% down
payment was the standard. We don’t expect more than just minor loosening in bank lending standards in
2013 without some sort of political intervention.

4 HOMEBUILDING / JANUARY 2014 INDUSTRY SURVEYS
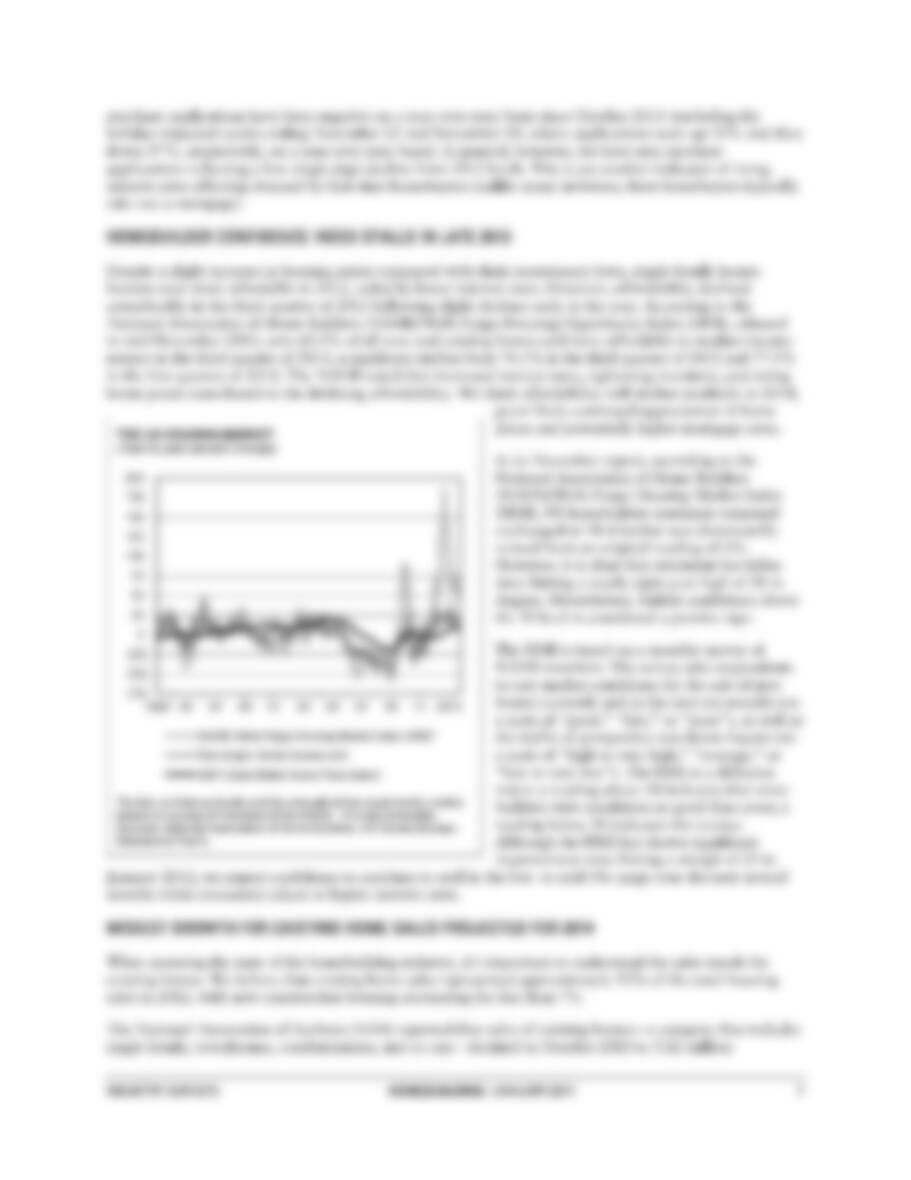
Psychological factors
Homebuilders often say that an important building block for a housing recovery is buyers’ confidence.
Confidence has been yo-yoing over the past few years. In 2011, it reached a temporary high of 72.0 in
February, according to the Conference Board’s Consumer Confidence Index (CCI), before dropping to 40.9
in October. Confidence perked up again in early 2012, hitting 71.6 in February, suggesting that consumers
were becoming more positive despite rising gasoline prices. However, the index declined to 61.3 in August
2012. Driven by slight improvement in economic data, the CCI rose to 73.1 in October 2012, its highest
level since February 2008 and a sharp contrast to its year-earlier level. This improvement didn’t last long,
however, as the index declined over the last two months of 2012, ending at 66.7 in December.
Heading into 2013, the index dropped significantly to 58.4 in January, but started to rise over the next
several months, reaching a yearly high of 82.1 in June. Since June, confidence declined all the way back
down to 70.4 in November, which we attribute to concerns related to the labor market, questions
surrounding the implementation of the Affordable Care Act, and disgust with the government following its
recent shutdown. Although the November figure is significantly higher than the historic low posted in
February 2009 (when it stood at 25.3), it still represents confidence levels synonymous with recessions:
consumer confidence averages 71 during recessions and 102 in economic expansions.
In our view, despite some relief from gas prices, worries about federal budget issues, anemic wage growth,
and higher taxes continue to stunt consumer confidence. According to the NAR, the Housing Affordability
Index reached a record high of 193.9 in 2012, up from its earlier record of 186.4 in 2011. Although homes
reached record affordability levels in 2012, we believe buyer confidence remains low, as homeowners have
been scarred by the breadth and depth of the housing market decline. We think the psychological outlook is
gradually improving, but is still an impediment to recovery.
Further, households are nervous at this time, in our view, and they are having trouble paying their existing
or new mortgage. According to CoreLogic, 7.1 million residential properties with a mortgage (around
14.5% of the total) were underwater at the end of the second quarter of 2013—that is, the total owed on
the mortgage exceeds the home’s appraised value. This is lower than the 9.6 million residential properties
with a mortgage (around 19.7% of the total) that were underwater at the end of the first quarter of 2013.
Though the drop in the underwater mortgage numbers is indicative of some progress, Zillow, an online real
estate database, paints an even less sanguine picture: in the third quarter of 2013, it estimated that 21% of
homes—around 10.8 million households—were underwater on their mortgages. Whether the percentage for
underwater mortgages is 15% or 21%, it is still fairly high, and exemplifies the damage that the housing
boom (and subsequent bust) created.
FORECLOSURES CONTINUE TO DECLINE
Foreclosed homes are becoming much less of a drag on housing. Data from RealtyTrac show that
foreclosure starts hit a seven-year low in the third quarter of 2013. According to the firm’s U.S. Foreclosure
Market Report for the third quarter of 2013, there were 376,931 properties with foreclosure filings for
default notices, scheduled auctions, and bank repossessions, down 7% from the second quarter of 2013 and
down nearly 29% from the third quarter of 2012. In its Year-end 2012 U.S. Foreclosure Market Report, the
firm noted that there were 1,836,634 properties with foreclosure filings in 2012, a 3% decrease from 2011,
and nearly a 36% decline from 2010.
However, not all states are showing declines in foreclosures. According to RealtyTrac, foreclosure activity in
the first quarter of 2013 (latest available) increased 6% in all 26 states that use judicial process for foreclosure,
while foreclosure activity dropped 44% in the 24 states that use non-judicial foreclosure process. We think
this is due to the timeline it takes for foreclosures to be completed in judicial states, averaging over three
years from start to completion in states like New York. As a result, we think it will take another year or so
before much of the backlogged foreclosures clear the market in judicial states, while non-judicial states
should continue to see declines in foreclosure activity. In its year-end 2012 report, RealtyTrac noted that it
expected foreclosure activity to pick up in 2013. In line with its expectations, foreclosure activity in judicial
process states increased at the beginning of 2013, as lenders attempted to catch up with backlogs. The firm

also noted that non-judicial process states would likely see an increase towards the end of the year as
lenders process deferred foreclosures.
According to RealtyTrac, Florida reported the highest foreclosure rate (one in every 104 housing units) in
the first quarter of 2013, followed by Nevada (one in every 115 housing units), Illinois (one in every 147),
Ohio (one in every 188), and Georgia (one in every 200). Other states ranked among the nation’s top 10
with the highest foreclosure rates were Arizona (one in every 202), Washington (one in every 220),
Maryland and South Carolina (each with one in every 254), and California (one in every 266).
HOMEBUILDERS MORE AGGRESSIVE IN ACQUIRING LAND, BUT REMAIN RELATIVELY CAUTIOUS
Land acquisition activity is picking up strength among homebuilders, though many remain somewhat
cautious. Most have raised significant cash to get through the housing downturn. They continue to
recalibrate their operations, products, and pricing to contend with weak buyer demand, changing housing
preferences, and competition from foreclosed homes that are being re-marketed for sale. In our opinion,
many of the largest publicly traded homebuilders are ready to take advantage of potential land acquisitions,
although the all-clear sign of a housing market recovery has yet to occur, in our opinion.
We believe that most of the largest publicly traded companies are strong enough from a liquidity standpoint
to rebound in a housing market recovery and gain market share from the smaller private builders that have
limited access to funds (which come mostly from banks that have tightened their lending practices). Some of
these large builders have cash equivalents and unused bank line-of-credit facilities exceeding $1 billion, with
no major debt outstanding maturing in the next year. In our view, homebuilders have been very smart to
reduce debt and extend debt maturities.
The key industry drivers for a housing recovery include an increase in buyers’ confidence, strengthening
demand for new homes, a reduction in oversupply of new and existing homes available for sale, shorter time
periods for homebuyers to sell their current homes, and credit availability for those households that qualify
for home mortgages.