Weeks 3 & 4—Cellular Reproduction: Mitosis Lab Instructions
1
Introduction
Why do cells divide?
We take it for granted that organisms are made up of cells. Humans are made up of trillions of cells, while bacteria and protozoa are
made of only a single cell. It is well established that cells do not generate spontaneously, therefore cells must come from division of
pre–existing cells. The new body cells that are produced are identical to the pre–existing cells. To do this everything inside the cell,
including all the organelles and (most importantly) the genetic material contained in the chromosomes, must be copied. When cells
were first observed, late in the 19th century, it wasn’t fully appreciated how cells divided. But with the improvement of microscopes
the internal structure of the cell emerged, and scientists could see short strands appear at the beginning of cell division.
Lab today focuses on cellular division, also known as cellular reproduction. To become more familiar with why cells divide, the types
of cell division, and how cell division occurs, please visit this website (you may need to type in the links if they do not work when you
click on them) from the University of Florida (http://plaza.ufl.edu/alallen/pgl/modules/rio/stingarees/module/index.html). Next,
visit the “Cells Alive” website (http://www.cellsalive.com/toc_cellbio.htm), where you have a chance to view simulations for: 1) Cell
Models, 2) Cell Cycle, and 3) Mitosis. Please take notes on the cycles, noting chromosome arrangement as you watch them.
Cellular reproduction begins with cell growth during the G1 (or “gap” 1) phase, followed by the replication of DNA during the S
(“synthesis”) phase of the cell cycle. Growth continues during the G2 (“gap” 2) phase. The cell cycle is completed when the process
of mitosis (the M phase) results in two identical “daughter cells”. Mitosis is extremely accurate (in a biological sense) and ensures
that each of the two daughter cells produced gets a genetically identical set of chromosomes copied from the parent cell.
What organisms are best for studying cell division?
All somatic cells in living organisms undergo mitosis as a way of replicating and
growing. Some parts of plants, like the onion root tip we are using today, are ideal
models for observing mitosis. Tips of plant roots and shoots contain regions,
called meristems, which undergo rapid and continuous growth. Because rates of
cell division are quite high, many meristem cells will be in various stages of mitosis
at any given time. In root tips, meristem cells are rapidly undergoing mitosis as the
root grows deeper into the soil. “Snap shots” of root tips allow scientists to
measure rates of mitosis and investigate other questions about cell division.
The process of producing two genetically identical cells from a single parent cell is
called MITOSIS and it is extremely accurate (in a biological sense). It ensures that
each of the two “daughter cells” produced gets a genetically identical set of
chromosomes copied from the parent cell.
What you will do
Today, you will use the compound microscope to observe onion root tip cells and test hypotheses about mitosis. You will apply simple
statistical tests to make inferences based these hypotheses. Additionally, you will continue to refine your skills in using microscopes,
making slide preparations, and data analysis.
Objectives
By participating in this activity, you will:
1. Explore underlying causes (hypotheses) for the patterns that you can see in dividing and growing onion root tips cells
2. Design and conduct a study to quantify these patterns
3. Analyze these data using statistics
4. Draw conclusions based on gathered evidence
Methods
Making initial observations of mitosis
Part 1. Watch a time–lapse video of dividing cells
A. What do you notice about the relative duration of each cell cycle phase?
B. Which phases seem to drag on and on and which phases seem abruptly short?
Part 2. Exploring the cell cycle and mitotic phases in the onion root tip
Spend time becoming familiar with each phase of the cell cycle in onion root tip cells.
A. Using the professionally prepared slides, search in the root tip meristem for cells in each phase of the cell cycle.
B. Are some phases more difficult to distinguish than others? Which phases are most difficult to find?
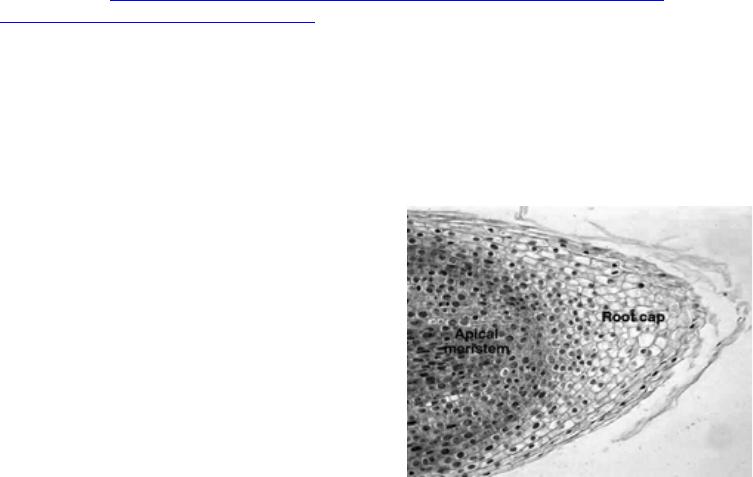
Figure 1. Microscope image of root tip cells.
2
Exploring patterns involving cell size and mitotic activity in root tip cells.
The action of roots extending through the soil can be accomplished two ways: 1) by adding more cells and 2) by elongating existing cells
in the direction of growth.
Part 3. Do cells elongate and widen as they mature in the root tip?
A. Observation: Cells in the densely–packed area near the root tip (the apical meristem) seem to be shaped differently than
those farther away from the tip.
B. Question: Is the variation in cell size related where cells are found in the meristem?
C. Hypothesis: Root tips extend through the soil by elongating existing cells in the direction of growth.
D. Predictions: If this is true, then cells within the apical meristem should be smaller than those farther away. Moreover,
this size change should be more dramatic along one axis, than in the other—that is, cells should be longer more than
they are wider as you move away from the tip.
E. Testing these predictions:
1. Blue/Green Individuals:
a) Testing whether cells away from the tip are significantly longer than those inside the meristem: We can
measure a cell’s dimensions using the ocular micrometer.
b) Collecting the evidence: Center and focus on one root tip using the 4× objective. Next, center and focus
using the 10× objective. Find the densely–packed, apical meristem tissue, which is not far from the root tip.
Center and, using the fine focus, bring these cells into sharp focus with the 40× objective. Without moving
the stage, rotate the nosepiece so that you are halfway between the 40× and 100× objectives and apply a
small drop of immersion oil to the coverslip. Next, carefully rotate the 100× objective into position and
focus on these cells. Make sure that both the ocular micrometer and the cells are in sharp focus.
Photograph these cells using your smartphone, export the photograph as a JPEG file, and email it to yourself
and your teammates. Open the file using ImageJ, a free image analysis application from the National
Institute of Health (NIH), set the scale, and measure and record both the length and width of about 15 cells
in this region.
Now rotate the nosepiece clockwise through the 4× and to the 10× objective. {Note: It is important to do it
in this direction so that the 40× objective does not dip into the immersion oil.] Using the ocular micrometer
and the 10× objective, find an area of cells that are about 2,000 µm up from the apical meristem. Using the
methods above, measure and record the lengths of another 15 cells from this region.
c) Data analysis and results:
i. Record your measurements both in your lab notebook and in an Excel spreadsheet. Use Excel’s
functions to calculate the sums (=sum), averages (=average), sample variances (=var.s), sample
standard deviations (=stdev.s). standard errors of the means, and 95% confidence intervals for the
lengths of the meristem cells and those cells 2,000 µm away from the meristem. Record these results
in your lab notebook.
ii. Perform a two–sample t–test that on the lengths of cells from both regions.
iii. Sketch a graph in your notebook that plots the average lengths along with their respective 95%
confidence interval error bars.
2. Red/Yellow Individuals
a) Testing whether cells away from the tip are significantly wider than those inside the meristem: We can
measure a cell’s dimensions using the ocular micrometer.
b) Collecting the evidence: Center and focus on one root tip using the 4× objective. Next, center and focus
using the 10× objective. Find the densely–packed, apical meristem tissue, which is not far from the root tip.
Center and, using the fine focus, bring these cells into sharp focus with the 40× objective. Without moving
the stage, rotate the nosepiece so that you are halfway between the 40× and 100× objectives and apply a
small drop of immersion oil to the coverslip. Next, carefully rotate the 100× objective into position and
focus on these cells. Make sure that both the ocular micrometer and the cells are in sharp focus.
Photograph these cells using your smartphone, export the photograph as a JPEG file, and email it to yourself
and your teammates. Open the file using ImageJ, a free image analysis application from the National
Institute of Health (NIH), set the scale, and measure and record both the width of about 15 cells in this
region.
Now rotate the nosepiece clockwise through the 4× and to the 10× objective. {Note: It is important to do it
in this direction so that the 40× objective does not dip into the immersion oil.] Using the ocular micrometer
and the 10× objective, find an area of cells that are about 2,000 µm up from the apical meristem. Using the
methods above, measure and record the widths of another 15 cells from this region.
c) Data analysis and results:
i. Record your measurements both in your lab notebook and in an Excel spreadsheet. Use Excel’s
functions to calculate the sums (=sum), averages (=average), sample variances (=var.s), sample
standard deviations (=stdev.s). standard errors of the means, and 95% confidence intervals for the
widths of the meristem cells and those cells 2,000 µm away from the meristem. Record these results in
your lab notebook.
ii. Perform a two–sample t–test that on the widths of cells from both regions.
iii. Sketch a graph in your notebook that plots the average widths along with their respective 95%
confidence interval error bars.
F. Evaluating the evidence
1. Is there sufficient evidence that cells elongate as they mature in the onion root tip?
a) Discussion: Compare graphs and t–test results among all members of your group. What does the evidence
suggest?
b) Notebook: Record the T–value, degrees of freedom, and p–range for testing whether there is a significant
difference in the average length of cells from the two areas.
2. Is there sufficient evidence that cells widen as they mature in the onion root tip?
a) Discussion: Compare graphs and t–test results among all members of your group. What does the evidence
suggest?
b) Notebook: Record the T–value, degrees of freedom, and p–range for testing whether there is a significant
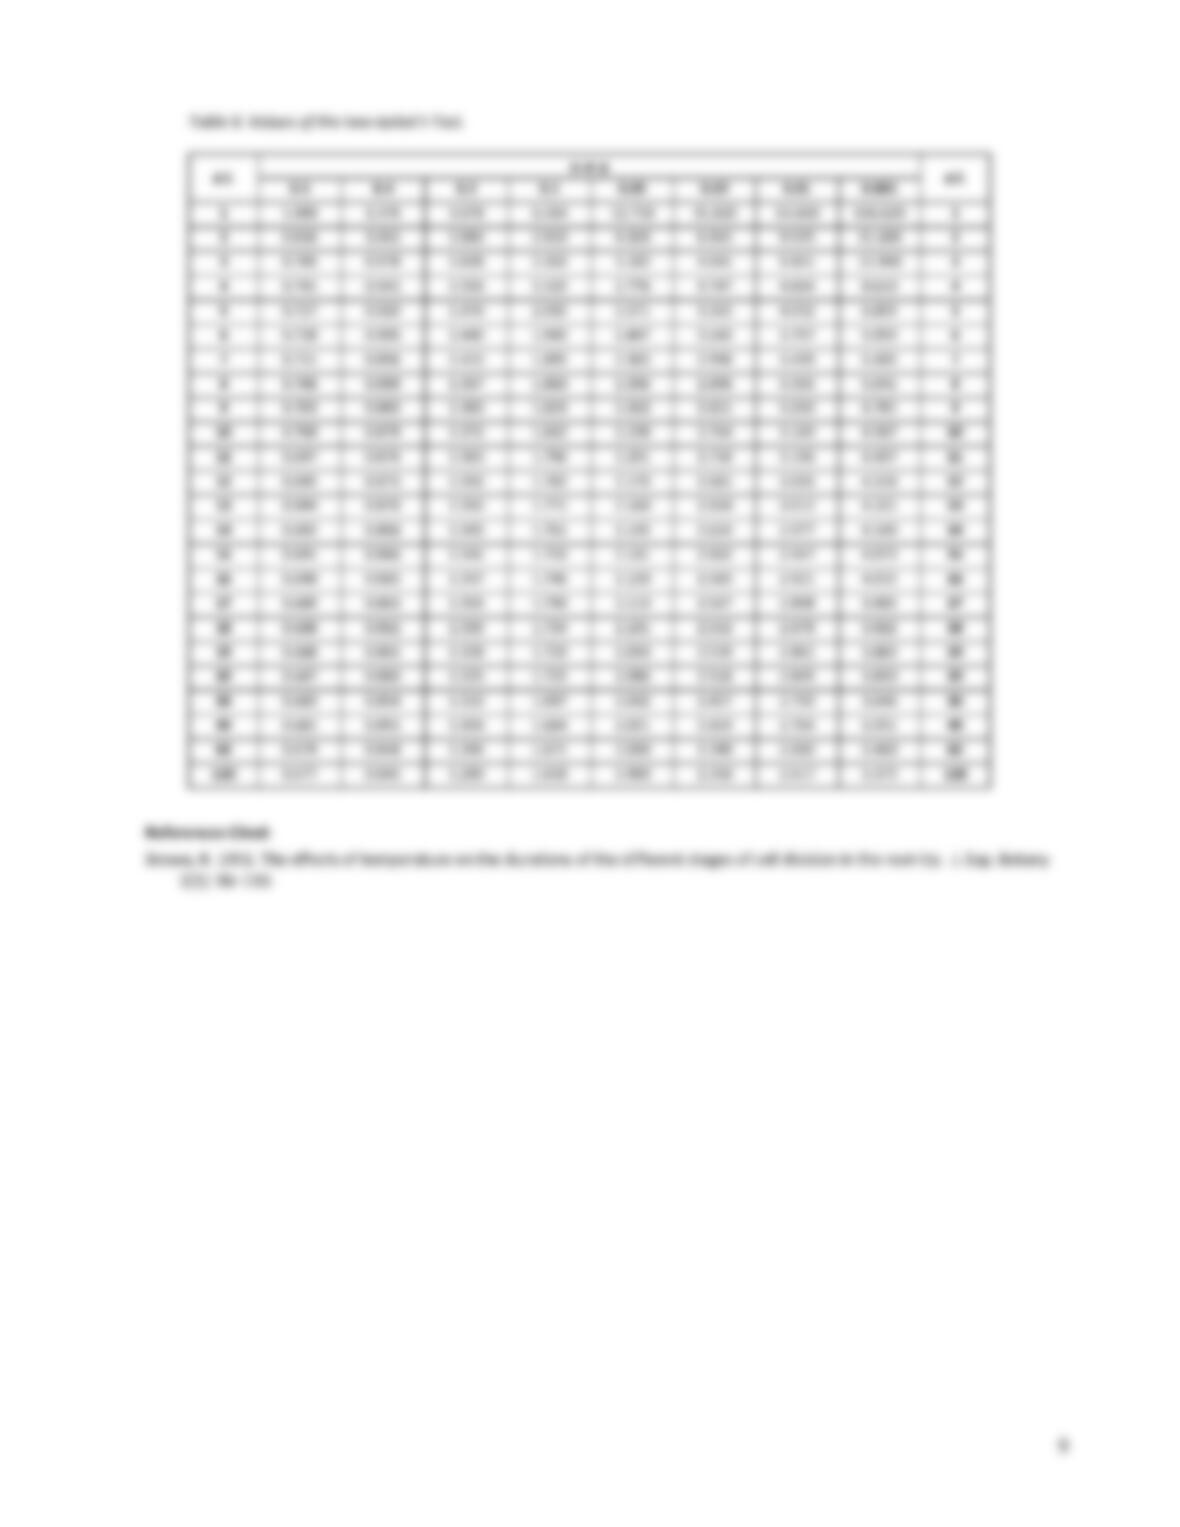
difference in the average width of cells from the two areas.