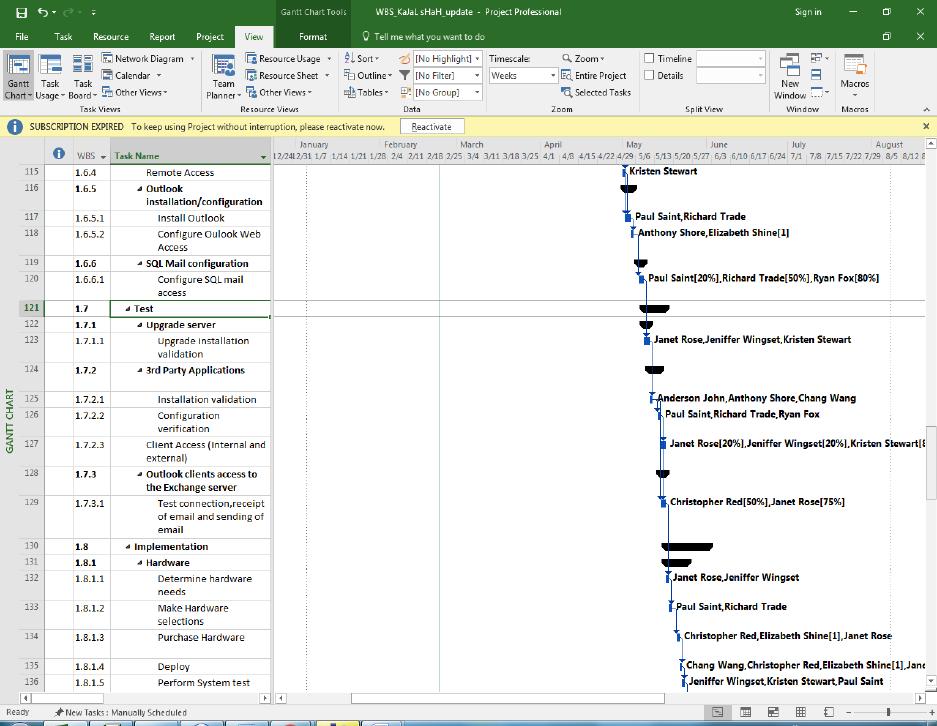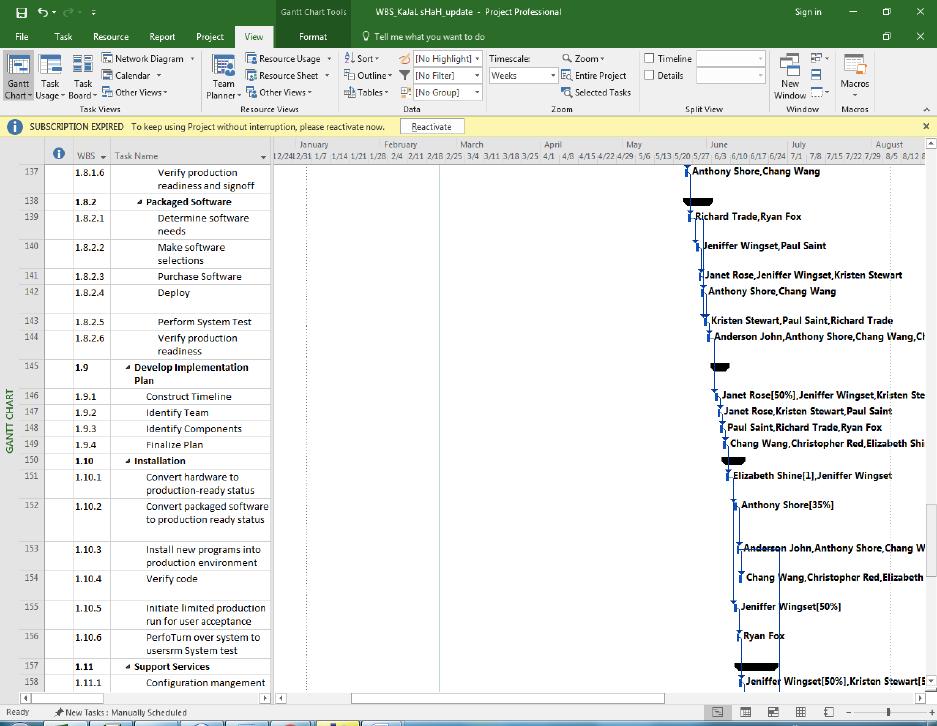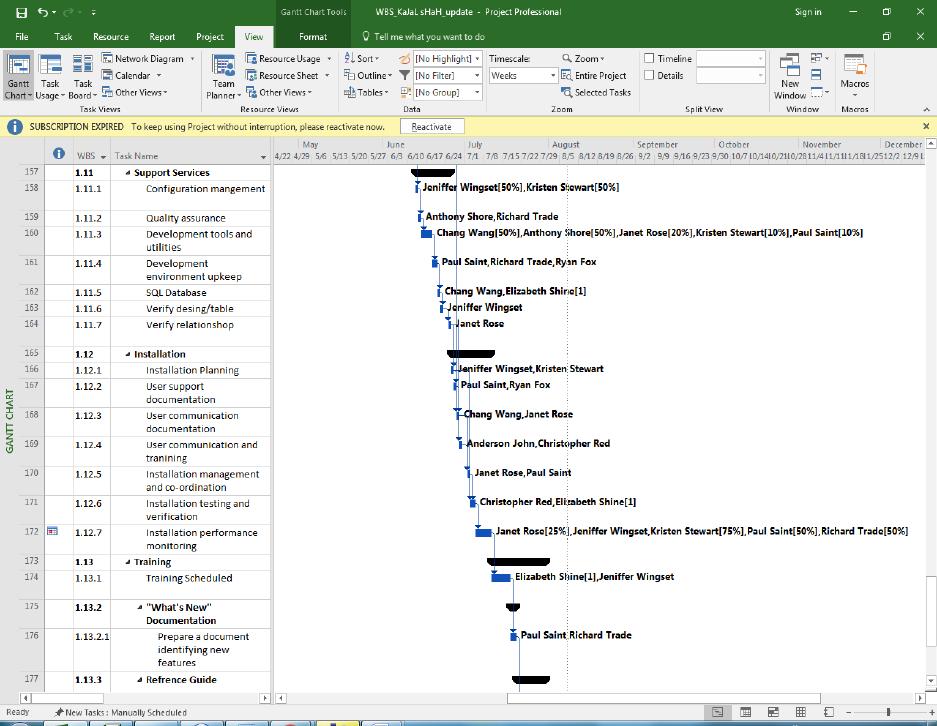
Schedule Management Plan
Purpose – The purpose of the schedule management plan is to describe the method the
project team will use in making the project schedule. This plan also incorporates how the
team will monitor the project schedule and manage changes after the baseline schedule
has been approved. This includes identifying, analyzing, prioritizing, approving or
rejecting, and publishing all schedule-related changes.
Schedule Storage Locations – The latest versions of all schedules will be maintained in
Upgrade SQL and Data collection.
C:\2204_WorkingSchedules on upgrades SQL\documents\Schedules
Schedule Quality – Schedule quality will control the total benefit to the planning and
forecasting effort. Schedule quality will be self-assessed by each project manager using
the schedule quality checklist that is attached, during the beginning of the project and
monitored throughout the project. Significant gaps that are identified will be addressed
and improved.
Schedule Baselines and Interim Plans – The primary goal of the properly managed
schedule baselines and interim plans is the following: allow the project manager and
project director to track the project schedule progress relative to the original plan
(baseline) and to also show changes that occur from week to week relative to an interim
plan.
Schedule Baselines –
Baseline Initiation –
Schedules will be baseline once a reasonable plan has been put together
where the users of the plan are confident that the schedule can be used as
an effective decision making tool. Not all will be known when the initial
baseline is generated.
Use deadlines for Target dates for key milestone deliverables
HUB baselines and project baselines do not need to be baseline or re-
baseline at the same time.
Baselines should be valid for months not weeks.
Baselines for individual projects should not be originally baseline or “re–
baseline” without agreement from the project director.
Baseline Viewing –
Baselines on projects when viewed on the Tracking Gantt should use the
standard bar graph as shown here by the grey shaded bar below.
Re-Baselining –
A new baseline will be generated if significant changes to the project have
occurred to cause the existing baseline to be no longer effective in driving
the project.
Comparisons of the existing plan to any of the previous baselines will be
preserved, hence, do not clear or change a baseline in the project or HUB
schedules
Interim Plans (No requirement now.. more later.. for this…”under
construction” – Interim plans save Finish and Start dates only and you can
have up to 10 interim plans (Start1, Finish1, …Start10, Finish10) ; Save
an interim plan to look at differences most between current vale and last
“saved” interim plan value. Values can be reviewed in the Task Sheet
view and compared to Baseline and updated plan)
Schedule Updates –
Updates to the schedule are done weekly, prior to the individual project
review meeting.
Tracking Gantt view should be used to show revised plans and progress on the
work