Governance for growth | 137
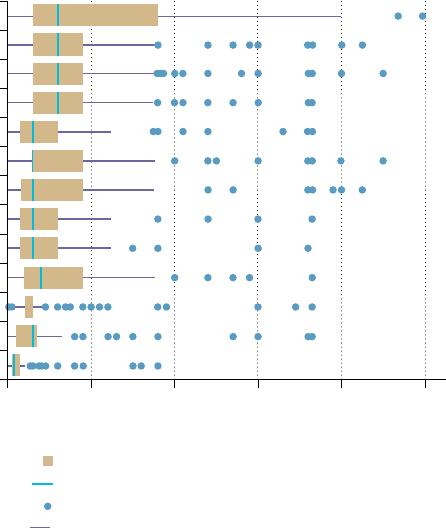
If a firm in Brazil or Mexico is asked how long it has
to wait to receive approval for new construction, the
answer could range from as little as 1 day to more than
100 days (figure 5.1). Such remarkable variation in the
wait time experienced by firms within the same coun-
try is true of almost any basic regulatory procedure
in most low– and middle-income countries. Examples
of such procedures are receiving a license to set up a
new firm or a permit to import an item.1
One reason for the variance in regulatory imple-
mentation could be that some firms have more inffu-
ence over the policy arena than others. For example,
recent firm-level studies suggest that, to the detriment
of long-term economic growth, firms with powerful
political connections are unduly favored in the way
certain policies are designed or implemented.2 These
firms receive preferential access to state credit, land,
and import licenses. The sectors in which they oper-
ate are protected from competition from other firms
through high regulatory barriers to entry. This form
of policy subversion has significant negative effects
on the economy.
How policy “capture” slows
economic growth
This chapter explains how and when powerful groups
with narrow interests can have an undue inffu-
ence on policy (“capture”) and slow down economic
growth, even in the context of high state capacity.3
Such dominant groups can include politically con-
nected firms and lobbies for industry, farmers, or
consumers. This chapter also analyzes cases in which
shortsighted, opportunistic state actors renege on
policy commitments, harming investors. In some
cases, existing norms such as tolerance of corruption
in public agencies can reinforce such policy failures.
That said, the inffuence of interest groups, while
ubiquitous, does not always render growth policies
ineffective; sometimes, it can even improve them.
How this process plays out depends on the character-
istics of the government agencies that enact the poli-
cies in question, as well as the incentives of inffuential
groups, such as industry associations, that interact
with those agencies. Understanding what drives this
difference can help identify ways to improve policy
effectiveness.
One lesson that emerges from such understanding
is that designing second-best policies that can achieve
at least the partial goals of security, growth, or equity
may be more effective than designing ideal policies
that are at high risk of capture (such second-best pol-
icies are considered implementable). A second lesson
is the value of avoiding policies that look good in the
short term but could end up reinforcing the power of
dominant groups that could block further reforms,
thereby hindering the effectiveness of policies in
the future. A third lesson is that undue inffuence
from dominant groups can be counterbalanced by
the appropriate design of incentives within public
agencies, checks and balances between agencies, and
mechanisms that extend accountability to a broad
group of firms and individuals. Such reforms can
expand the set of implementable policies.
This approach assumes that the interests of high-
level policy makers are aligned in the direction of
reform. Whether that is the case depends on the evo-
lution of the broader governance environment, a topic
examined in part III of this Report.
A lesson is the
value of avoiding
policies that look
good in the short
term but could end
up reinforcing the
power of dominant
groups that could
block further
reforms.
Governance
for growth
CHAPTER 5
138 | World Development Report 2017
action are associated with persistent differences
in levels of economic development. For example, in
some regions of Peru an extensive system of forced
mining labor (mita) was in effect from 1573 to
1812. Today, the average household consumption
levels in those regions are about 25 percent lower
than in adjoining regions. One explanation is that
in areas without mita, the landowning class that
emerged had an incentive to set up stable property
rights institutions. Today, areas that did not have the
mita system continue to have more secure property
rights and do a better job of providing public goods
(Dell 2010).
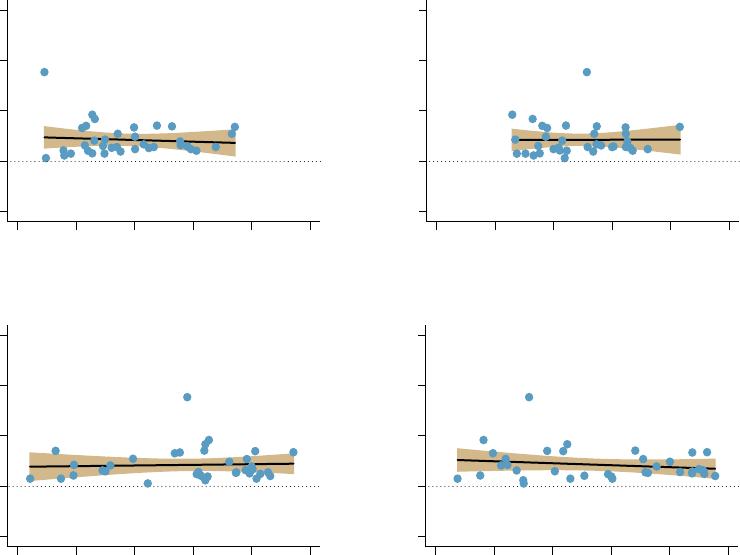
When change is viewed over the shorter time span
of decades rather than centuries, the relationship
between broad, aggregate measures of governance
and economic growth is weaker (figure 5.3). Over the
last century, growth accelerations and slowdowns
that lasted as long as a decade do not seem to have
been correlated with major changes in governance,
nor have sustained periods of high growth lasting as
long as three decades.6 It is possible for economies
to grow without big changes in the nature of gover–
nance, but it is not clear how long such growth can
be sustained.
What are the mechanisms behind the aggre-
gate relationship between governance and growth?
Because different dimensions of governance are
correlated across countries, it is not easy to delin-
eate their impacts on growth using a cross-country
analysis alone. A more microeconomic analysis of
the mechanisms through which governance affects
growth is therefore a vital complement to the macro-
economic analysis of governance and growth (Pande
and Udry 2006).
Two sources of growth: Investment
and efficiency
On the surface, growth in per capita income has two
sources: investment and efficiency. On the one hand,
investment is the process by which economies accu-
mulate physical capital, skills, and knowledge. Effi-
ciency, on the other hand, determines how well this
labor and capital are put to use. In general, at least half
of the per capita income differences across countries
is attributable to differences in countries’ efficiency
levels (total factor productivity, or TFP). The rest is
due to differences in investment (accumulation)—see
Caselli (2005, 2016). Both investment and efficiency
thus matter to growth.
Countries vary in the emphasis they place on
various forms of investment and efficiency in their
growth models. Some growth models emphasize
How governance matters to
growth: A microeconomic
perspective
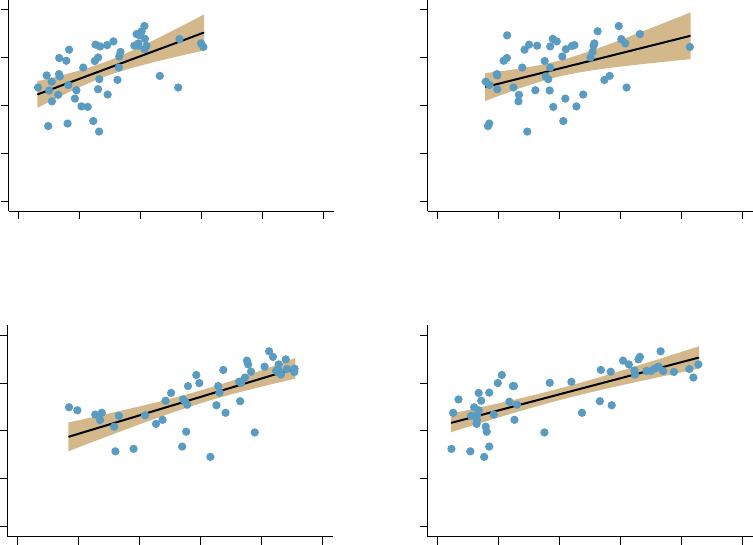
There is a clear positive correlation between aggre-
gate measures of governance and per capita income
across countries (figure 5.2). Because countries had
similar levels of per capita income in the distant past,
current differences in their per capita income largely
reffect differences in their long-term growth rates.4
Thus governance and long-term growth are positively
associated.
This correlation should be viewed with some
caveats, however. It could reffect reverse causation
from growth to governance, or some third factor (such
as accumulated knowledge and skills) that affects
both governance and income growth. Bearing in mind
these caveats, many cross-country studies suggest
that the nature of governance—as reffected in broad
institutional measures such as protection of prop-
erty rights, rule of law, and absence of corruption—
matters to long-term growth.5
Even within countries, historical differences in
institutions that affect property rights and collective
Figure 5.1 Length of time needed for firms to obtain a
construction permit varies widely
Sources: WDR 2017 team, based on data from World Bank, Enterprise Surveys, circa 2006 to 2014.
Guatemala
Mexico
Paraguay
Romania
Vietnam
Brazil
Chile
Peru
Russian
Federation
Argentina
India
Turkey
Nigeria
10 02003004005000
Days to obtain a construction permit
25th–75th percentile
Minimum and maximum values excluding outliers
Median
Outliers
Governance for growth | 139
The key governance functions: Enhancing
commitment and collective action
In the absence of a credible commitment to the
security of property rights (that is, when there is
risk of expropriation), the incentives for investment
or innovation will be limited. Firms and individuals
that experience lower security will invest less in pro-
ductive activities. Moreover, differences across firms
in the level of security from expropriation will affect
the efficiency of resource use. If the more productive
firms in an economy experience lower security than
the less productive ones, then investment by produc-
tive firms will be inefficiently low, leading to misallo-
cating resources and thwarting growth.
Consistent with theory, household-level studies
find that farmers are more likely to make long-term
investments in their land when their tenure is more
secure, and urban households are more likely to
accumulation, such as the mobilization of savings
for industrial investment. Other models emphasize
growth in efficiency through innovation and compe-
tition among firms. Growth models based on factor
accumulation may require a different governance
configuration than those based on efficiency. Transi-
tioning from one model to another has proven to be a
complex policy challenge (Gill and Kharas 2015)—see
spotlight 6 on the middle-income trap.
Governance can affect investment and efficiency
through two types of institutional “functions.” The
first deals with commitment—that is, creating an envi–
ronment in which firms or individuals feel secure in
investing their resources in productive activities and
have the incentives to use them efficiently. The second
pertains to socially beneficial collective action to coor–
dinate investment decisions and promote cooperation
among investors to solve potential market failures.
Figure 5.2 Per capita income and governance are correlated
Sources: WDR 2017 team, using data from IMD World Competitiveness Online, and World Bank, World Development Indicators (database, GDP per capita). For
both sources, the data are shown for 2010.
Note: “Bureaucracy” indicates to what extent bureaucracy does not hinder business activity; “government decisions effiectively implemented” indicates to
what extent government decisions are effiectively implemented; “personal security and private property” indicates whether personal security and private
property rights are adequately protected; and “bribery and corruption” indicates to what extent bribery and corruption do not exist in a country. The scale
ranges from 0 (worst outcome) to 10 (best outcome). GDP = gross domestic product.
12
10
8
6
4
GDP per capita (log)
12
10
8
6
4
GDP per capita (log)
12
10
8
6
4
GDP per capita (log)
12
10
8
6
4
GDP per capita (log)
0 2 4
Bureaucracy Government decisions effectively implemented
Personal security and private property Bribery and corruption (absence of)
6 8 10
a. Bureaucracy
0 2 4 6 8 10
b. Government decisions effectively implemented
0 2 4 6 8 10
c. Personal security and private property
0 2 4 6 8 10
d. Bribery and corruption (absence of)
140 | World Development Report 2017
sell those parts at whatever price that particular buyer
offers. Thus the firm will hesitate to specialize unless
both parties can agree on an enforceable contract
with a fair price. In small economies, reputation and
relationships can be effective means of enforcement,
but as growth leads to greater market size, impersonal
interactions become more likely, and thus formal
contract enforcement begins to matter more (Dixit
2007). Empirical studies find that a strengthened for–
mal enforcement system (such as through the courts)
can foster the creation of new business relationships,
promote trade in goods, and increase the ffow of credit
to firms.8
The design and implementation of regulations
that affect competition between firms are another
policy dimension central to growth. For example,
poorly designed licensing requirements for new firms
can make it difficult for entrepreneurs to bring new
investment ideas to fruition, and they can reduce the
renovate homes when the risk of being dispossessed
is lower.7 Secure rights also improve labor allocation
because protecting one’s property is no longer a pri-
mary motivation in decisions about where to work
(Field 2007). Similarly, studies find that firms that
perceive themselves to be more secure from expropri-
ation reinvest more of their profits in their business
(Johnson, McMillan, and Woodruff 2002b). Theory
also suggests that well-defined property rights
should improve the functioning of credit and other
asset markets, but empirical evidence in support of
such suggestions is weak.
Enforcement of contracts governing economic
transactions is also critical because problems with
contract enforcement prevent specialization and an
optimal division of labor (North 1990; Costinot 2009).
Suppose a firm is considering whether to specialize
in producing parts for a bigger firm. Once committed
to this specialization, it will have no alternative but to
Figure 5.3 Medium-term growth and governance are not correlated
Sources: WDR 2017 team, using data from IMD World Competitiveness Online (1996 and 1998 for “government decisions effiectively implemented”), and World
Bank, World Development Indicators (database, average annualized growth rate in logs, 1990–2015).
Note: “Bureaucracy” indicates to what extent bureaucracy does not hinder business activity; “government decisions effiectively implemented” indicates to
what extent government decisions are effiectively implemented; “personal security and private property” indicates whether personal security and private
property rights are adequately protected; and “bribery and corruption” indicates to what extent bribery and corruption do not exist in a country. The scale
ranges from 0 (worst outcome) to 10 (best outcome).
0.15
0.10
0.05
0
–0.05
Average annualized growth rate
in logs (1990–2015)
0.15
0.10
0.05
0
–0.05
Average annualized growth rate
in logs (1990–2015)
0.15
0.10
0.05
0
–0.05
Average annualized growth rate
in logs (1990–2015)
0.15
0.10
0.05
0
–0.05
Average annualized growth rate
in logs (1990–2015)
Bureaucracy Government decisions effectively implemented
Personal security and private property Bribery and corruption (absence of)
a. Bureaucracy b. Government decisions effectively implemented
c. Personal security and private property d. Bribery and corruption (absence of)
0 2 4 6 8 10 0 2 4 6 8 10
0 2 4 6 8 10 0 2 4 6 8 10
Governance for growth | 141
that are functionally optimal for aggregate growth.
Yet, even when such capacity exists and a first-best
policy has been identified, those in power may not
have the incentive to choose that policy. Indeed, spe–
cific actors in the policy arena may be able to design or
implement a policy that maximizes their private ben–
efits rather than social welfare because they have so
much bargaining power. In this Report, this arrange–
ment is called capture. Capture is not easy to identify,
and there is the risk of mistaking what was simply a
misinformed policy choice for deliberate subversion.
Recent years have seen a burgeoning of quanti-
tative research into this question. This research has
detected specific forms of capture, and in some cases
it has even measured its efficiency costs. For exam-
ple, studies of trade policy suggest that even in high-
income countries policy choice can unduly reffect the
preferences of groups with high levels of inffuence in
the policy arena. Although low trade barriers are gen-
erally good for long-term growth, domestic industries
that compete with imports stand to lose from them in
the short term. Political inffuence or campaign contri-
butions from industry lobbies and labor unions have
been shown to affect the setting of import tariffs.
Larger and better-organized industries that compete
with imports tend to win more import protection.14
The potential power to inffuence policy is distrib-
uted unevenly, not only across industries but also
across firms within industries. In most countries,
some firms are much better connected to the gov–
ernment than others. Sometimes, state actors collude
with such politically connected firms to subvert a
policy in the interest of those firms, possibly to the
detriment of unconnected firms in the same industry.
Such capture by politically connected firms may
not be easily identifiable or as large scale as, say,
setting high tariffs in import-competing industries,
but the evidence suggests that its economic costs
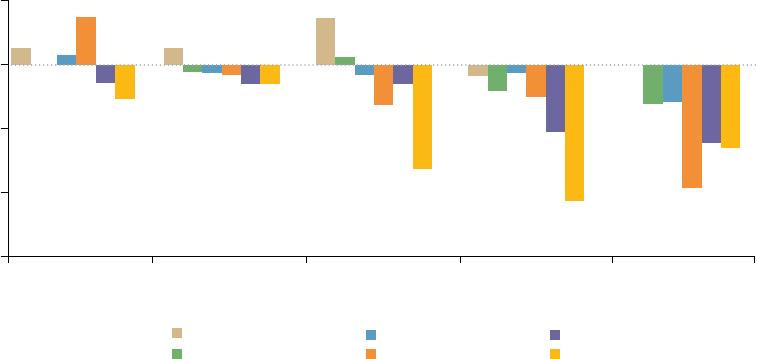
are far from trivial. In the 1990s, for example, some
of Indonesia’s largest industrial groups had strong
connections to President Suharto.15 Between 1995
and 1997, rumors about the state of Suharto’s health
circulated on several occasions. Each time, the more
closely industrial groups were connected to the pres-
ident, the more their stock values fell (figure 5.4). In
fact, the more serious the health rumor, the greater
was the fall in stock values. Because this decline was
not connected to other changes in market conditions
or the productivity of connected firms, the drop in
share prices was a proxy for the private benefits of
being able to capture policy through political connec-
tions (Fisman 2001). Based on a similar method, the
estimated value of political connections in the Arab
competitive pressure on existing firms to innovate
and become more productive.9 For example, a policy
of industrial licensing in India required firms to
obtain government permission before setting up a
new factory or expanding output in an existing fac–
tory. The process of license approval was onerous and
unpredictable. Loosening these requirements in some
industries in the 1980s may have increased efficiency
levels by as much as 22 percent (Chari 2011).
Some forms of collective action, such as coordinat-
ing investment and ensuring cooperation to prevent
free-riding, can solve potential market failures that
can impede growth and investment in public goods.
Although discussing all possible market failures is
beyond the scope of this chapter, what follows illus-
trates the key issues by looking at a specific type of
failure.
The insight that failure to coordinate investment
activity could lead to underdevelopment is decades
old.10 Suppose an industry could upgrade to a mod-
ern technology that relies on a range of specialized
skills. For a worker, investing in learning those skills
does not make sense if it is not clear that the modern
technology will be adopted. For a firm, investing in
the new technology does not make sense unless a
supply of the required specialized skills will be avail-
able. Thus without some way of coordinating the
decisions of workers and firms, the industry could
remain trapped in a low-level equilibrium.11 Such
coordination problems can occur in many contexts,
ranging from finance and adoption of technology to
innovation and industrial clusters.12
Policies to address coordination and other col-
lective action problems are difficult to design and
implement. For example, when complementarities
between firms could lead to a coordination failure,
governments could use subsidies or taxes to encour-
age firms to invest in a coordinated manner (Rodrik
1996). But targeting such a subsidy scheme to the
right set of firms requires information on precisely
which firms could have spillovers on others, and on
how much they are investing (Bond and Pande 2007).
Because of such implementation challenges, policies
to address collective action problems in growth are
particularly sensitive to the quality of governance.13
How policies are aected
by undue inffuence from
powerful groups
A poor capacity to design or implement policies could
be one reason why governments do not enact policies
Capture by
politically
connected firms
may not be easily
identifiable, but
the evidence
suggests that its
economic costs
are far from trivial.
142 | World Development Report 2017
Granting import licenses to favored firms. Another
way to channel favor to connected firms is to grant
import licenses only to specific (favored) firms. In
Suharto-era Indonesia, being politically connected
tripled the likelihood of receiving a license relative
to a firm’s competitors. And the licenses conferred
monopolistic power on the licensee. For example,
a highly connected firm in the milk industry was
granted import licenses for 12 inputs necessary to
produce milk, whereas some other firms in the same
industry had three to four licenses at most. This sit-
uation forced competitors to rely on the connected
firm or on inferior domestic supplies (Mobarak and
Purbasari 2008).
Using market regulations to favor firms. Market reg–
ulations can also be used to favor connected firms.
For example, regulatory barriers to the entry of new
firms can be a means of protecting incumbents to
the detriment of market entry and competition. In
Tunisia during the regime of Zine El Abidine Ben
Ali (1987–2011), firms under the control of the ruling
clan accounted for a disproportionately high share
(21 percent) of total private sector profits (Rijkers,
Freund, and Nucifora 2014). The superior profits of
these connected firms may have been due to the heavy
regulation of firm entry, investment, and foreign
direct investment in the sectors in which they had a
heavy presence. Indeed, the gap in profits between
connected firms and others was higher in the more
regulated sectors, suggesting that entry regulation
Republic of Egypt during the Mubarak era was about
13–16 percent of firm value (Chekir and Diwan 2014).
How politically connected firms gain
undue advantage
The benefits of policy capture to politically connected
firms can be economically significant. Understand-
ing the ways in which policy capture occurs is there-
fore important.
Diverting credit. One way in which state actors
favor connected firms is to divert government loans
to them. In Pakistan, for example, between 1996 and
2002 politically connected firms borrowed 45 percent
more and had 50 percent higher loan default rates
than other firms (Khwaja and Mian 2005). This pref-
erential treatment was related entirely to loans from
government banks. Moreover, it increased when the
power of the connected politician increased, and it fell
when there was more electoral competition within the
politician’s constituency. In Brazil, firms that made
campaign contributions to winning candidates in the
1998 and 2002 elections had higher returns and sub-
sequently received greater credit from banks (Claes-
sens, Feijen, and Laeven 2008). A study of Malaysia
at the time of the Asian financial crisis found that the
market value of politically connected firms improved
relative to that of other firms after international capi-
tal controls were imposed, suggesting that connected
firms had easier access to domestic credit (Johnson
and Mitton 2003).
Figure 5.4 In Indonesia, the stock value of politically connected firms fell when the
connection was jeopardized
The closer that industrial groups were to President Suharto, the more the value of their stock fell as rumors about the
president’s health circulated
Source: Fisman 2001, figure 1.
Change in stock values of
Indonesian firms (percentage points)
1996: July 4–July 9 1997: April 1–April 31995: April 21
1996: April 29 1996: July 26
1995: Jan. 30–Feb. 1Suharto illnesses:
1
(Firms least connected) 2 3
Degree of political dependence
4 5
(Firms most connected)
–4
–6
–2
0
2
consumer advocacy groups prevails, regulators may
set the price too low.16
Tilting policies to favor politically inffuential groups.
Sometimes, politicians direct public investment to
benefit narrow groups of supporters—a practice
known as clientelism (see chapter 6). Such a client-based
allocation of public investment is likely to be highly
inefficient.
More generally, public resources can be allocated
in favor of politically inffuential groups without nec-
essarily involving a strict patron-client relationship.
For example, many countries have development
programs that direct state credit to small firms, rural
enterprises, and farmers. This credit can be used to
favor groups that have outsized political inffuence.
Cole (2009) found that from 1985 to 2009 in India
agricultural credit from state banks increased by
5–10 percentage points in an election year. This
higher lending during election years targeted places
served to shield connected firms from competition.
There is similar evidence from Mubarak-era Egypt
(Diwan, Keefer, and Schiffbauer 2015).
Political cycles and populism
Potentially, any group of firms, workers, or consum-
ers that is politically inffuential can inffuence policies.
For example, the adoption of “green growth” policies
that are socially beneficial and would not necessar–
ily slow down economic growth could be blocked
by inffuential groups of farmers or consumers who
stand to lose from the policies in the short term (box
5.1). Sometimes, it is hard to predict which side will
manage to tilt policies in its favor. For example, in the
utilities industries, the unregulated price can be inef-
ficiently high, and there is a valid economic argument
for regulating the price. However, the regulators may
set the price too high if they collude with the utility
firm, whereas if the countervailing inffuence from
Box 5.1 Why some people see red when they hear “green growth”
“Green growth is about making growth processes
resource-ecient, cleaner and more resilient without nec–
essarily slowing them” (Hallegatte and others 2012, 2). For
smaller, targeted doses and more organic fertilizers, effiorts
to phase out the subsidy could hurt maize farmers for some
years (Resnick, Tarp, and Thurlow 2012).