GOLDEN RULE LEVEL OF CAPITAL & SAVINGS
RATE – SOLOW MODEL
Golden Rule Level of Capital – Solow Model
The Savings rate that leads to the Steady State Capital that maximizes
consumption
•Consumption – a proxy for welfare in the model
– How do different values of k*and s affect Consumption?
•Golden Rule Level of Capital: k*g
– What is the golden rule level of capital and savings?
•Consumption via the Solow diagram
•The idea of steady state consumption
•The Nitty Gritty:
– Math – Solve for the Golden Rule Steady State Level of
Capital and the savings rates associated with that
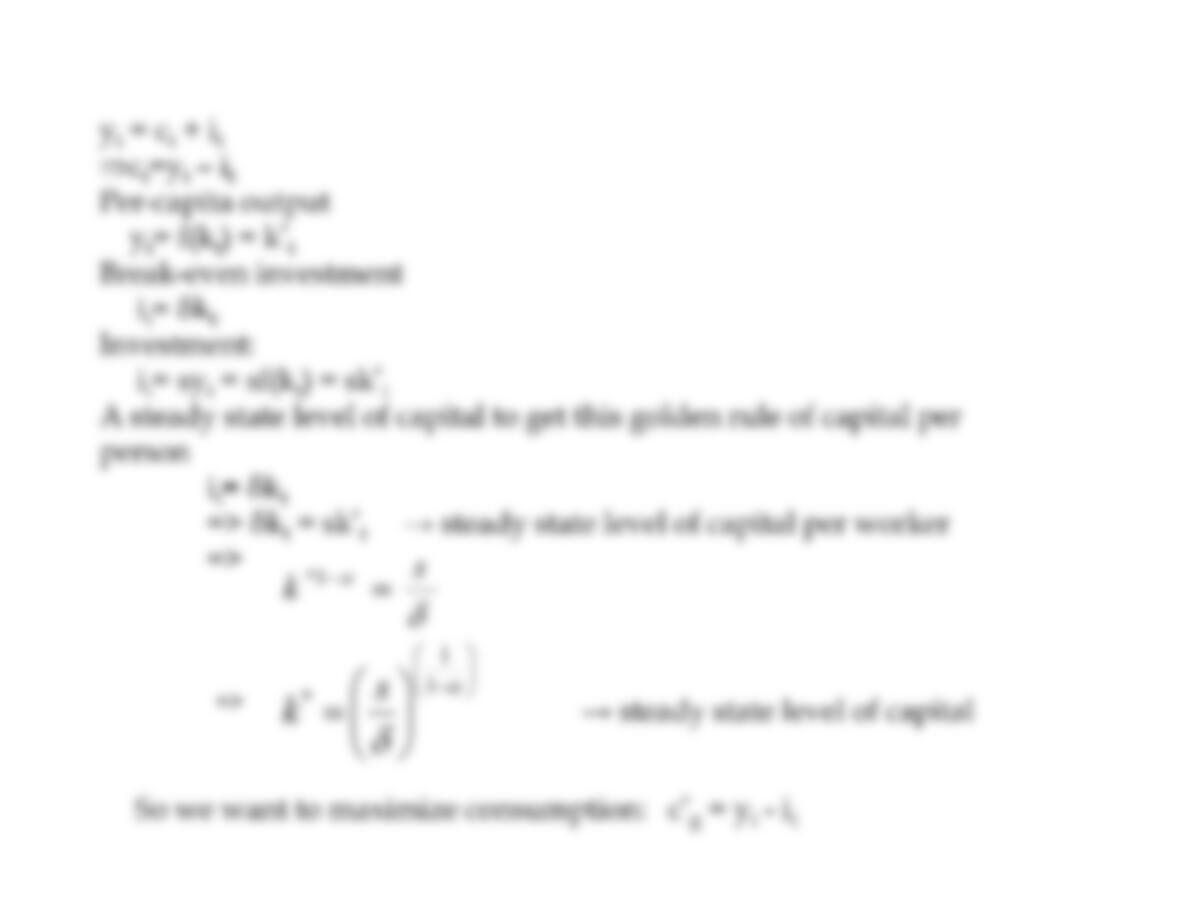
yt= ct– it

Golden Rule Level of Capital – There is going to be a level of capital
that maximizes consumption. The level of capital that maximizes the
steady state consumption is the Golden Rule Level of Capital
yt= ct– it
Where:
yt– output per person or income per person
ct– per worker consumption or per capita consumption
it– can be savings in the next period
Solow Diagram – finding the golden rule
The Law of Motion of Capital
Δk = syt– δkt
Steady States
k*steady state capital per worker
y*= f(k*) = Ak*α

Note: Show Figure 1
Δk curve – is the breakeven investment rate
y = f(k) = Akαcurve – is the capita production function or production
per person
it= sAkαcurve – is the investment line
If we drop the investment line, the graph is:
Note: Show Figure 2
δk – break-even investment line – is the amount given any of these
values of capital, it tells you the amount of investment required in
order to keep that capital stock constant
ct= yt– it

What is consumption in the Solow Diagram?
-Consumption in the Solow Model is the difference between output per
person and investment. Investment at different levels of capital per
person is denoted as Δk
– The idea is we would like to find the steady state value, we will find
the level of capital per worker that results the biggest difference in
output and investment
– Savings rate is exogenous, suppose we can manipulate it if saving rate
is a choice variable (rather than exogenous variable) then we get to
choose the steady state level of capital or capital stock o k that ends up
in the economy where we want to place it is to place it where we
maximizes consumption
– Where we would like to place it is to place it where we maximizes
consumption
– Where is consumption in the Solow Diagram?
– Consumption in the Solow Model is the difference between output
per person and investment. Investment at different levels of capital per
person is denoted as Δk
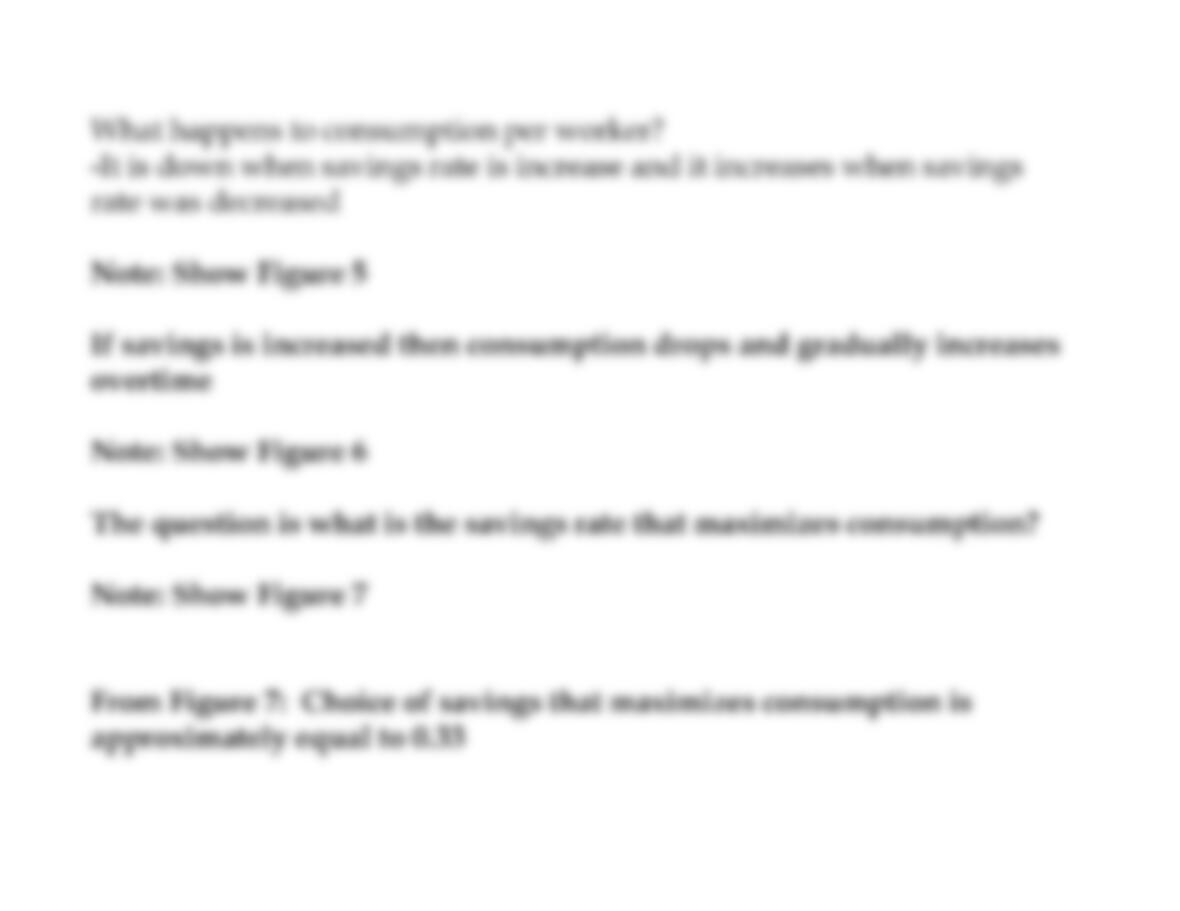
Note: Show Figure 3
k*g– golden rule level of capital which means it maximizes
consumption
k*g– Golden Rule Level of Capital: Definition: First off its self-
sustaining or steady state hence k*if we set/chooses this level of
capital we are going to set the savings rate that keeps us there
forever. Second off, it’s the golden rule level of capital so the