General Electric Appliances
Raj Aghinotri has been promoted to District Sales Manager (DSM) for G.E. Appliances. His first
important task was the determination of sales quotas for his district’s five sales representatives. He
received the quota for 2015 in October 2014. His immediate task was to determine equitable quotas for the
sales force. The reason this was important is that the company’s incentive plan was based on quota
achievement. A portion of Raj’s compensation was also based on the degree to which sales reps met quota.
Raj joined G. E. Appliances in 2008. He started as a product manager for refrigerators, his
primary responsibility being the creating and merchandising of product lines, developing products, and
developing marketing plans. In 2011 he was transferred to another position – sales manager for industrial
plastics. In 2014, when the position of district sales manager opened, Raj received the promotion. His
primary duties are development of sales strategies, supervision of sales reps, and budgeting.
COMPETITION
Competition in the appliance industry is vigorous. The Canadian Manufacturing Appliance Company
(CAMCO, created under joint ownership of Canadian General Electric, Ltd. and General Steel Wares, Ltd.,
is the largest firm in the industry with about 45 percent share, split between G.E. Brands and Hotpoint.
Three other firms had 10- 15 percent share:
• Inglis (washers and dryers only)
• W. C. I. (makers of Westinghouse, Kelvinator and Gibson)
• Admiral
These firms also produced appliances under such brand names as Viking, Baycrest, Kenmore, which
accounted for about 15 percent of the market. The remainder of the market was divided among brands like
Maytag, Roper, Gurney, Tappan, and Danby.
G.E. marketed a full major appliance line including refrigerators, ranges, washers, dryers, dishwashers, and
televisions. G. E. appliances generally had many features and were priced at the upper end of the price
range. Their major competition came from Westinghouse and Maytag.
THE BUDGETING PROCESS
G. E. Appliances is an advanced firm in the consumer goods industry in terms of sales budgeting.
Budgeting receives careful analysis at all levels of management.
The budgeting process starts in June, and is done annually. The management of G.E. Appliances assesses
economic outlook, growth trends in the industry, competitive activity, population growth, and other data to
determine a reasonable target for the coming year. This estimate is sent to the president of CAMCO who
may revise it as needed and then sends it to the president of G. E. where final authorization occurs. G. E.
always has a minimum growth target for CAMCO. Appliances are considered an “invest and grow”
division which means it is expected to produce healthy sales growth each year, regardless of the state of the
economy. As Raj observed, this is difficult, but meeting challenges is the job of management,”
The approved budget is expressed as a desired percentage increase in sales. Once the figure is decided
upon, it cannot be changed. The quota was communicated to CAMCO and G. E. Appliances where it was
made available to district managers in October. Each district is then required to meet an overall quota, but
each territory was not automatically expected to achieve the same growth. Ray was charged with assessing
the situation in each territory, determining where the growth potential was highest and allocating quota
accordingly.
THE SALES INCENTIVE PLAN
The sales incentive plan was a critical part of G. E.’s sales force plan and an important consideration in the
quota allocation of Raj. Each sales rep had a portion of his/her earnings dependent on his/her performance
with respect to quota. Also, Raj was awarded a bonus based on sales performance of the district making it
advantageous to Raj and good staff morale for all sales reps to achieve quota.
The sales force incentive plan is relatively simple. A bonus system is fairly typical for sales reps in any
field. With G. E., each sales rep agreed to a basic salary figure called “planned earnings.” The planned
salary varied according to experience, education, past performance, and competitive salaries. A sales rep
was paid 75 percent of his/her planned earnings on a guaranteed regular basis. The remaining 25 percent of
salary was at risk, dependent on the sale rep’s record. There was also the possibility of earning
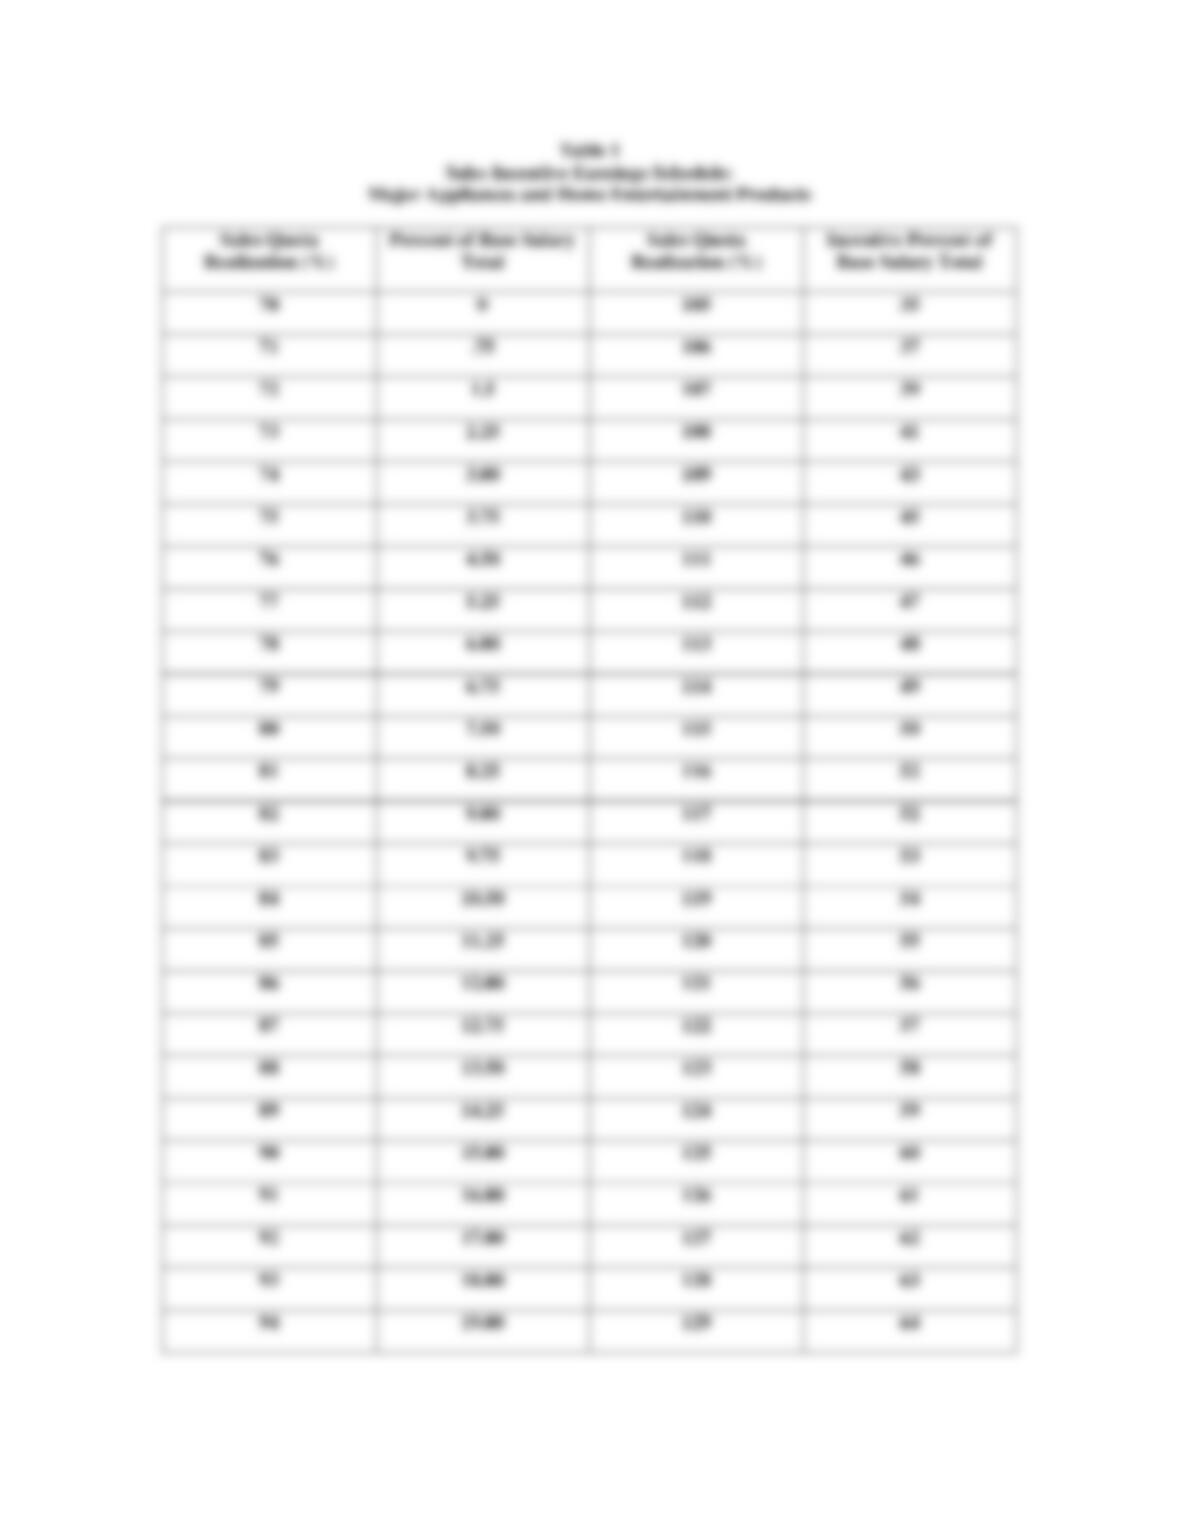
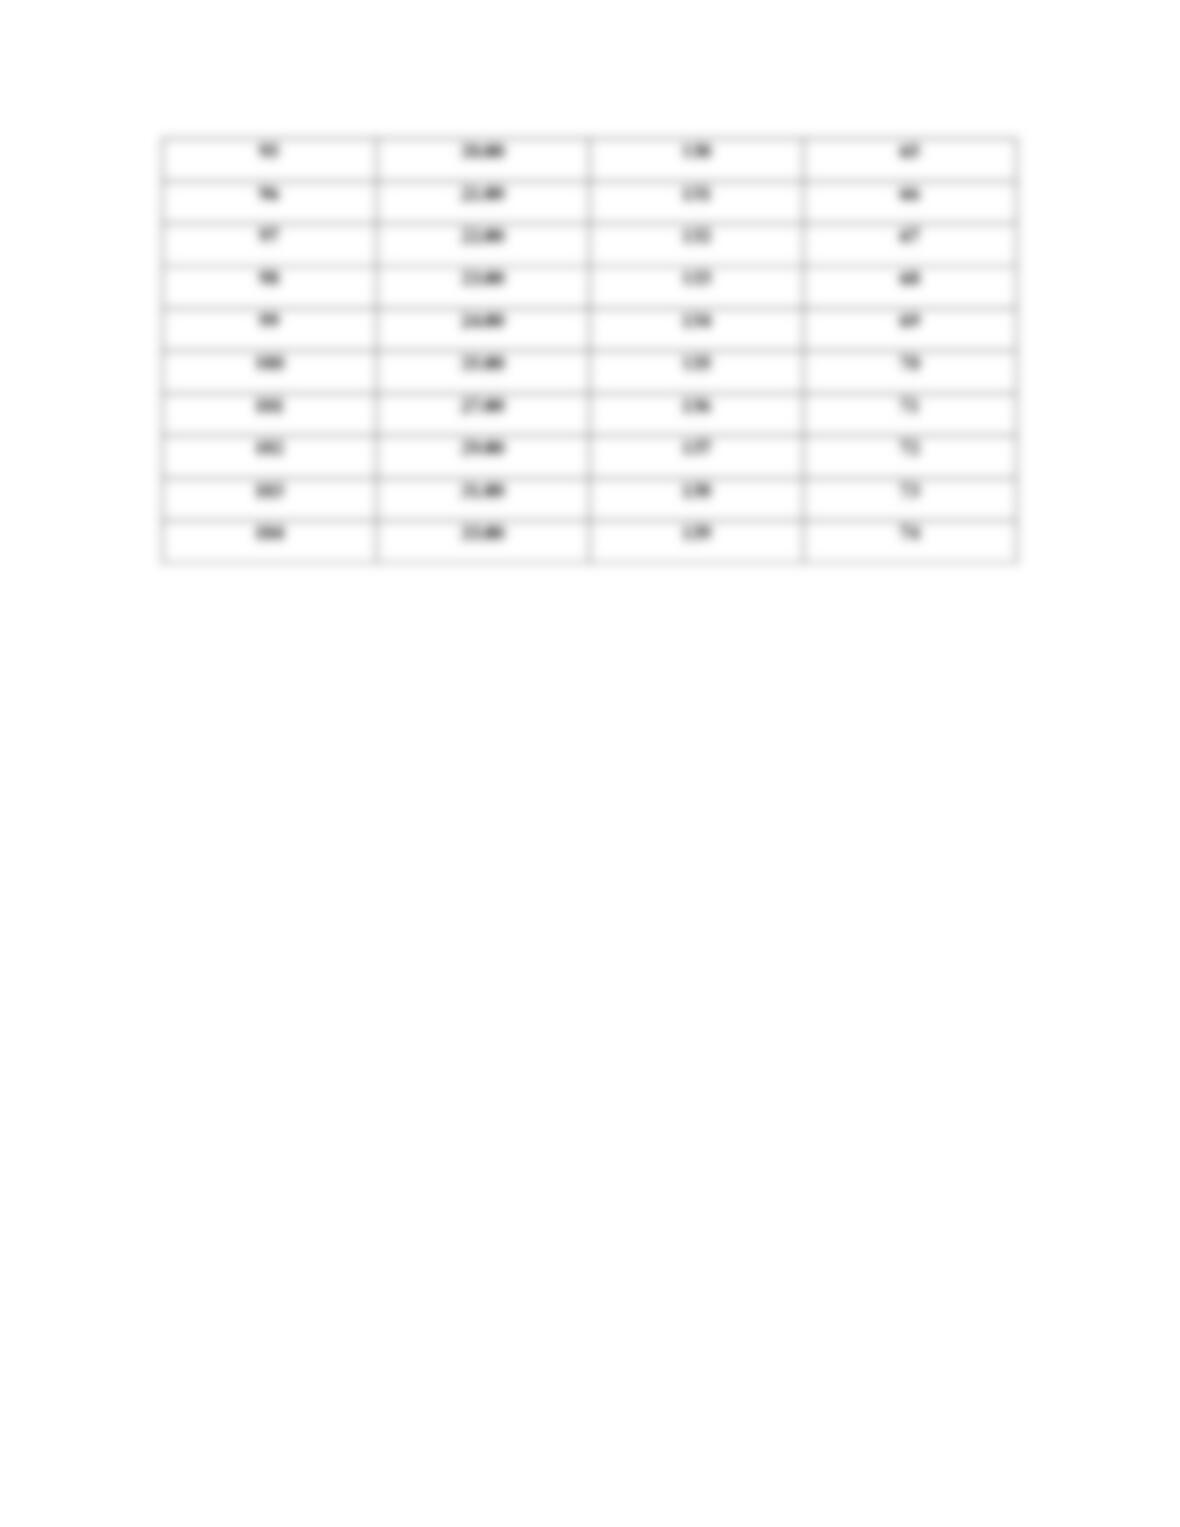
substantially more money by selling more than quota (see Table 1.).
The bonus was awarded such that total salary (base plus bonus) equaled planned earnings when the quota
was just met. The greatest increase in bonus came between 101 and 110 percent of quota. A holdback
system assured that a sales rep was never required to pay back previously earned bonus because of a poor
quarter. Because of this system it was critical that each sales rep‘s quota be fair in relation to quotas of
other dales reps. Nothing was worse for morale than one person earning large bonuses while others
struggled.
Quota achievement was not the sole basis for performance evaluation. They were required to fulfill a wide
range of duties including service, franchising of new dealers, maintenance of good relations with dealers,
and maintaining a balance of sales among product lines. Because the bonus system was based on sales only,
Raj had to ensure that sales reps did not neglect their other duties.
A formal salary review was held each year for each sales rep. However, Raj preferred to give his sales reps
continuous feedback on their performance. Through human relations skills, he hoped to avoid problems
that could lead to dismissal of sales reps and loss of sales to the company.
Raj’s incentive bonus plan was more complex than that of the sales reps. He was awarded a maximum of
75 annual bonus points broken down as follows: market share – 15; total sales performance – 30; sales rep
balance – 30. Each point had a specific monetary value. The system insured that Raj allocate sales quotas
carefully. For example, if one quota was so difficult that the rep sold only 80 percent of it, while the other
reps exceeded quota, Raj’s bonus would be reduced, even if the overall area sales exceeded quota (see
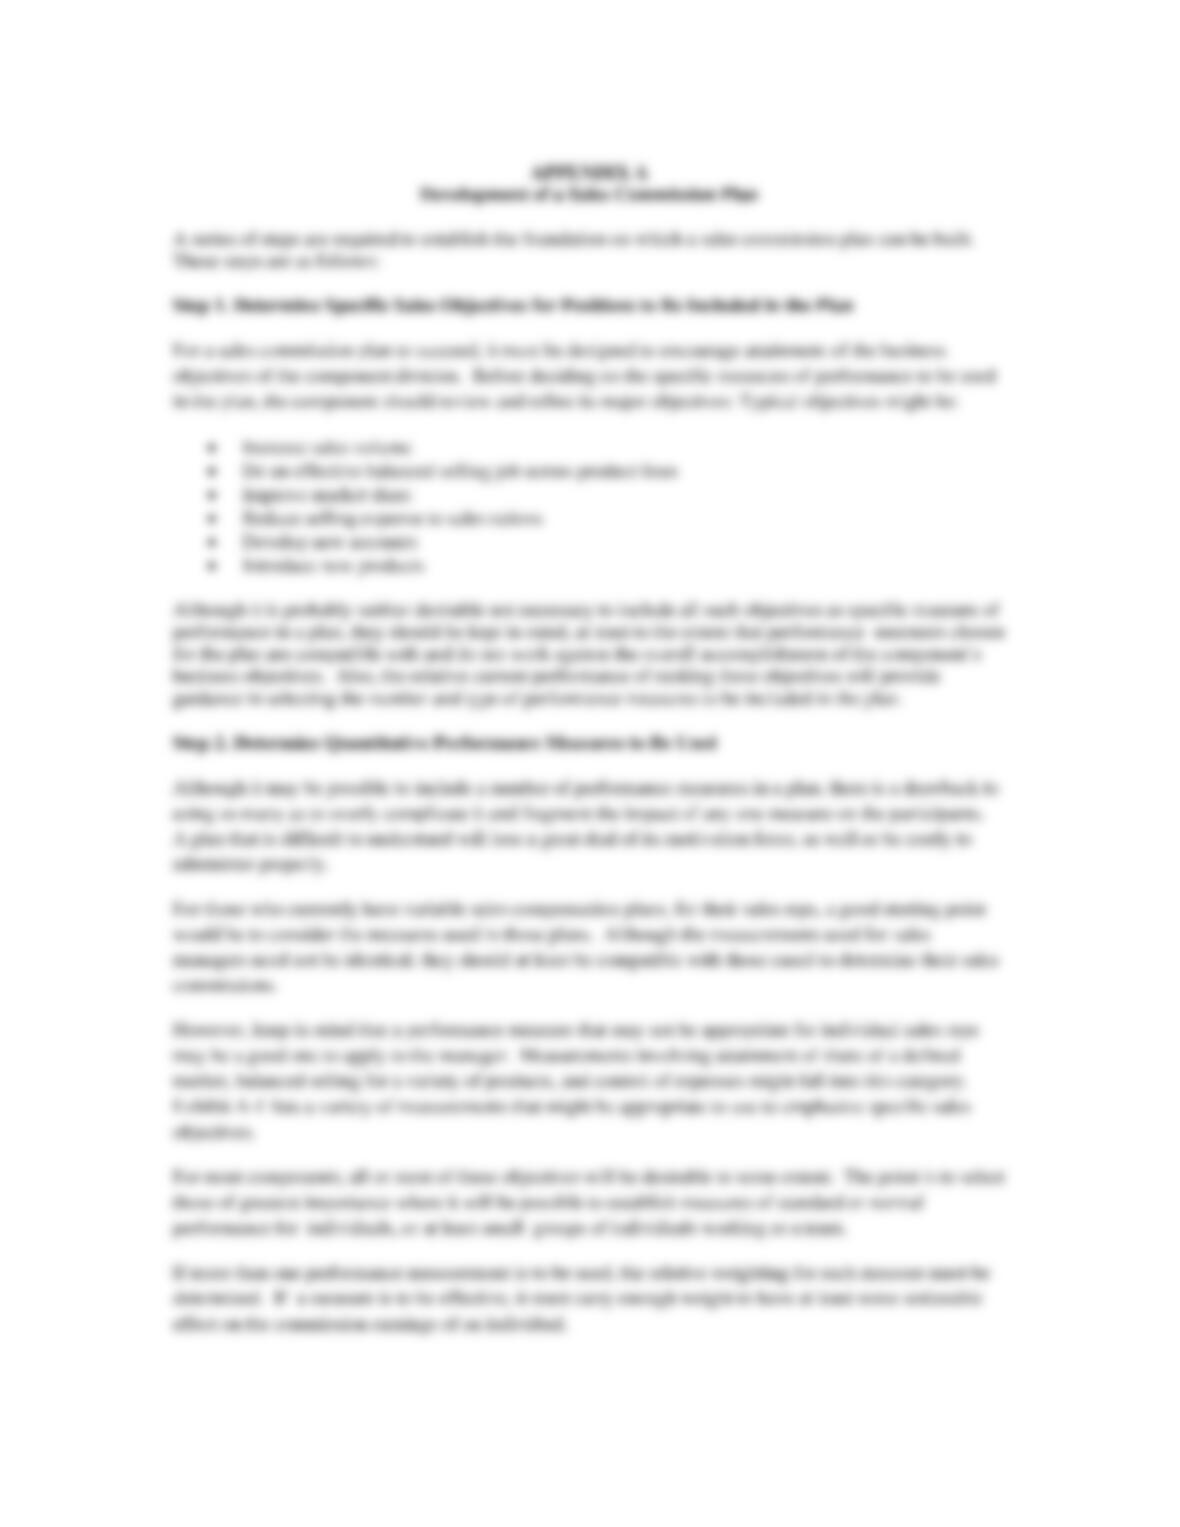
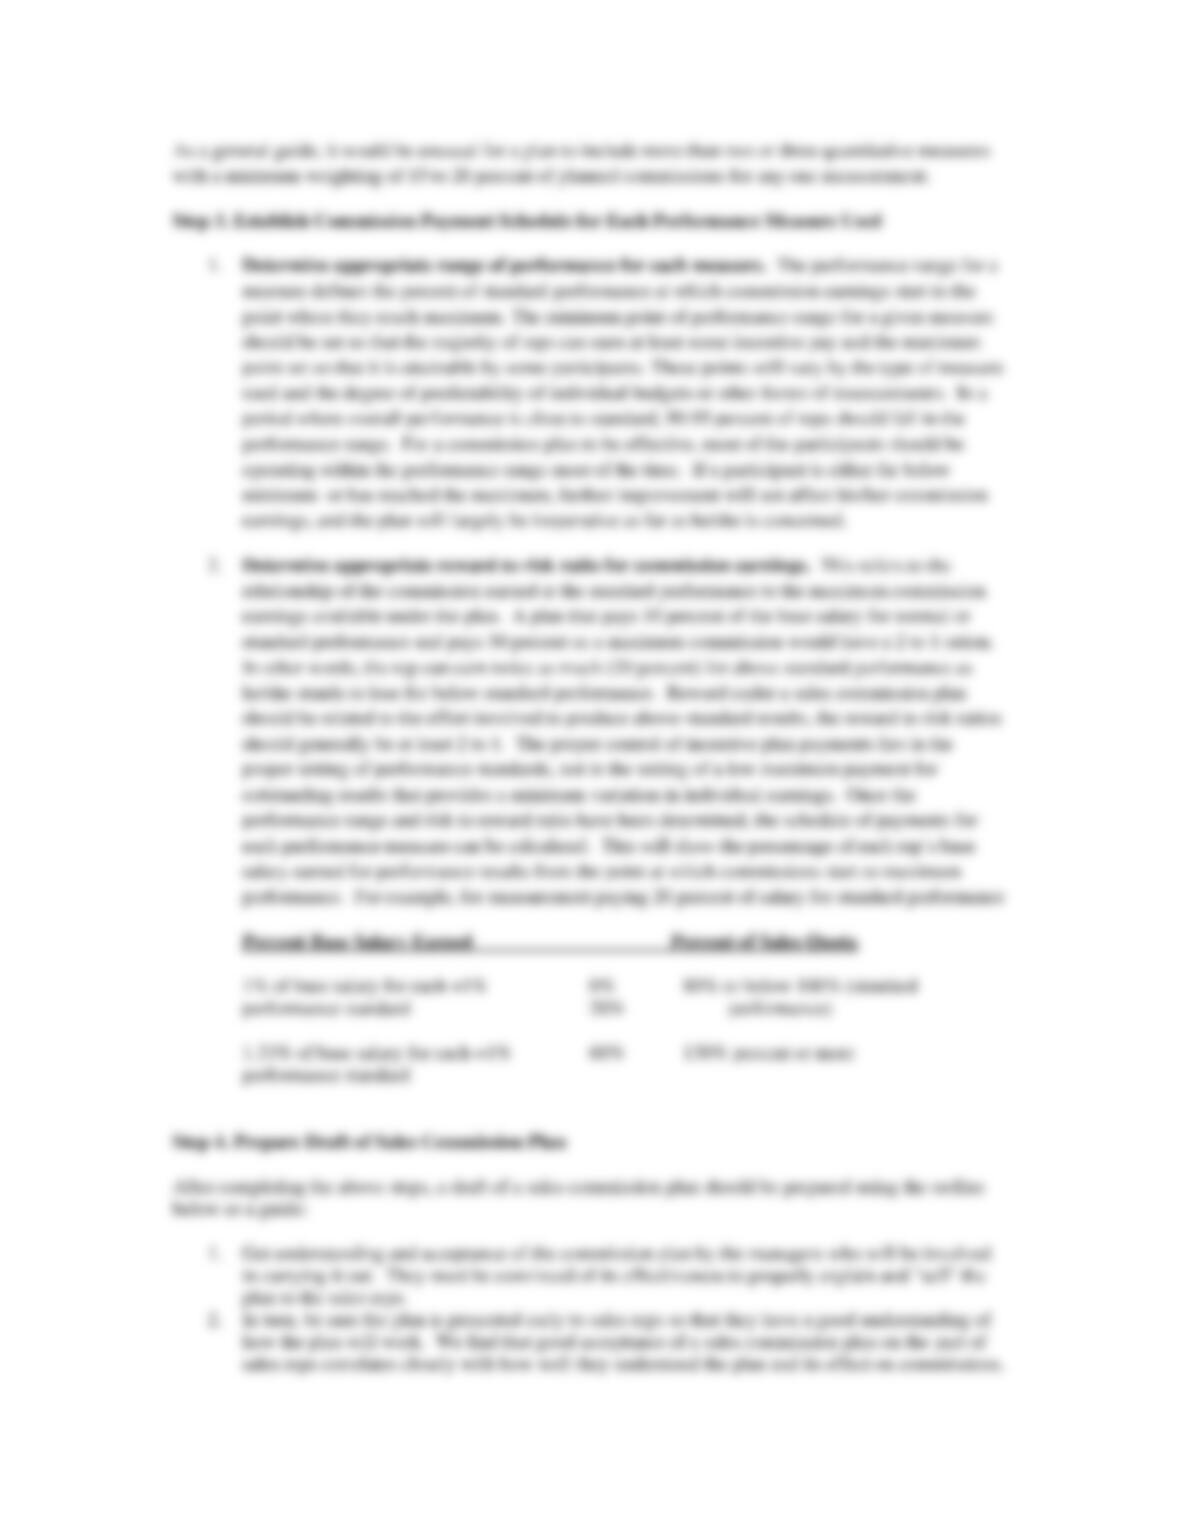
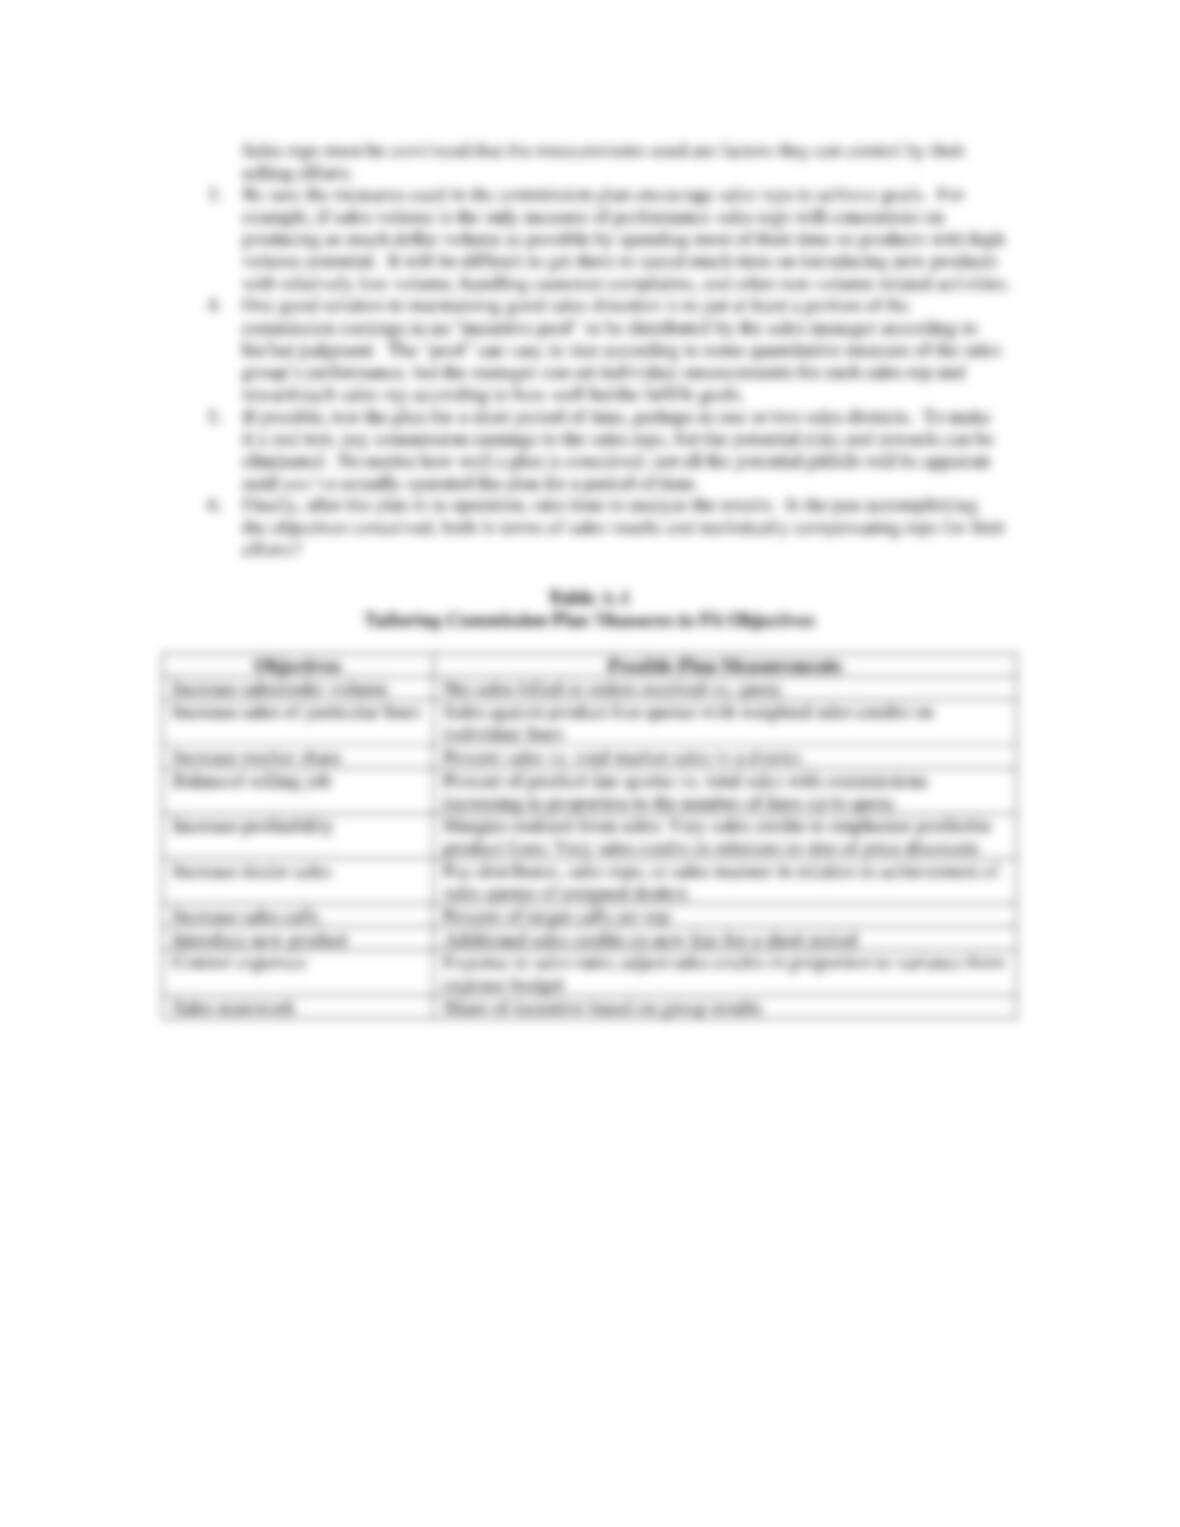
appendix – Development of a Sales Commission Plan)
QUOTA ALLOCATION
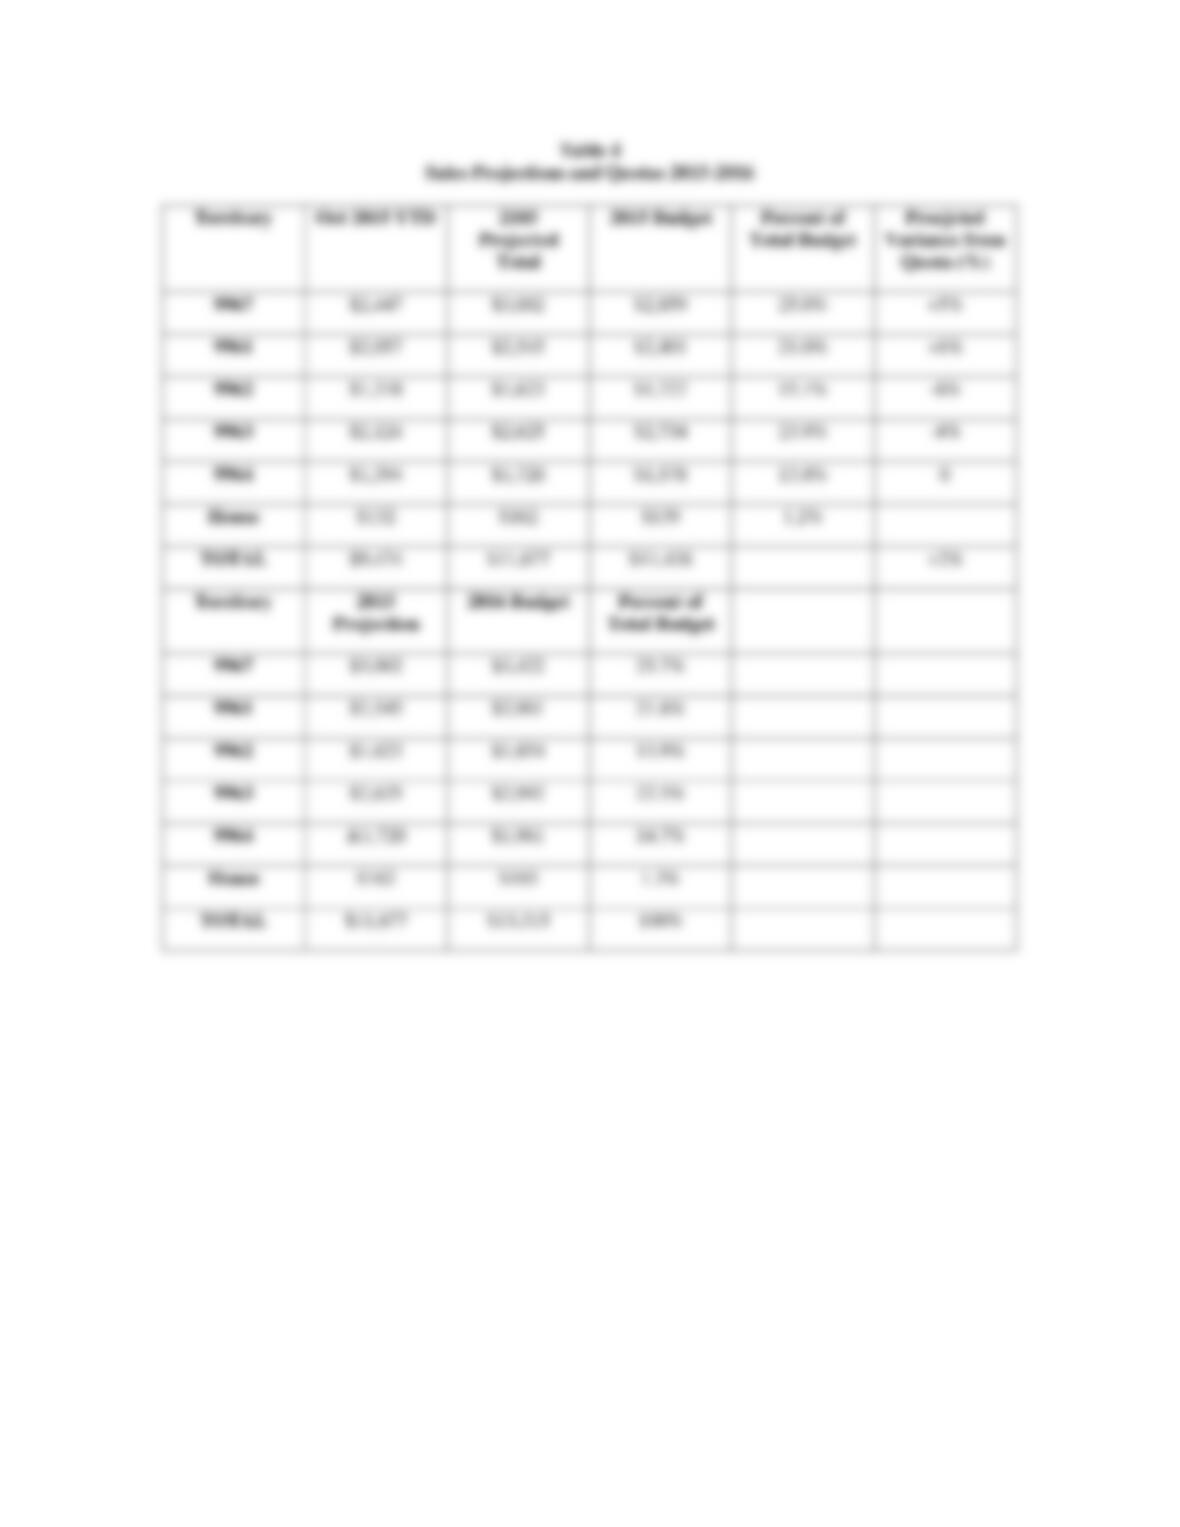
The 2015 Sales budget for the G. E. Appliances Division was about $100 million, a 14 percent increase
over 2012. Raj’s share of the $33 million Western Region quota was $13.3 million, also about a 14 percent
increase over 2012. Raj had two weeks to allocate the sales quota across his five territories. He needed to
consider factors such as historical allocation, economic changes, dealer changes, personnel changes,
untapped potential, new franchises or store openings, and buying group activity (volume purchases by
associations of independent dealers).
Sales Force
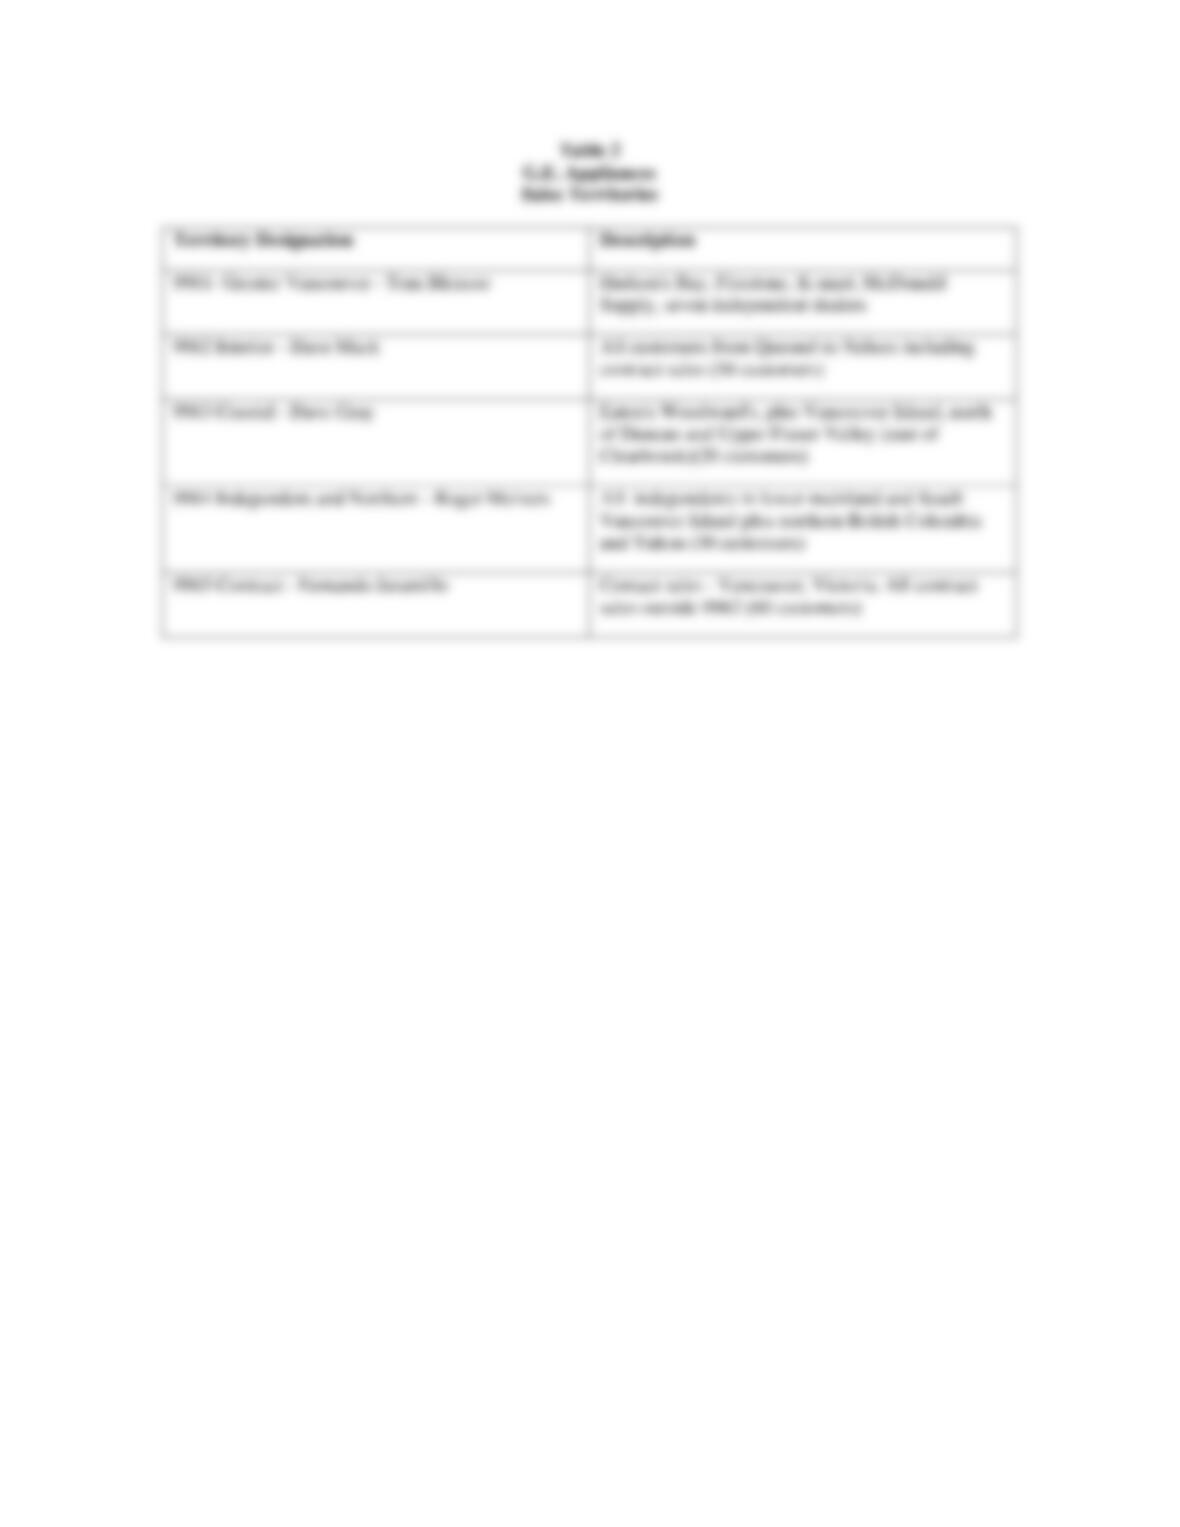
There were five sales territories accountable to Raj (see Table 2). Territories were determined on the basis
of number of customers, sales volume of customers, geographic size, and experience of the sales reps.
Territories were altered periodically to deal with changed circumstances. One territory was comprised
entirely of contract customers. Contract sales were sales in bulk to builders and developers who used
appliances in housing units. Because appliances were not resold at retail, G. E. took a lower profit margin
on such sales.
Allocation Procedure
At the time Raj assumed the job of district sales manager, he had a meeting with the former sales manager,
Myalinda Martinez. Martinez described to Raj the method she had used to allocate quota. As Raj
understood it, the procedure was as follows.
• The quota was received in October in the form of a desired percentage of sales increase. The first
step was to project current sales to the end of the year. This gave a base to which the increase was
added for an estimation of next year’s quota.
• From this quota, the value of contract sales was allocated. Contract sales were allocated first
because the market was considered easiest to forecast. The amount of contract sales in the sales
mix was constrained by the lower profit margin on such sales.
• The next step was to make a preliminary allocation by simply adding the budgeted percentage
increase to the year-end estimates for each territory. Although this allocation seemed fair on the
surface, it did not take into account different situations in the territories, or the difficulty of
attaining such an increase.
• The next step was the examination of the sales Data compiled by G.E. Weekly sales reports from
all regions were fed into a central computer which compiled them and printed out sales totals by
product line for each customer, as well as other information. This information enabled the sales
manager to check the reasonable ness of his/her initial allocation through a careful analysis of the
growth potential for each customer. The analysis began with the largest accounts such as
Firestone, Hudson’s Bay and Eaton’s – all of these bought over $1 million in appliances annually.
Accounts that size were expected to achieve at least the budgeted growth. The main reason for
this was that a shortfall of a few percentage points on such a large account would be difficult to
make up elsewhere.
• Next, the growth potential for medium-sized accounts was estimated. These accounts included
McDonald Supply, Kmart, Federated Cooperative and buying groups such as Volume Independent
Purchasers (V.I.P.). Management expected the majority of sales growth to come from these
accounts which had annual sales of $150,000 to $1 million. At this point approximately 70
percent of accounts had been analyzed. The small accounts were estimated last. These had
generally lower growth potential but were an important part of the company’s distribution system.
• Once all the accounts had been analyzed, the growth estimates were summed and the total
competed to the budget. Unusually, the growth estimates were well below the budget. The next
step was to gather more information, the sales reps were usually consulted to ensure that potential
trouble areas or good opportunities had not been overlooked. The manager continued to revise and
adjust the figures until the total estimated matched the budget. These projections were then
summed by territory and compared to the preliminary territorial allocation.

• Frequently, there were substantial differences between the two allocations. Historical allocations
were then examined and the manager used his/her judgment in adjusting the figures until he/she
was satisfied that the allocation was both equitable and attainable. Some factors that were
included at this stage included the experience –of the sale reps, competitive activities, potential
labor disputes in each area, and so forth.
• The completed allocation was padded on to the regional sales manager for his/her approval. The
process had usually taken one week or longer by this stage. Once the allocations had been
approved, the district sale manager then divided them into sales quotas for reach product line.
Often the resulting average price did not match the expected ix between higher and lower priced
units. Therefore some additional adjusting of figures was necessary. The house account (used for
sales to employees by the company) was used as the adjustment factor.
• Once this breakdown had been completed, the numbers were printed on a budget sheet and given
to the regional sales manager. He/she forwarded all sheets for his/her region to the central
computer, which printed out sales numbers for each product line by sales rep, by month. These
figures were used as the sales rep’s quota for next year.
CURRENT SITUATION
Raj recognized that he faced a difficult task. He thought he was too new to the job and the area to
confidently undertake an account–by-account growth analysis. However, due to his previous experience
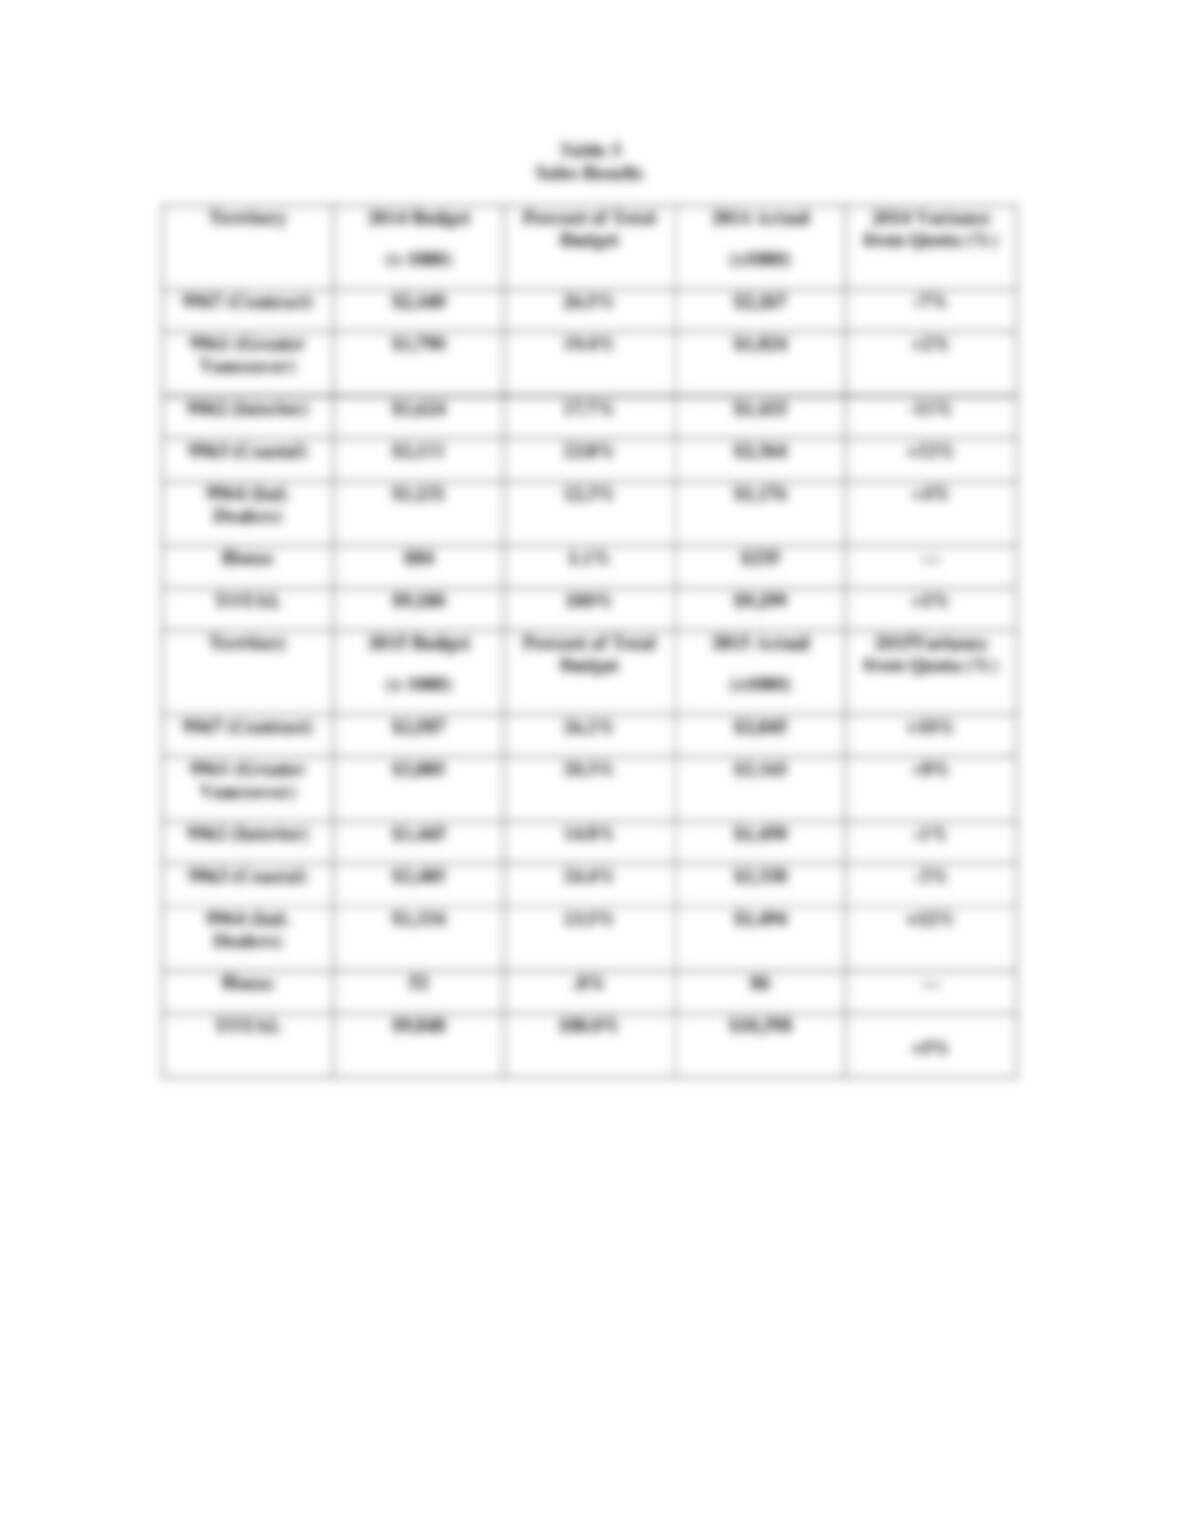
with sales budgets, he did have some sound general ideas. He also had the records of past allocation and
quota attainment (Table 3) as well as the assistance of the regional sales manager, Ryan Freling.