Nike Inc.
2016
Financial Analysis Report
Prepared by: Julia Garcia
155 Summit Street
Newark, NJ 07103
908-906-8500
1
Contents
Research Summary……………………………………………………………… 3
REPORT…………………………………………………………………………. 22
Company Description ……………………………………………………… 8
SWOT Analysis…………………………………………………………….. 9
Valuation…………………………………………………………………….11
News…………………………………………………………………………12
Financial Statement Analysis……………………………………………….16
Ratio…………………………………………………………………………18
Company Investment Valuation…………………………………………… 21
DCF…………………………………………………………………………..22
Sources Used…………………………………………………………………….. 23
Appendix 1…………………………………………………………………………33
Appendix 2…………………………………………………………………………38
2
Research Summary
Nike Inc. is an American company that is part of the athletic apparel and footwear industry.
The company trades its stock at the New York Stock Exchange.
Profitability
Nike Inc. has managed over the past 5 years to have on average a 10% return on its sales. In
addition, the company has been able to maintain a 15% return on assets in 2015, and thanks to its
effective management the company has had a return on equity of 25%. Free cash flow has been
growing since 2011 and it has reached 3,677 million dollars. Finally, the company’s earnings per
share has been growing steadily from 2,24 dollars in 2011 to 3,70 in 2015.
Financial Risk
Over the past 5 years, the company has managed to stay in a very good financial health. This
last year Nike Inc. had a financial leverage of 1,72. In addition, the company increased its working
capital from 9,521 million dollars in 2011 to 9,642 in 2015. The firm’s current debt ratio is 41.71%,
which can be considered a fair value since the company primarily finances its activities with its
shareholders capital.
Quality of Income
Nike has increased its quality of income ratio from 0,83 in 2011 to 1,43 in 2015. This indicator
suggests that for every dollar of net income Nike earned a dollar in sales.
3
Sustainable Economic Moat
Nike Inc. has a very sustainable economic moat because it has many well-known and strong
brands like Nike, Jordan or All-Star that are able to attract most customers from the athletic apparel
and footwear industry. In addition, the company has a fair pricing power that allows it to put a
premium price on its products without experiencing a change in demand.
DuPont Analysis
Nike’s main competitors Adidas and Under Armour are not managing to get any market share
from the firm. In 2015 Nike’s ROS doubled Under Armour’s 5,87% and Adidas’ 3,75%. Nike’s
outstanding ROS drives up all other profitability ratios. In 2015, Nike got a 25% ROE while Adidas
got a 11,23% and Under Armour a 15,41%. In conclusion, Nike is doing better than any of the other
companies in the same industry.
Significant Events
This 2016 the firm has invested heavily in R&D and it is ready to launch new and innovative
products mainly for the big events that will be hold in 2016, being the Summer Olympics its major
display.
Investment Decision
Nike is a great company with a very sustainable economic moat. Nevertheless, the company’s
stock is overpriced currently in the market.
4
Appendix B: Research Summary
Prepared by: Julia Garcia Date: 04/12/2016
1. Industry Name: Athletic Apparel and Footwear
2. Company Name: Nike
3. Nike Analysis
Profitability Strong
Financial Risk Low Risk
Quality of Income Strong
Economic Moat Yes
10 – Minute Test Pass
4. DuPont Analysis of ROE
Ratio ROS Asset T/O ROA FinLEV ROE
Nike 10,71% 1.42 15.15% 1.70 25.76%
Appare
l
11,42% 1.51 17,22% 1.68 28,58%
S&P Av 10% 1.00 10% 2.50 25%
5

Company Description
Introduction
Nike is an American corporation that sells and produces athletic equipment, apparel, footwear
and different accessories worldwide. The company’s headquarter is near Beaverton, Oregon.
According to Reuters, Nike is the largest supplier of athletic apparel and shoes, as well as a major
manufacturer of sports equipment. Last year Nike had revenues of US$30,061, and according to
Forbes its brand is one of the most valuable among sport businesses.
History
Nike was founded in January of 1964 by track athlete Phil Knight and his coach Bill
Bowerman. The company’s original name was Blue Ribbon Sports (BRS) and it distributed Japanese
Onitsuka Tiger shoes. After two years of growing sales, BRS opened its first retail store in Santa
Monica, California. Nevertheless, it was not until 1971 when BRS launched its own line of footwear
which would bear its characteristic Swoosh that had just been designed by Carolyn Davidson. In
1980, the company went public after attaining around 50% market share in the United States athletic
shoe market. From 1980s until the present, Nike has expanded its line of products as well as its
markets.
Industry
The athletic apparel, footwear and equipment industry is highly competitive. Nike competes
internationally with several athletic footwear and apparel companies including Adidas, Li Ning,
lululemon athletica, Puma, V.F. Corp., Under Armour and UNIQLO. There are significant risk
factors in the company’s operations that include the intense competition and the rapid changes in
technology and consumer preferences of the industry. Some important aspects of competition in the
industry are: product attributes like quality, performance and reliability, new product innovation and
development, consumer connection and affinity for brands and products, effective sourcing and
6
distribution of products, and identification with influential athletes, coaches, teams, colleges and
sports leagues.
Products
Nike focuses its brand product offering in eight key categories: Running, Basketball, Soccer,
Men’s and Women’s Training, Action Sport, Sportswear and Golf.
Nike’s athletic footwear and apparel are products that are designed for specific athletic use, but they
can be worn for casual or leisure purposes. The company places a great effort in creating high-quality
and innovative products that are top selling in the market. The firm also sells a line of performance
equipment and accessories which includes bags, socks, sport balls, eyewear, timepieces, digital
devices, bats, gloves, protective equipment, golf clubs and other equipment designed for sports
activities.
In addition to these products, Nike owns companies Hurley which sells a line of action sports and
youth lifestyle apparel and accessories, and Converse which sells casual sneakers, apparel and
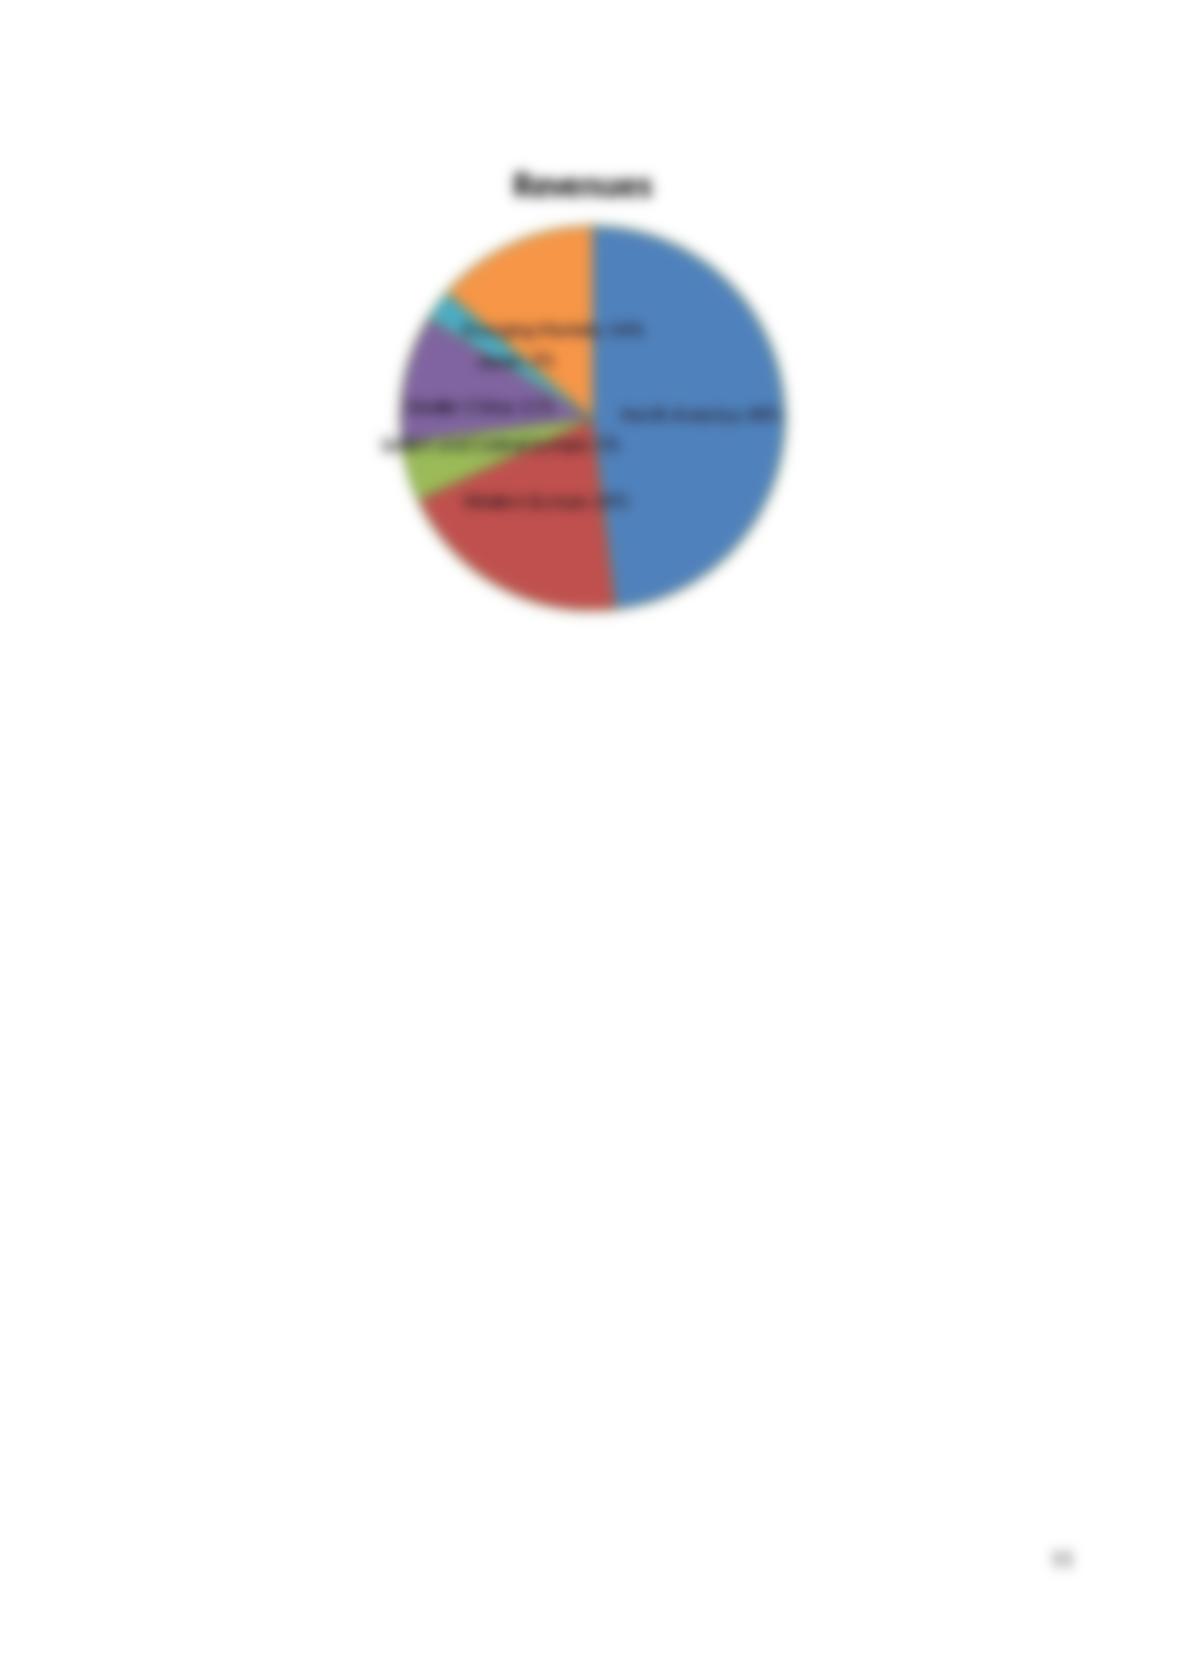
North America; 48%
Western Europe; 20%
Eastern and Central Europe; 5%
Greater China; 11%
Japan; 3%
Emerging Markets; 14%
Revenues
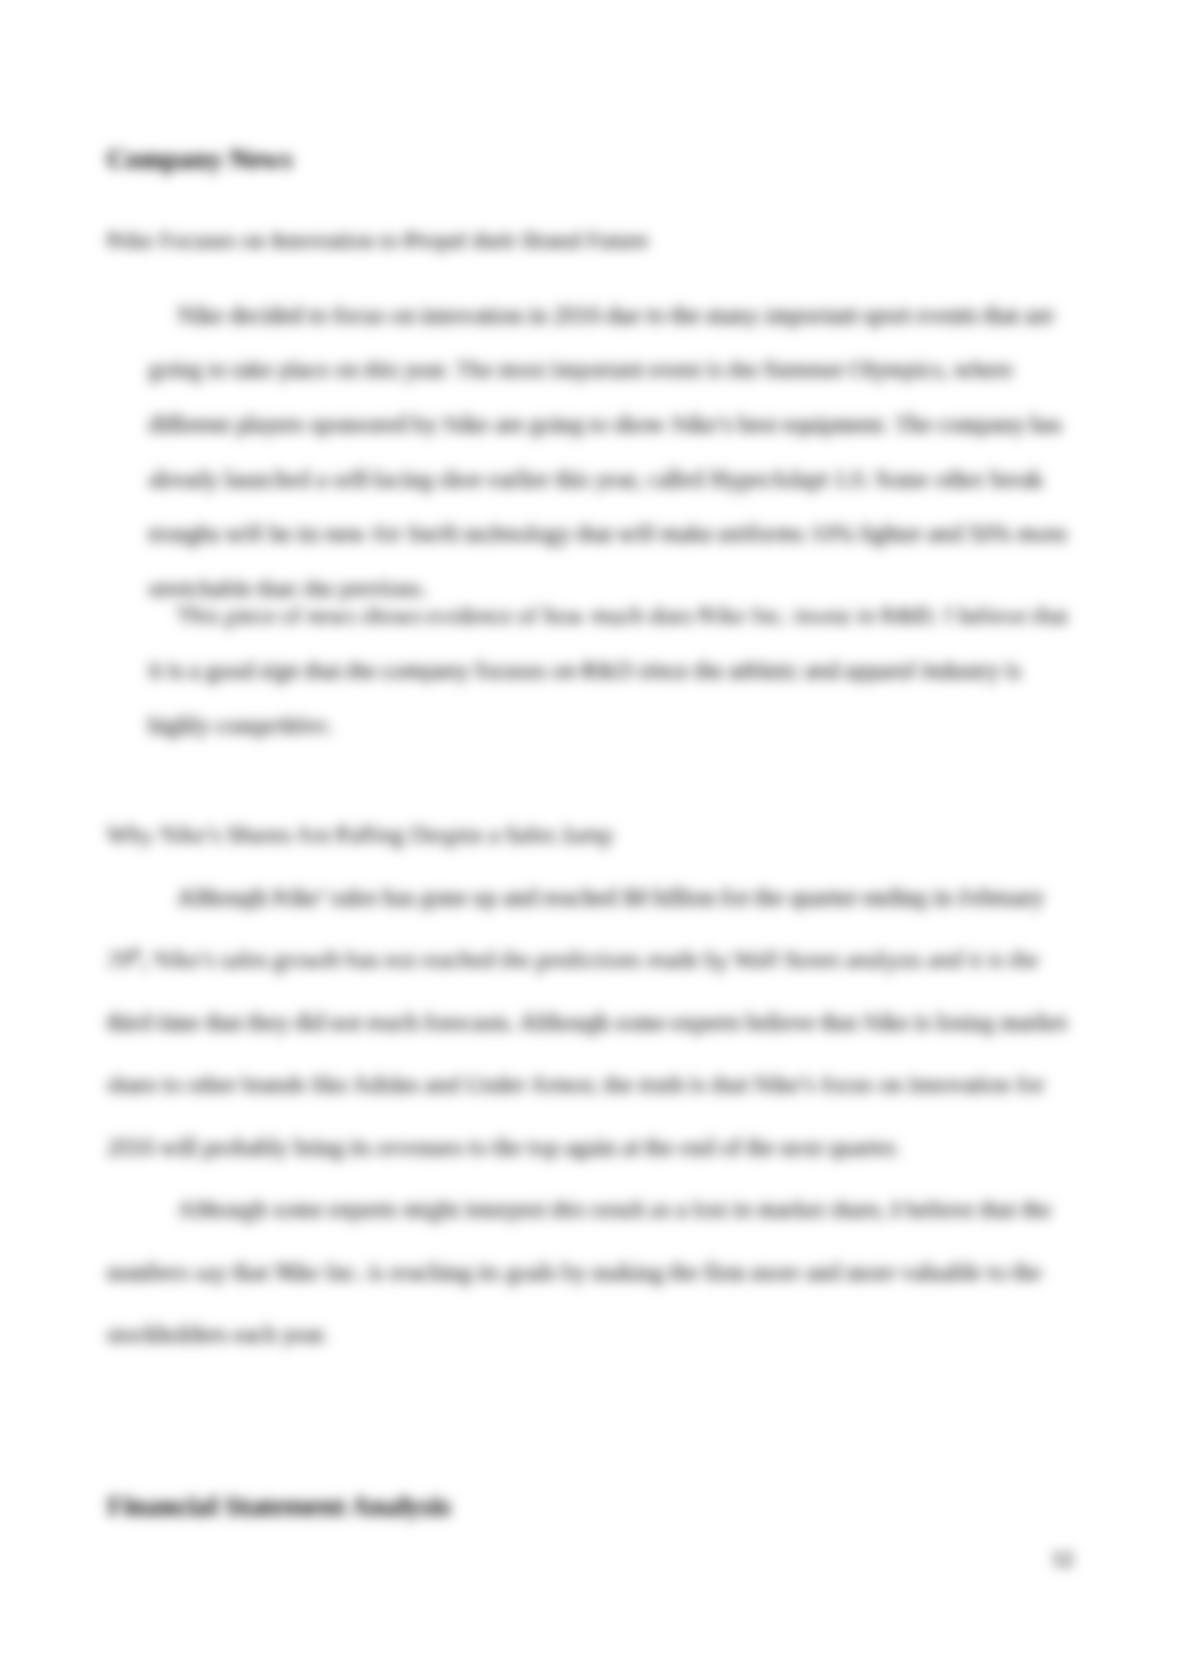
2011 2012 2013 2014 2015
0
5000
10000
15000
20000
25000
30000
35000
40000
45000
50000
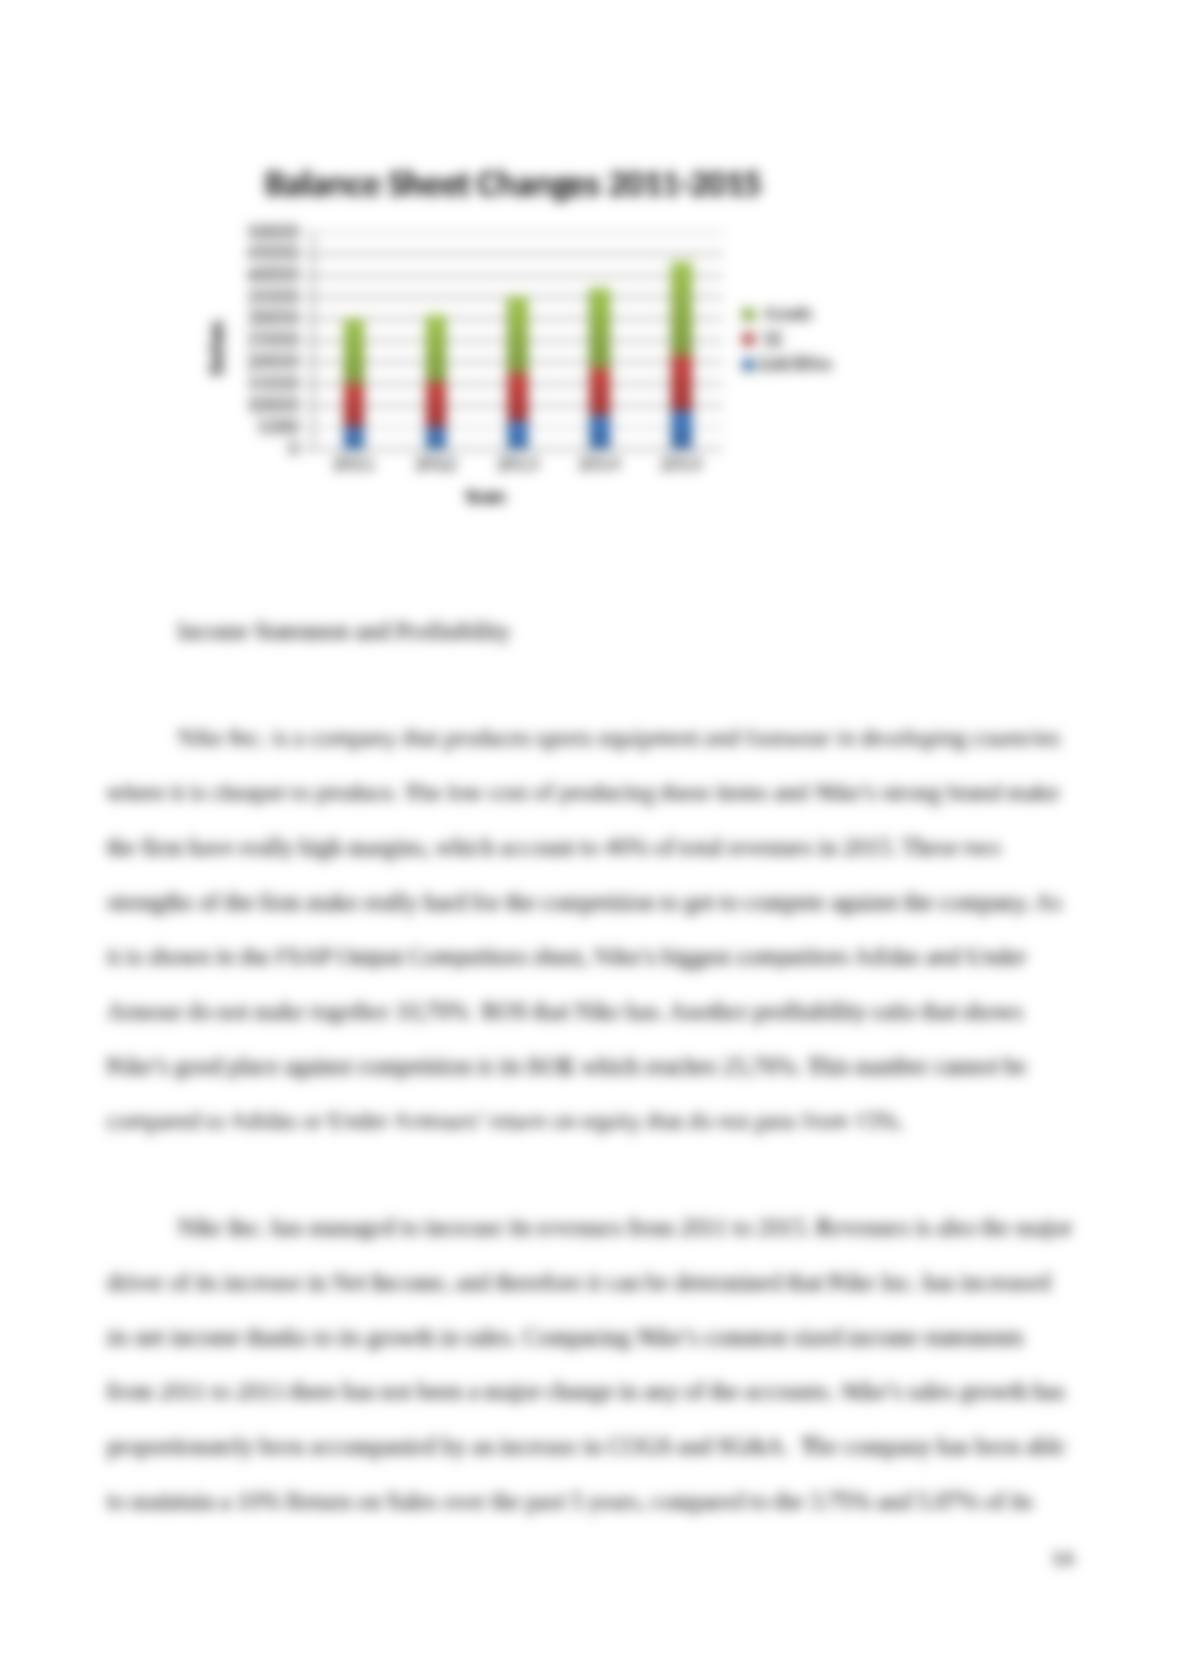
Balance Sheet Changes 2011-2015
Assets
SE
Liabili*es
Years
Dollars
Income Statement and Profitability
Nike Inc. is a company that produces sports equipment and footwear in developing countries
where it is cheaper to produce. The low cost of producing these items and Nike’s strong brand make
the firm have really high margins, which account to 46% of total revenues in 2015. These two
strengths of the firm make really hard for the competition to get to compete against the company. As
it is shown in the FSAP Output Competitors sheet, Nike’s biggest competitors Adidas and Under
Armour do not make together 10,70% ROS that Nike has. Another profitability ratio that shows
Nike’s good place against competition is its ROE which reaches 25,76%. This number cannot be
compared to Adidas or Under Armours’ return on equity that do not pass from 15%.
Nike Inc. has managed to increase its revenues from 2011 to 2015. Revenues is also the major
driver of its increase in Net Income, and therefore it can be determined that Nike Inc. has increased
its net income thanks to its growth in sales. Comparing Nike’s common sized income statements
from 2011 to 2015 there has not been a major change in any of the accounts. Nike’s sales growth has
proportionately been accompanied by an increase in COGS and SG&A. The company has been able
to maintain a 10% Return on Sales over the past 5 years, compared to the 3.75% and 5.87% of its
14