©2013 O.S. Financial Trading System
Financial Statement Analysis Module
Sample Assignments and Exercises Using the FSA Module
©2013 O.S. Financial Trading System
Contents
1. Explore Financial Statements
Assignment 1.1: Match the business model
Assignment 1.2: Understanding Analyst Earnings’ Forecasts using Common Size Analysis
Assignment 1.3: Reading and Interpreting Derivatives Accounting
2. Analyzing Profitability
Assignment 2.1: Analyzing Accounting or Fundamental Growth
Assignment 2.2: How did competition impact financial performance?
Assignment 2.3: How Should Vodafone Spend Verizon’s $130 billion?
3. Working Capital
Assignment 3.1: Match the Business
Assignment 3.2: Impact of operational strategy in the beverage industry upon working
capital management
4. Risk
Assignment 4.1: Analyzing Risk
Assignment 4.2: Activity Analysis
©2013 O.S. Financial Trading System
Assignment 1.1: Match the Business Model
Introduction
The point has been often made in class that a firm’s business model is a major driver of a firm’s
Balance Sheet (or Statement of Financial Position). In this assignment your task as an analyst is
reversed. That is, given 10 common size financial statements and 10 different business
descriptions can you identify which financial position is associated with each business
description?
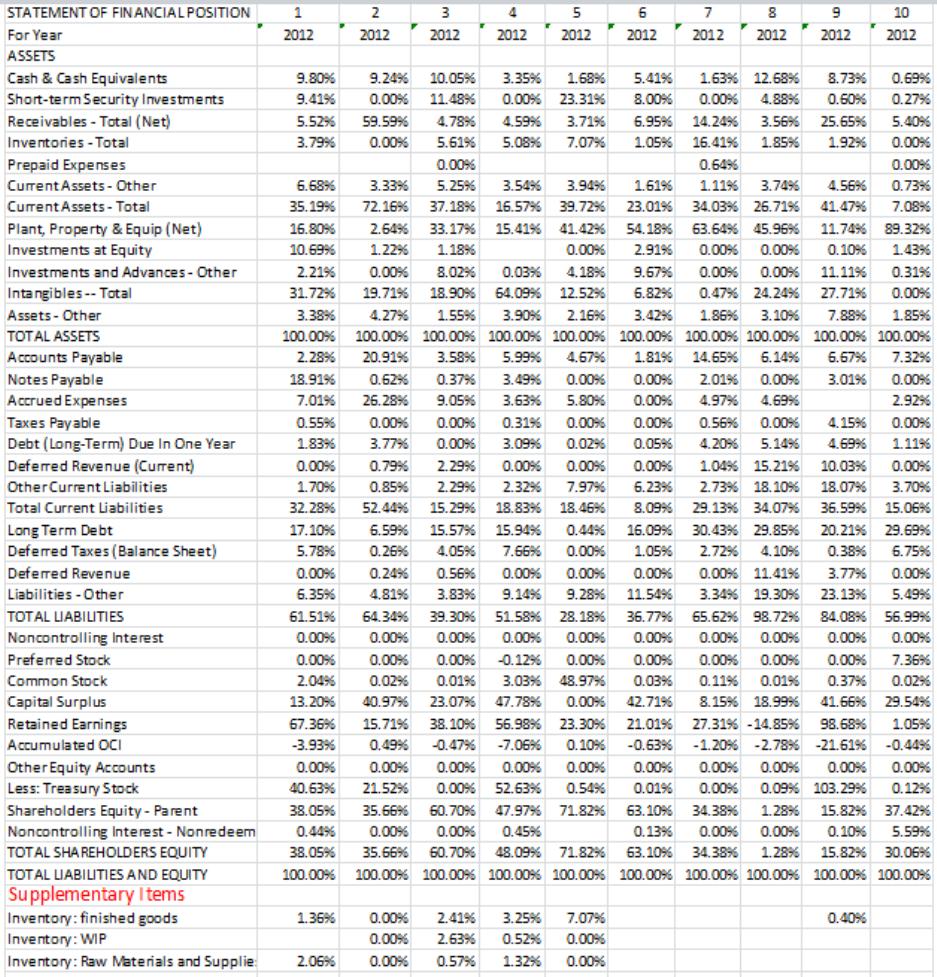
The following data is provided for 10 major companies in common size form (numbered 1-10)
constructed from the FSA Module. That is, each stock’s data is size adjusted. The common size
statements use Total Assets as the scaling variable.
Brief Business Description for the Ten Companies
A: This company engages in the manufacture, marketing, and sale of nonalcoholic beverages
worldwide.
B: This company operates general merchandise stores in the United States.
C: This company designs, manufactures, and sells integrated digital technology platforms
worldwide.
D: This company provides information technology (IT) products and services worldwide.
©2013 O.S. Financial Trading System
E: This company engages in the manufacture and sale of a range of branded consumer
packaged goods.
F: This company provides passenger and cargo air transportation services in the US and
globally.
G: This company provides workforce (i.e., hiring) solutions and services.
H: This company owns and operates a chain of natural and organic foods supermarkets.
I: This company engages in the acquisition, exploration, development, and production of
natural gas and oil properties in the United States. The company also offers marketing,
midstream, drilling, and other oilfield services.
J: A hospitality company, that manages, franchises, owns, and develops branded hotels,
resorts, and residential and vacation ownership properties worldwide. Its portfolio currently
consists of 508 properties in 46 countries.
Required: From the Common Size Consolidated Balance Sheets plus Supplementary
information your task is the following:
i. Match the numbered common size balance sheets (1-10), scaled by Total Assets, to
the letter descriptions of the companies (A-J). That is, match the numbers to the
letters.
ii. Provide brief reasons for how you chose the match. In particular, what particular
line items did you focus in on and why.
©2013 O.S. Financial Trading System
Common Size Financial Statements
©2013 O.S. Financial Trading System
Assignment 1.2: Understanding Analyst Earnings’ Forecasts using Common Size Analysis
Introduction
Income forecasts from financial analysts have a profound impact upon management and the decisions
they make. This is because earnings’ season not only affects the fortunes of investors but also the
success or failure of the management being rated. In turn, the financial analyst industry has become
increasingly competitive and is also subjected to close scrutiny from the popular financial press (e.g., the
current Bloomberg ratings provided on the course blackboard with assignment 4).
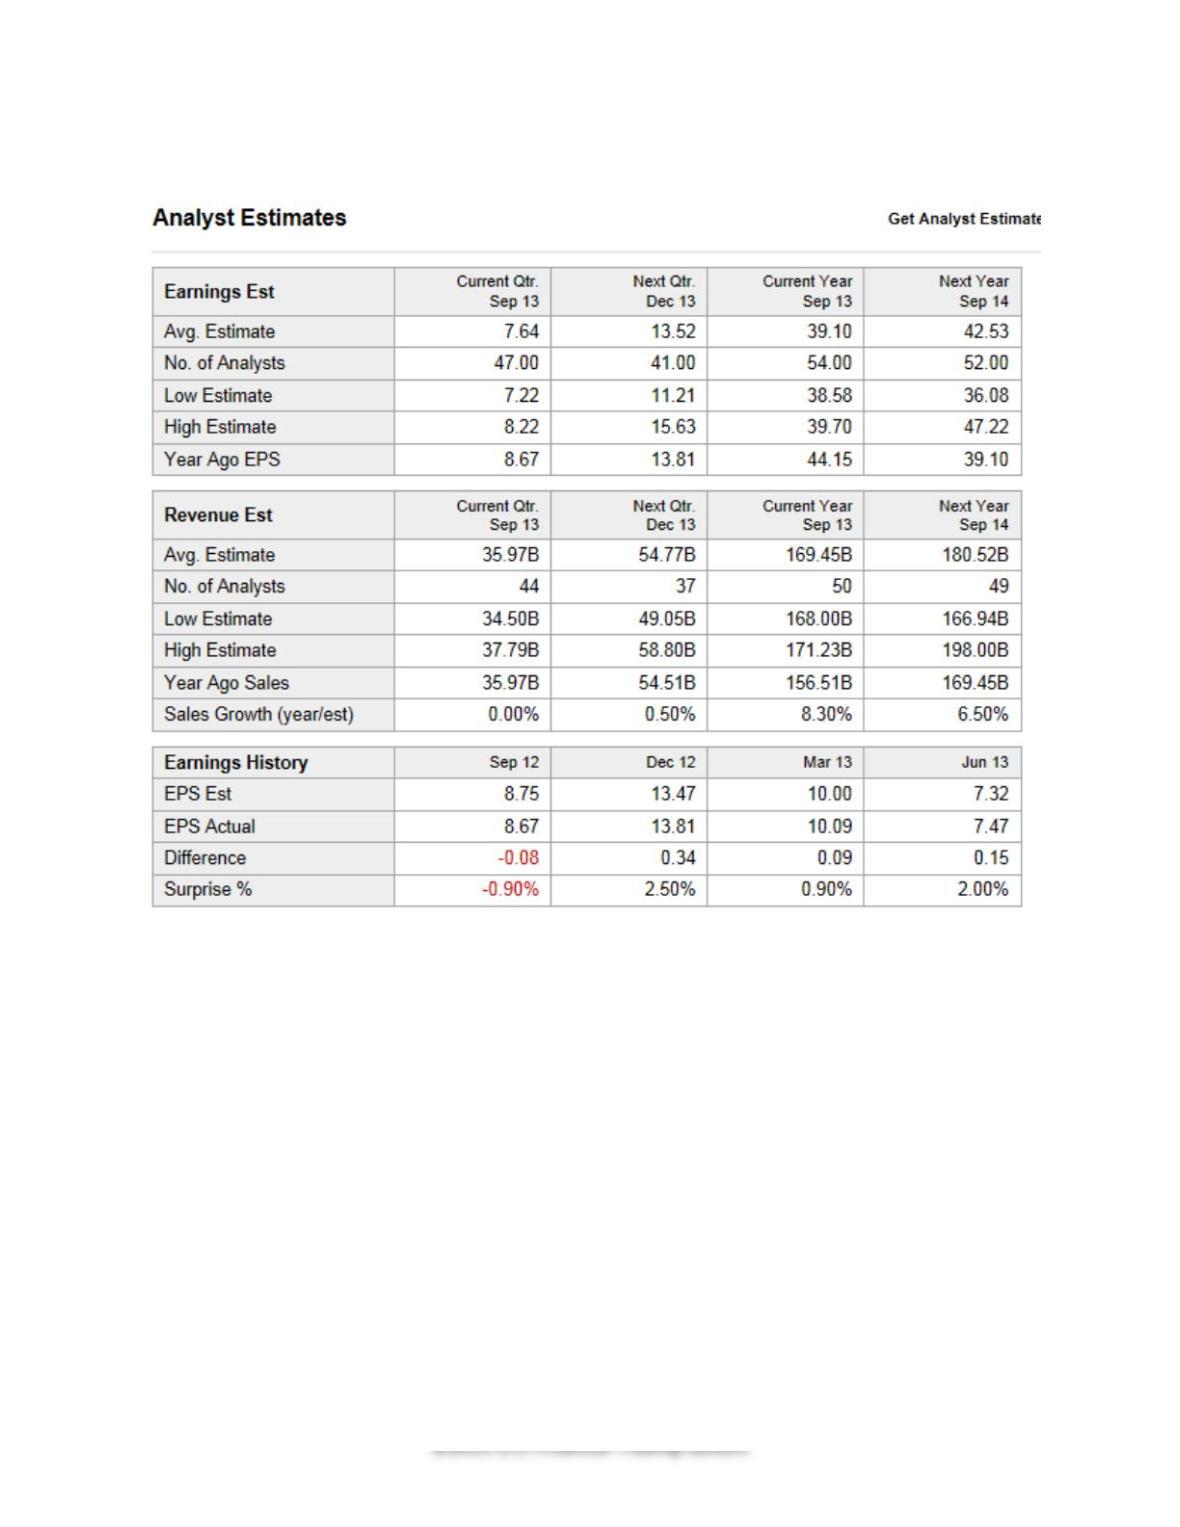
In this assignment you will start with the consensus sales forecast numbers as your “top line” from
which you will make your own earnings forecasts for Apple’s 2013 and 2014 earnings and diluted
earnings per share. The consensus forecast sales numbers are provided in Appendix 1 (the same as
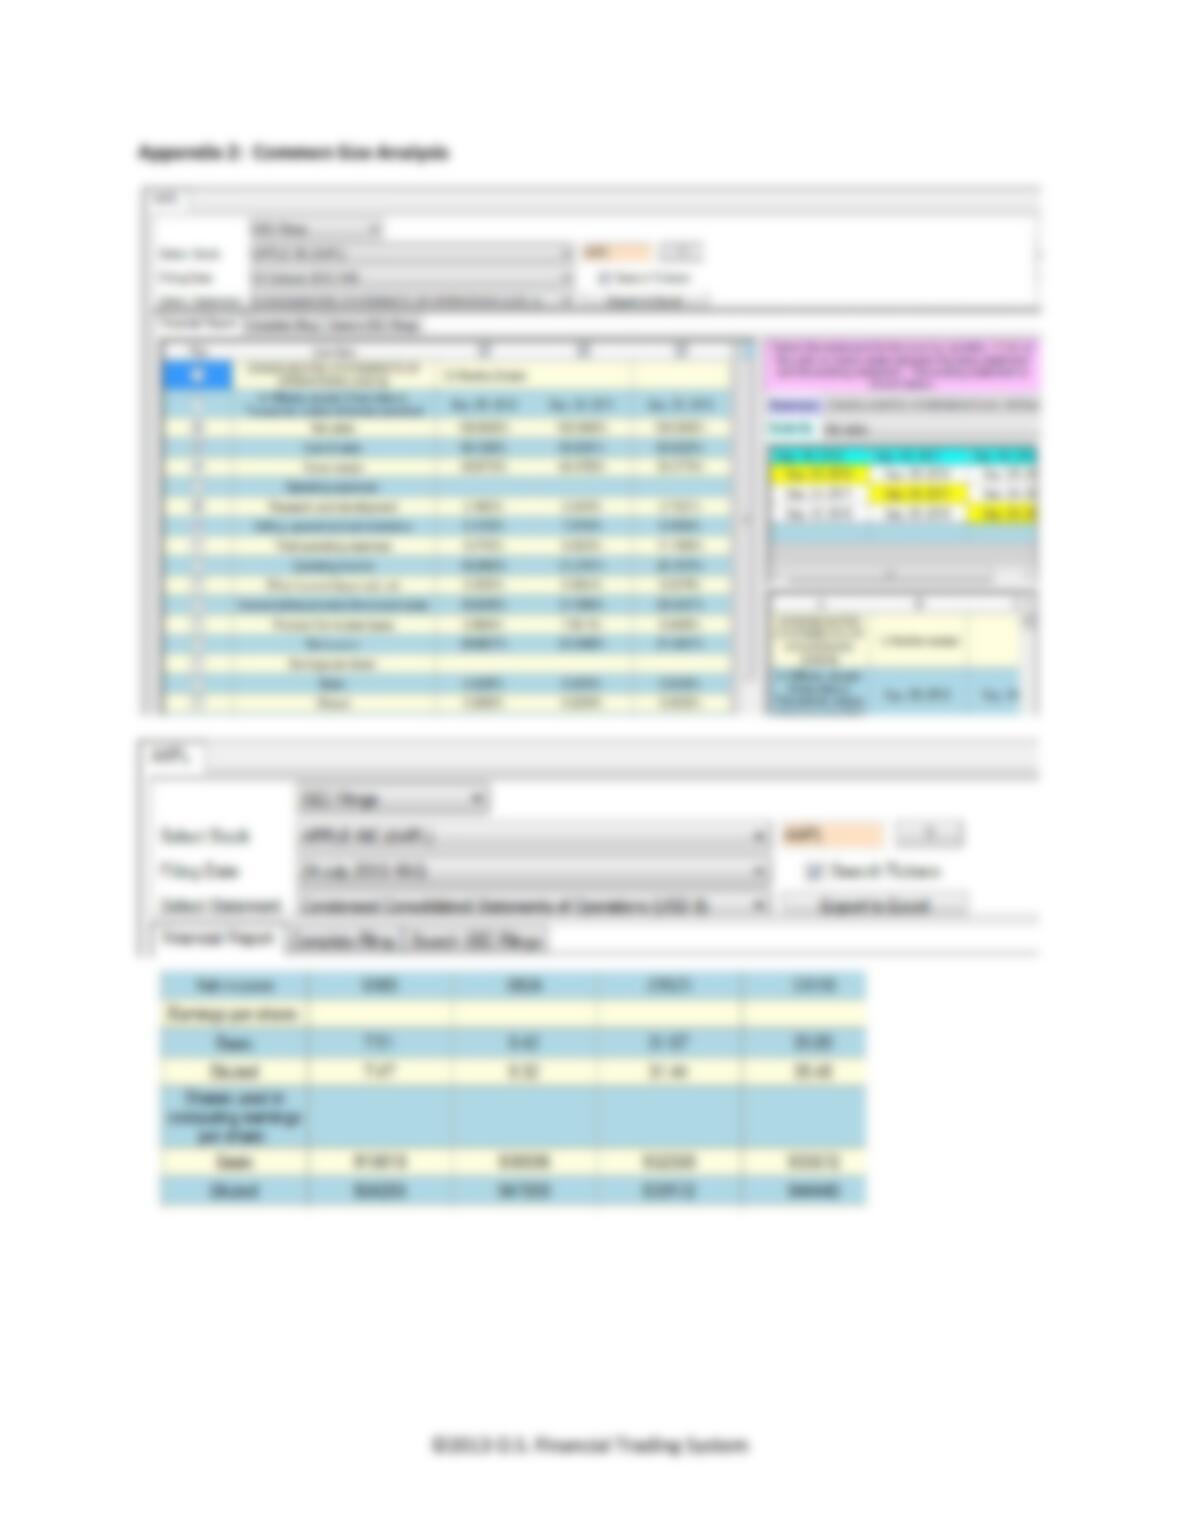
provided in the lecture), common size analysis and related information is provided in Appendix 2,
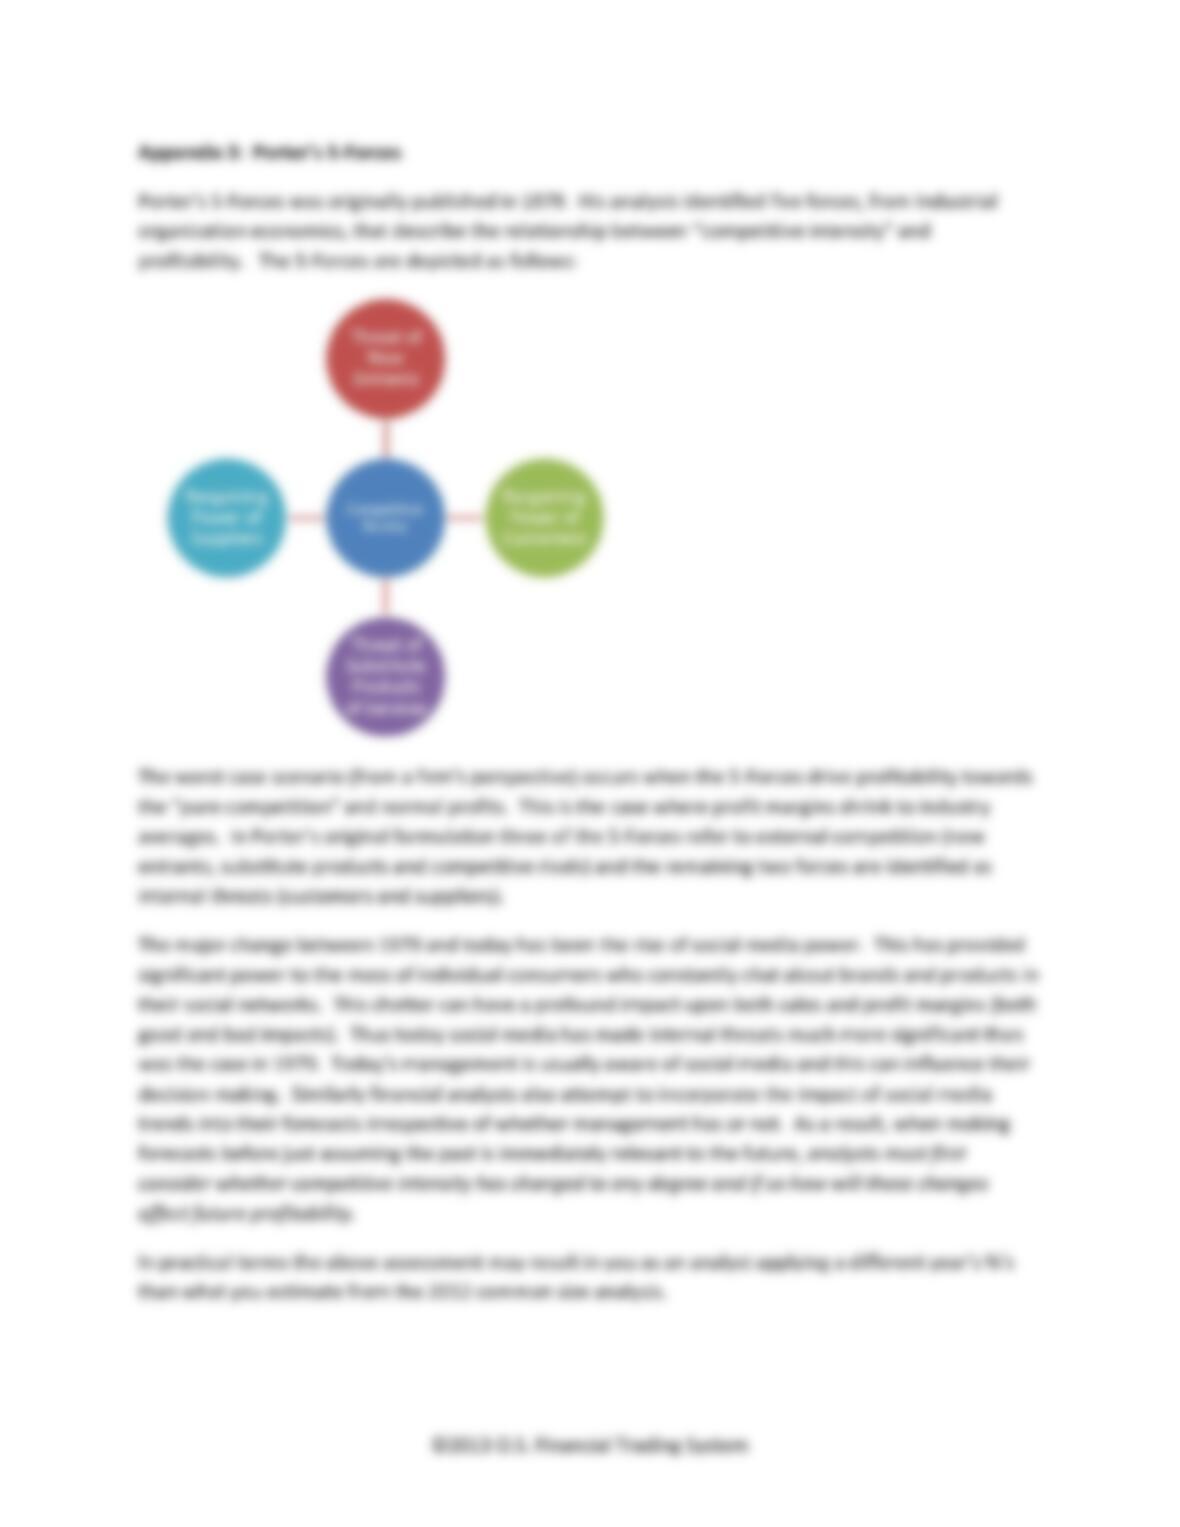
Porters’ 5-Forces is summarized in Appendix 3, and an extended common size analysis is provided in
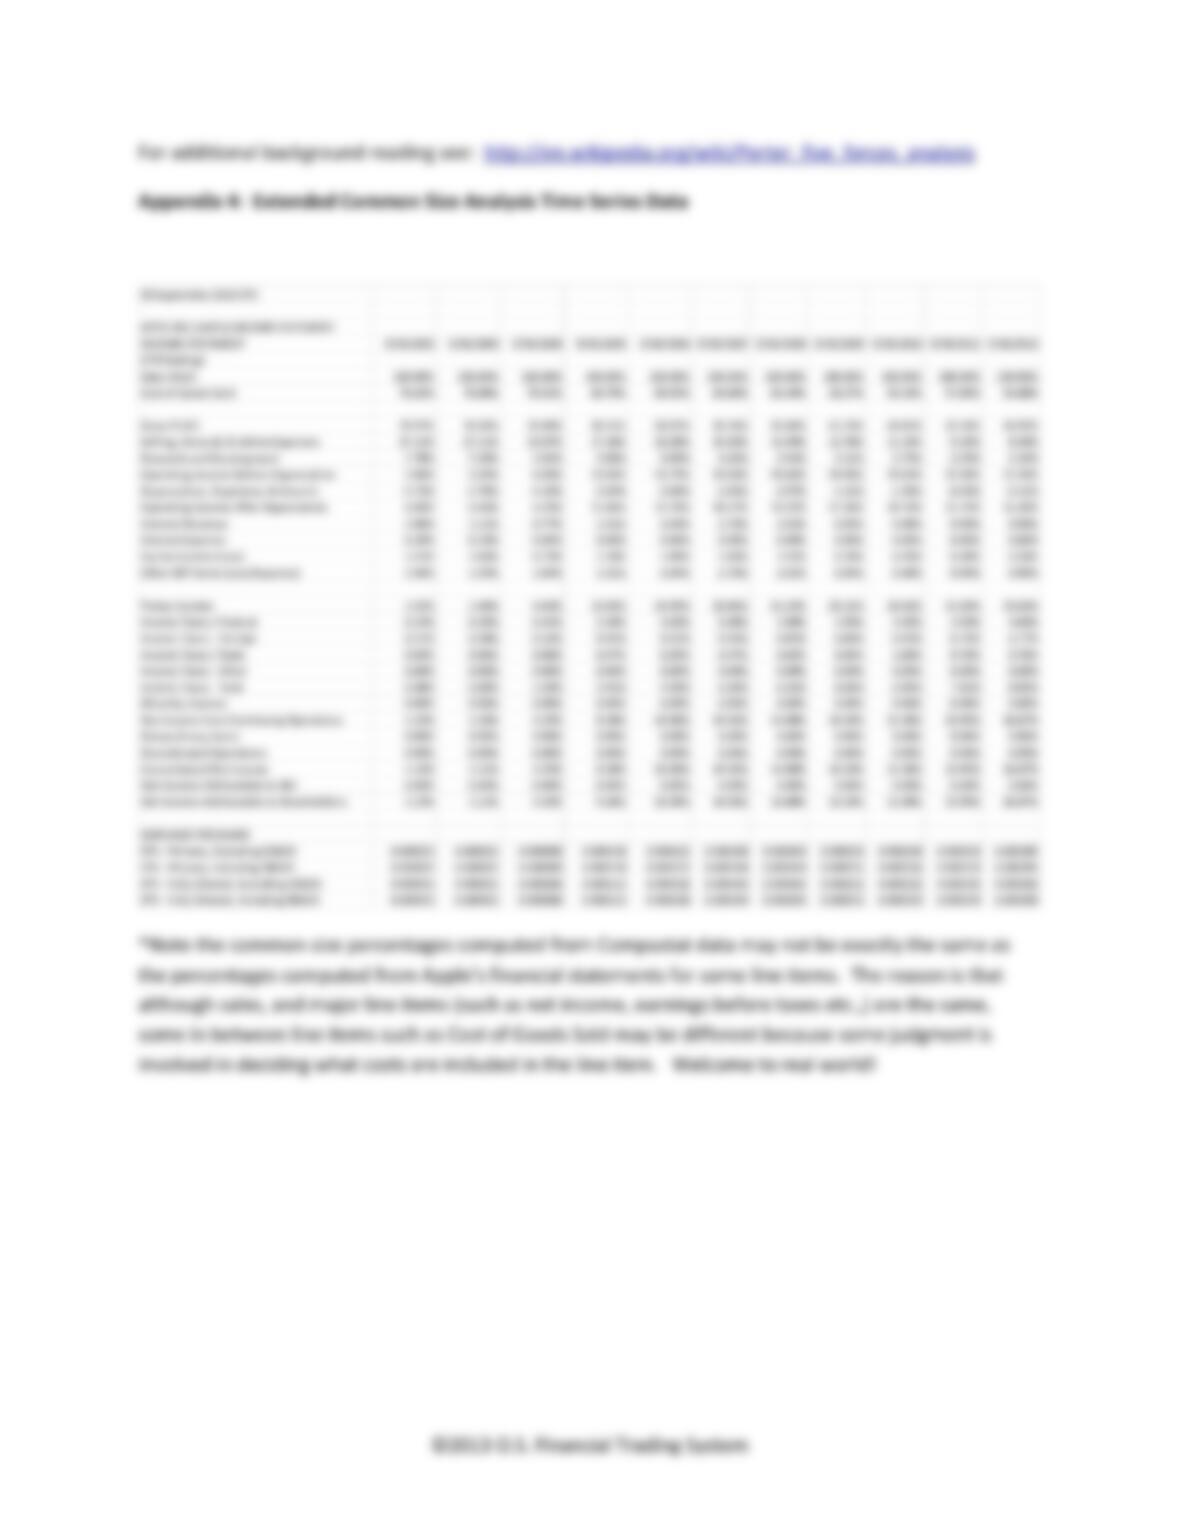
Appendix 4.
Required
1. Using the latest year’s common size analysis (2012), forecast earnings and diluted earnings per
share for Apple 2013 and 2014. Be sure to provide what the scale of your numbers is (i.e.,
millions, billions or whatever scale you choose to work with).
2. Compare this projection to the consensus analyst forecasts comment and provide brief support
whether your forecasts are consistent or not with the analyst consensus.
3. Refer to Appendix 3. This appendix provides Michael Porter’s analysis of Competitive Intensity
and its impact upon profits. Apply Porter’s conceptual framework to reassess your common size
analysis for Apple in 1. above. Based upon this analysis identify which common size year(s) you
view to be more relevant for forecasting Apple’s earnings from for 2013 and 2014. Again
provide brief reasons in support of your answer.
4. Given your answer to part 3. repeat part 1. to make the best forecast you can. Given your
forecast do you expect Apple to meet, beat or fall short of the current consensus analyst
forecasts for 2013 and 2014? – (Provide brief reasons in support of your answer).
Keep within 3 pages for your answers to the above four parts.
Appendix 1: Analyst Sales Forecasts