Financial Performance Report of Big Yellow Group
Company Background
The big yellow offers self storage service, to “get some space in your life”, as it
advertises. The company was founded in 1998 and now is one of the largest self-
storage company in UK.
Introduction&Conclusive Summary
This report analyzes the recent 5 years’ financial performance of the Big Yellow
Group. The first part will use ratios to see the goodness and badness about the
business. Then it will evaluate how the revised requirement for revenue recognition
would influence the company’s results for the year, together with the thinking about
the necessity of accountants to practice ethically.
The Big Yellow Group believes that it will continue to deliver attractive sustainable
returns, on a relatively low risk and limited volatility basis on a long term view.
(BigYellow,2014) The statistics do, on paper, show a steady growth and a fair investor
payback, except the time during extreme financial storms. However, figures can
change and the old data really helps very little with the future prediction.
Section 1-Financial Performance Analysis
In this section, several key ratios will be thoroughly discussed: profitability, liquidity,
long-term stability, stability and investor ratios. All the data is summarized from Big
Yellow’s annual reports 2010-2014.
Profitability-Gross Profit Margin, Operating Profit Margin, ROCE
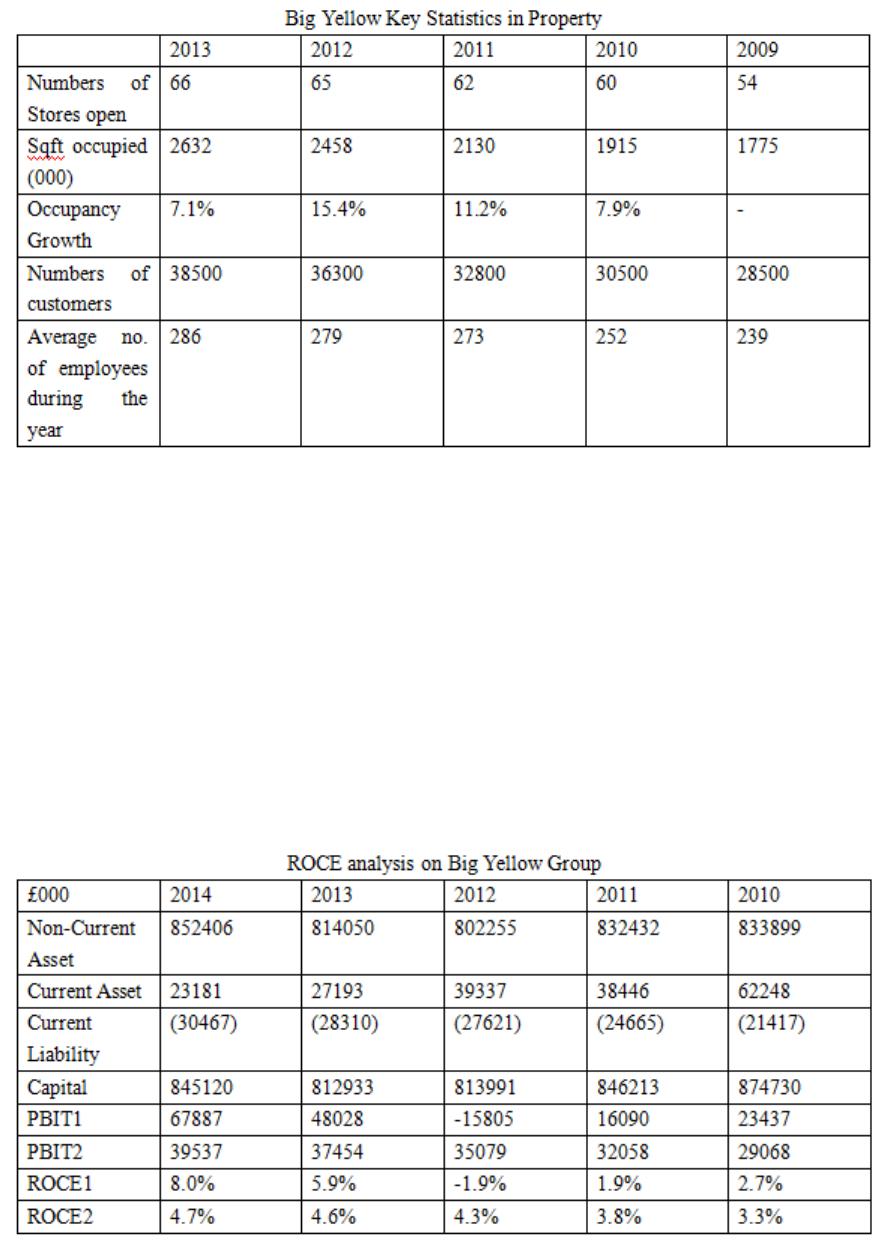
The GPM(gross profit margin) are all above 60% during the time period, and it
displays a slow but steady trend of growth. The Safestore, one of its major
competitors, has 92 properties but less revenue than Yellow. The main costs of self-
storage industry are land and labor, whereas main revenue comes from customers. The
company opens few new stores every year and even slowed down since the crisis, and
the employees remains at the almost same level, numbers of customers grow gently.
So the cost of sales is kept in a controllable level and revenues are foreseeable, which
explains why is there a steady gross profit margin.
As for operating profit margin, it’s quite interesting. The figures are very distinctive
between PBIT1 and PBIT2, hence OPM1 and OPM2.
2012 has the largest loss on investment properties whereas 2014 is year of highest
gain on that. Therefore PBIT1 shows two extreme operating profits in 2014 and 2012
and so does the OPM(94.0% &-24.1%). However, is the company behaving so badly
in 2012 and so successfully in 2014? Obviously, taken out the gain or loss in the
investment market-PBIT2, shows a set of data that is much “normal”, and a stable
margin around 50% is more logical on assessing the company’s financial
performance- after all, it is the global market to blame.
Similarly, if taken out the investment in property, the company is well-capable to
generate a healthy profit using existing capital employed and that capability improves
through time. ROCE is high in this case, and the Non-current asset does not vary
dramatically, suggesting the company is making good use of existing capacity rather
than spending heavily in infrastructure. However, in 2010 there is an outstanding