Financial Management
Question 1
Explain, with examples, how you would measure risk of a single asset
Definition
The general definition of the risk is as volatility, measured by standard deviation.
However, it is not easy to define the concept of risk. It exists the future is uncertain, the
investment result have probability to loss or have any changing. The estimated return will
not be achieved.
Volatility which is equal to risk seems to be the common approach from trading. The
smaller standard deviation, the tighter is probability distribution of the rate return.
Therefore, the lower is the risk of the investment. The two parameters of the distribution
are the expected return and the standard deviation.
Advantage & Disadvantage
The two aspects of risk is there a reward for bearing risk and the greater the potential
reward, the greater is the risk.
However, all the past performance only a guide for future performance, thus, the risk &
rewards is not guarantee.
Expected return
Definition
Risk must be exists in an expected return, and the different from investment decision
forecast must exists risk. (Eugene F. Brigham & Louis C. Gapenski, 1994) The expected
value of an investment is simply the average of a set of values weighted according to the
familiar of occurrence. The method of calculates may be used to find expected sales or the
expected cost of breakdowns for a machine or even the expected net present value of a
whole project. It is able to get all the outcomes or cash flows to be considered and
incorporated into a final expected value.
Formula
The formula of expected return:
Expected Return = P1 x R1 + P2 x R2 +Pn x Rn
Where
P1= Probability of investment 1
R1=Expect return from investment 1
Example
There are 3 states of the economy:
State Probability A&B C&D
RecessionNormalBoom 0.30.40.5 -10%15%30% -30%13%20%
A&B Expected return is =(0.3*-10%)+(0.4*15%)+(0.5*30%)= 18%
C&D Expected return is =(0.2*-30%)+(0.35x*13%)+(0.45*20%)=7.55%
Standard Deviation
Definition
Investors to measure the risk of a stock or a stock portfolio often use it. The standard
deviation is a measure of volatility is the amount of swing in performance that an
investment can be expected to have from year to year.
The standard deviation is an investment average variation from the average return. The
higher the standard deviation which the greater the volatility, greater the risk.
Formula
As another way, it can shows as:
s =*ƒµ (R 1- E(R))*ƒ”€ P1
Where
R 1=Expected return for each year of investment
P1=Probability of occurrence of Investment 1
Example
Economic Outcome Probability Return on Investment
Excellence 25% 25%
Good 35% 20%
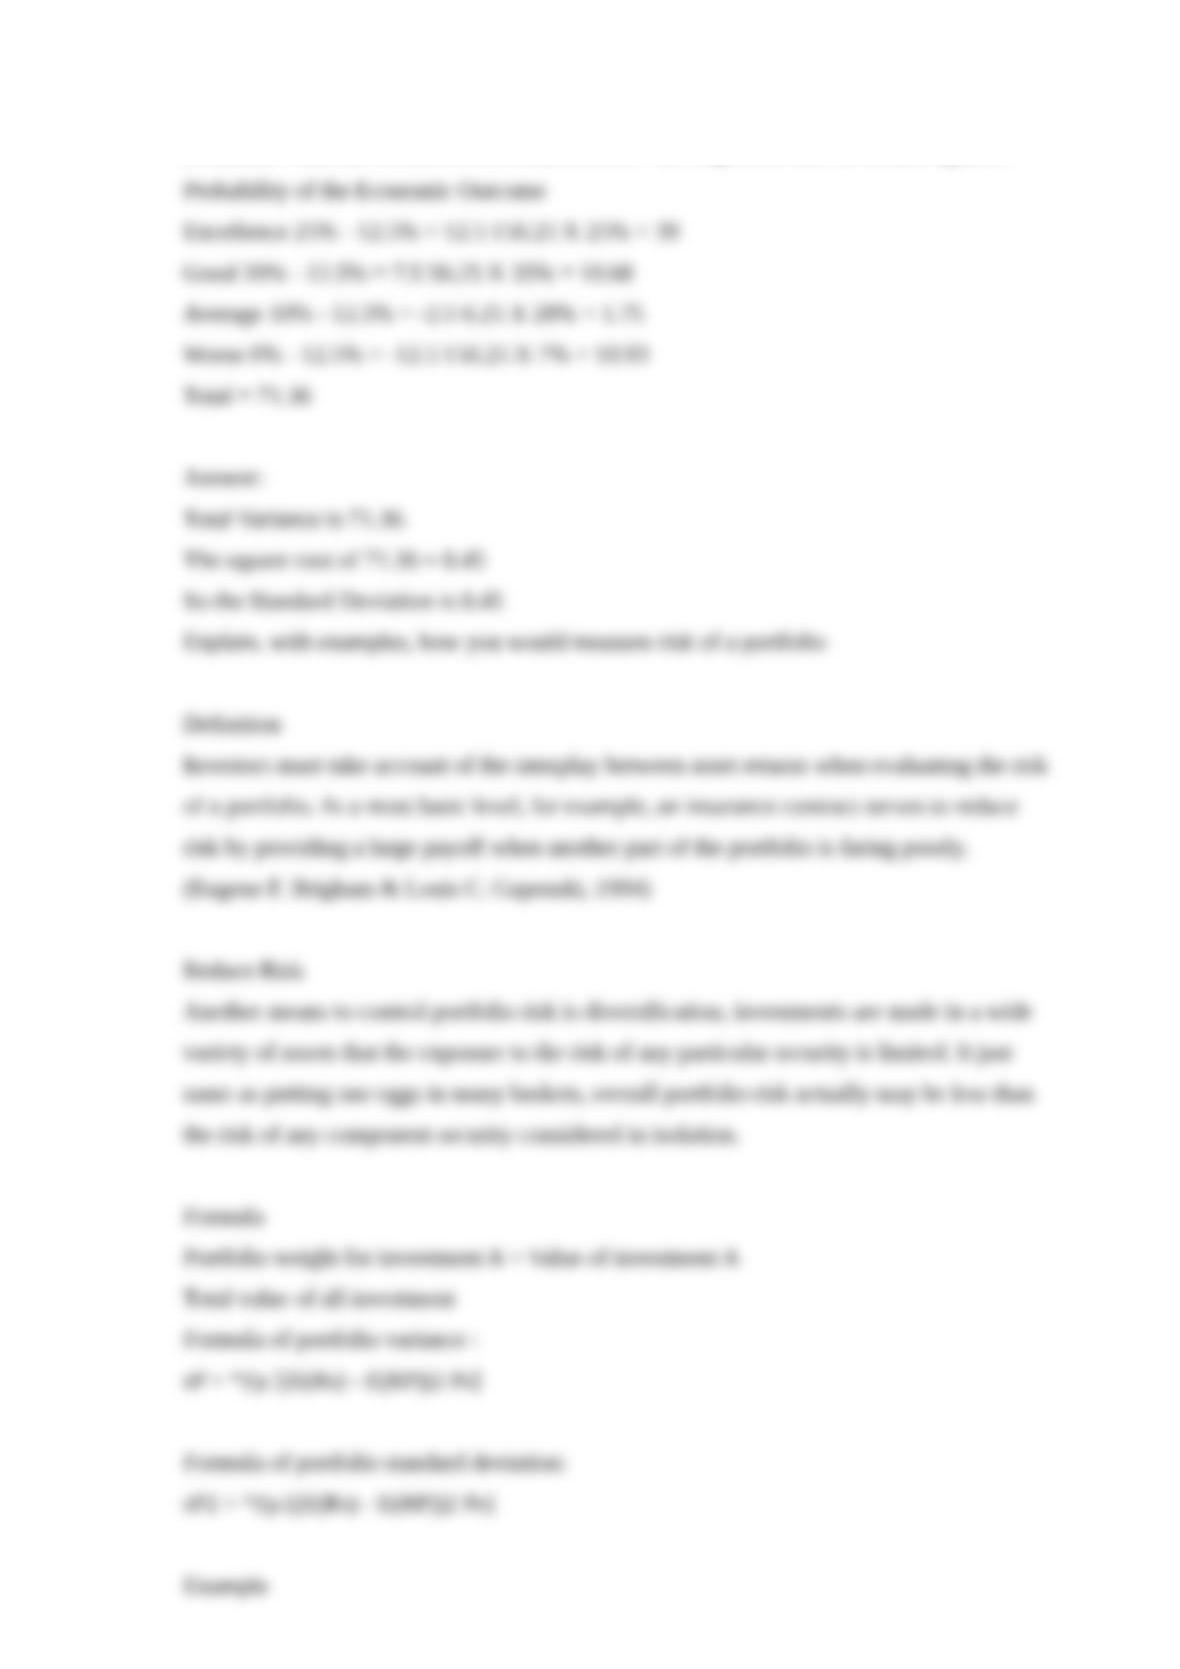
Average 28% 10%
Worse 7% 0%
Economic Outcome Return on Investment ERR – the Expected Rate of Return squared