There are many valuable uses and uses and limitations to both the single and multi-step
income statements. The single-step income statements are a straight to the point accounting of a
company’s activities. The revenues and gains are added together are added at the beginning of
the statement, While the losses and expenses are calculated below them. For an example the
equation is calculated (Revenues + Gains) – (Expenses+ Losses) = Net Income. Unlike the
single-step statement, the multi-step statement offers a more detailed account of the gross-profit
and operating profit of a company. The Operating sections in the statement include revenues and
expenses, also incorporating non-operating sections and detail all the losses and gains of indirect
activity. The sources of expenses and revenues are itemized and shown as different line items,
making it easier for investors to understand the performance and financial health of the company.
The obvious limitation to detailed accounting is that it is more time consuming and complicated
to put together. Accountants using this method must diligently record every transaction to ensure
to maintain segregation of expense types and revenues.
After careful Analysis of Exxon’s 2012 – 2013 Gross, Operation profits and net income
the charts below is what I found.
Exxon Mobil Corp., Gross Profit
(Selected Financial Data (USD $ in millions)
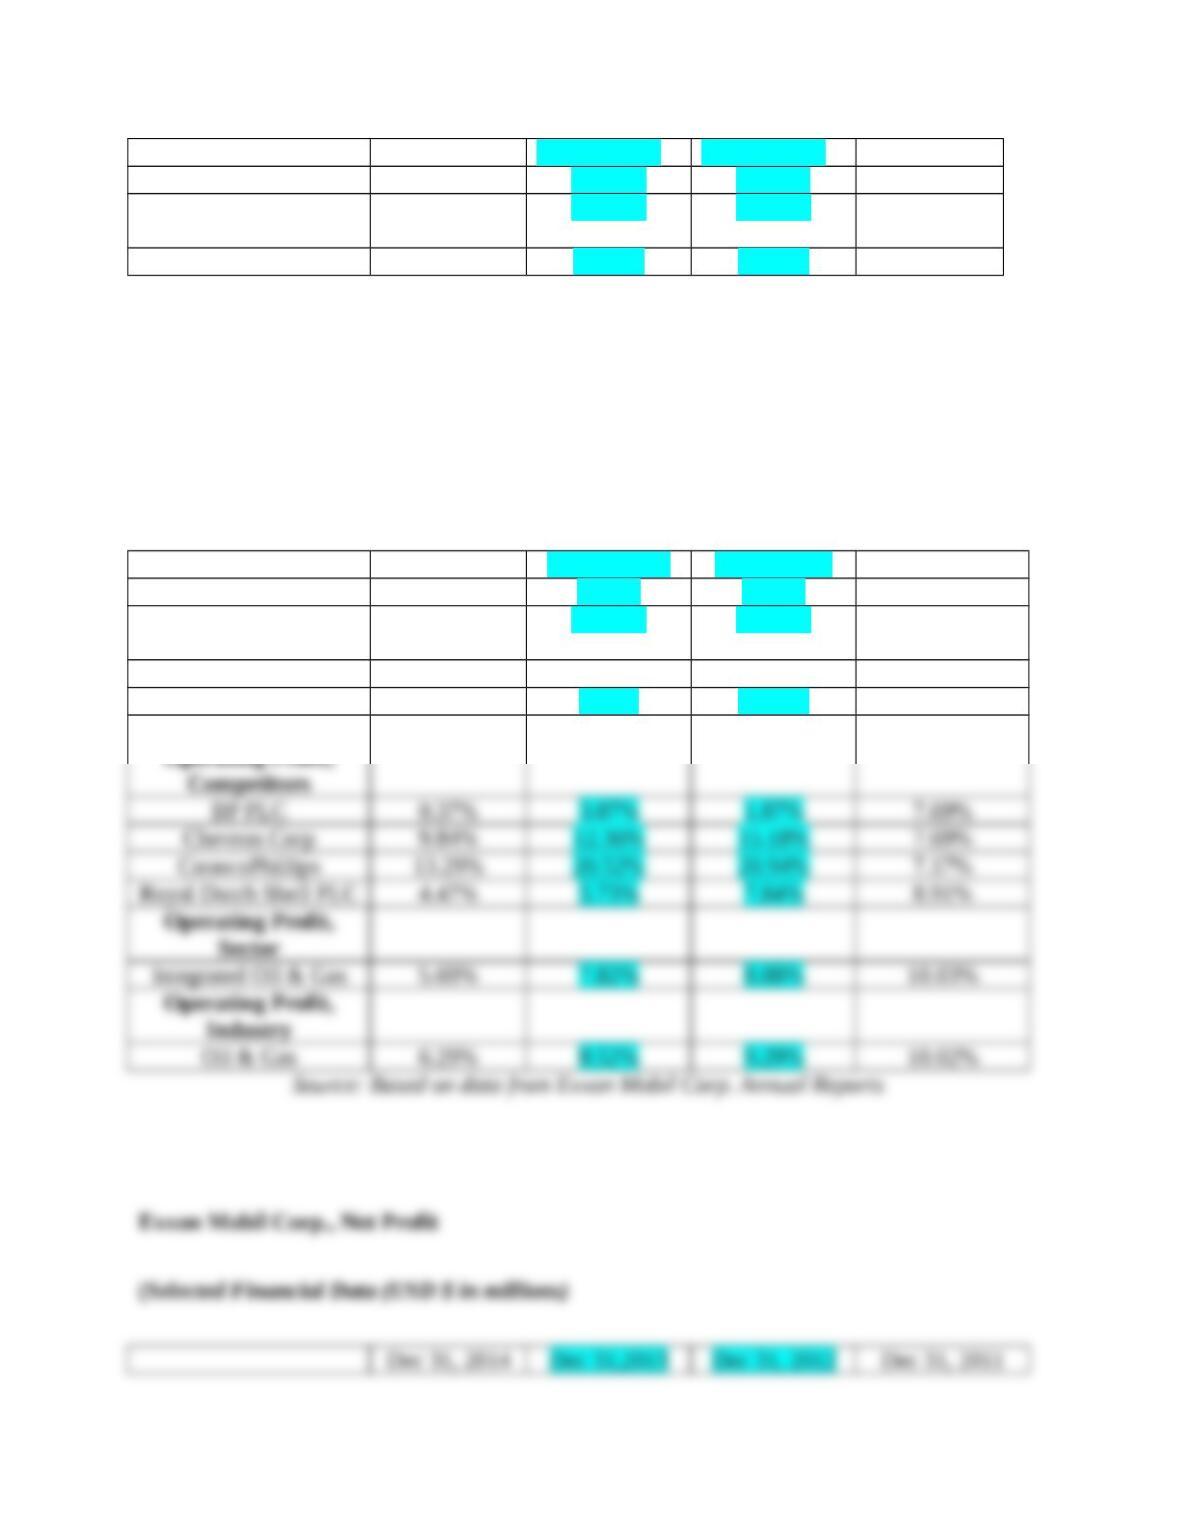
Dec 31, 2014 Dec 31, 2013 Dec 31, 2012 Dec 31, 2011
Gross Profit 97,932 105,566 117,044 126,724
Sales & other
operations revenues
394,105 420,836 453,123 467,029
Gross Profit Margin 24.85% 25.08% 25.83% 27.13%
Source: Based on data from Exxon Mobil Corp. Annual Reports
Exxon Mobile Corp., Operating Profit
(Selected Financial Data (USD $ in millions)
Dec 31, 2014 Dec 31, 2013 Dec 31,2012 Dec 31,2011
Operating income 34,082 40,031 49,881 54,104
Sales and other
Operating revenue
394,105 420,836 453,123 467,029
RATIO
Operating profit margin 8.65% 9.58% 11.01% 11.58%
Benchmarks