EXAM
MARK LESTER RODRIGUEZ
10
12
14
16
18
20
22
24
26
28
30
32
34
42 44 46 48 50 52 54 56 58 60 62 64 66 68
TIME
SPEED
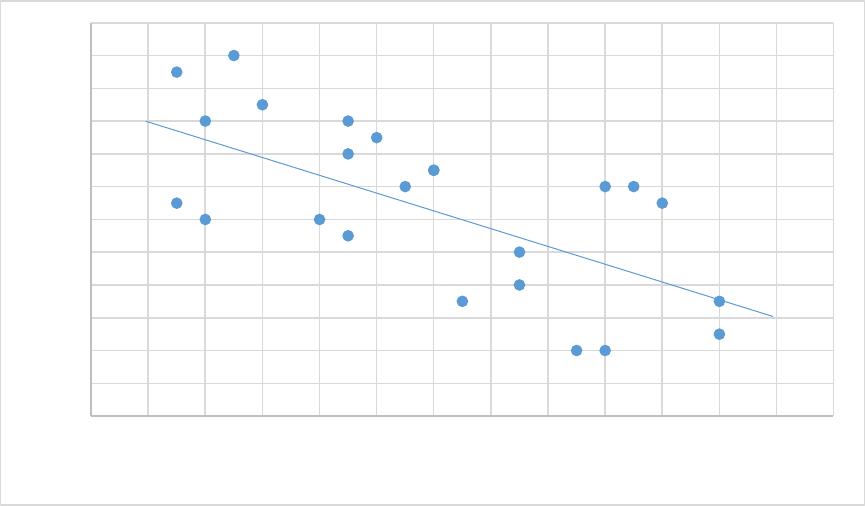
1. Given below are the speed you drive, and the time it takes to get you to work. Examine the
cause and effect relationship of the 2 variables through scatter diagram.
SPEED TIME SPEED TIME
64 17 48 29
62 23 59 14
51 26 57 18
46 28 50 22
52 27 45 23
51 28 47 32
57 20 46 22
60 14 61 24
55 17 54 25
51 21 53 24
64 15 45 31
60 24 54 25
SCATTER DIAGRAM
EXAM
MARK LESTER RODRIGUEZ
90.00%
100.00%
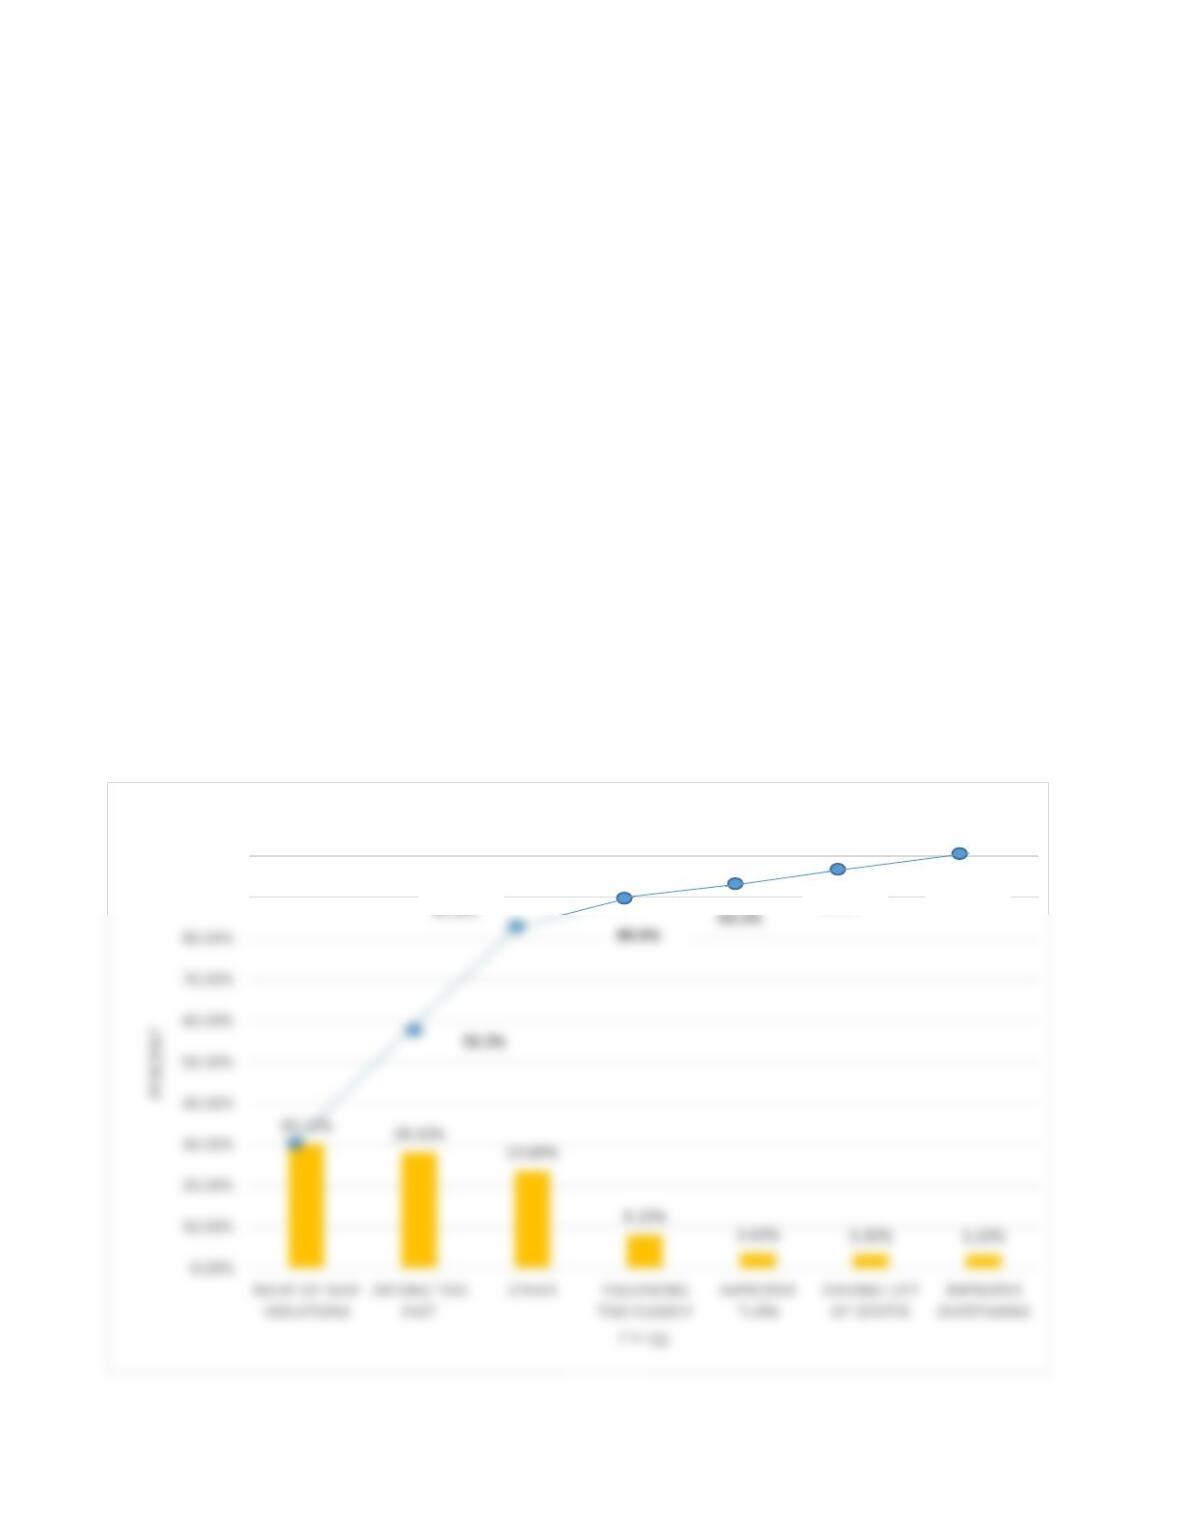
PARETO DIAGRAM
2. Approximately two – thirds of all automobile accidents are due to improper driving. Construct a
Pareto diagram with cumulative line for the data: improper turn, 3.6%; driving too fast for
conditions, 28.1%; following too closely, 8.1%; right-of-way violations, 30.1%; driving left of
center, 3.3%; improper overtaking, 3.2%; and other, 23.6%.
CAUSE PERCENT CUMMULATIVE
RIGHT-OF-WAY VIOLATIONS 30.1% 30.1%
DRIVING TOO FAST 28.1% 58.2%
OTHER 23.6% 81.8%
FOLLOWING TOO CLOSELY 8.1% 89.9%
IMPROPER TURN 3.6% 93.5%
DRIVING LEFT OF CENTER 3.3% 96.8%
IMPROPER OVERTAKING 3.2% 100%
96.8%
100%
58.2%
81.8%
89.9%
93.5%