1 INTRODUCTION
The exchange rate is one of the key factors affecting the sustainable growth of a country’s
economy. On a smaller scale, exchange rate directly impacts the profitability of international
business activity. For those reasons, exchange rates are among the most watched, analyzed
economic measures. However, what determines the exchange rate appears to be a difficult
question to the analysts.
Among the currency pairs, the Euro/ United State Dollar (EUR/USD) appears to be among the
most concerned because of their dominance in the world market. Surprisingly, the dynamics of
the EUR/USD exchange rate from 1999 until nowadays is highly unexpected, remaining a puzzle
(Belloc & Federici, 2010).
This essay is an attempt to discuss and analyse the movements in the value of the U.S. dollar
against the Euro for the past 10 years based on theories and practical economic, political and
social events as well
2 HISTORY OF THE U.S. DOLLAR AND THE EURO
The United States Dollar (USD) dates back more than 200 years ago since its issuance on August
8, 1786 and it has been through a lot of economic fluctuations to become the most international
currency. Particular in World War II, the United States’ economy relatively unharmed while
Europe and Asia was devastated. After war, those countries would import commodities from the
United States (the U.S) to reconstruct their counties. Consequently, the USD are widely used and
further supported by strong position of the U.S in the world economy and politics until now.
In 1957, the European Union (EU) was established for the purpose of creating a common market
(European Commission, 2014a). Gradually, EU has accelerated the economic integration to
develop and flourish further. In 1992, Economic and Monetary Union was founded under
Maastricht Treaty which develop the ground rules for the introduction of a single currency, Euro
(European Commission, 2014a). When Euro was initially introduced on January 1, 1999, it is

adopted by 11 countries. Later on, this number has increased to reach 18 countries in 2014
(European Commission, 2014a).
In the economic sense, countries within the Eurozone enjoy cheaper transaction costs. The risks
and costs related to currency exchange rate are also eliminated. Therefore, the price transparency
and price-based competition is increased (Eiteman, Stonehill, & Moffett, 2013). The single
currency, euro, is believed to maintain low inflation and encourage sound public finances.
Additionally, the Eurozone give better protection to its members from external economic
fluctuations, for instances, unexpected change in oil price or foreign exchange rates. In the
political sense, a common currency gives the EU stronger position in the world (European
Commission, 2014b).
Since its introduction, Euro has become the second major international currency after the US
dollar (European Commission, 2014b). Furthermore, the Euro is widely believed to have the
potential of becoming an even more important currency (Apergis, Zestos, & Shaltayev, 2012).
This lies in the fact that the Euro is currently the currency of 333 million people living in 18
countries of the Eurozone. It is additionally used by close neighbouring countries and former
colonies (European Commission, 2014b).
As both the Euro and the USD are the key international currency in the world, the relationship
between them is crucial, not only to the U.S and the Eurozone, but also to other economies in the
world as a whole (Mussa, 2005).
3 MOVEMENT OVER THE PAST 10 YEARS
3.1 OVERVIEW
1
1.1
1.2
1.3
1.4
1.5
1.6
1.7
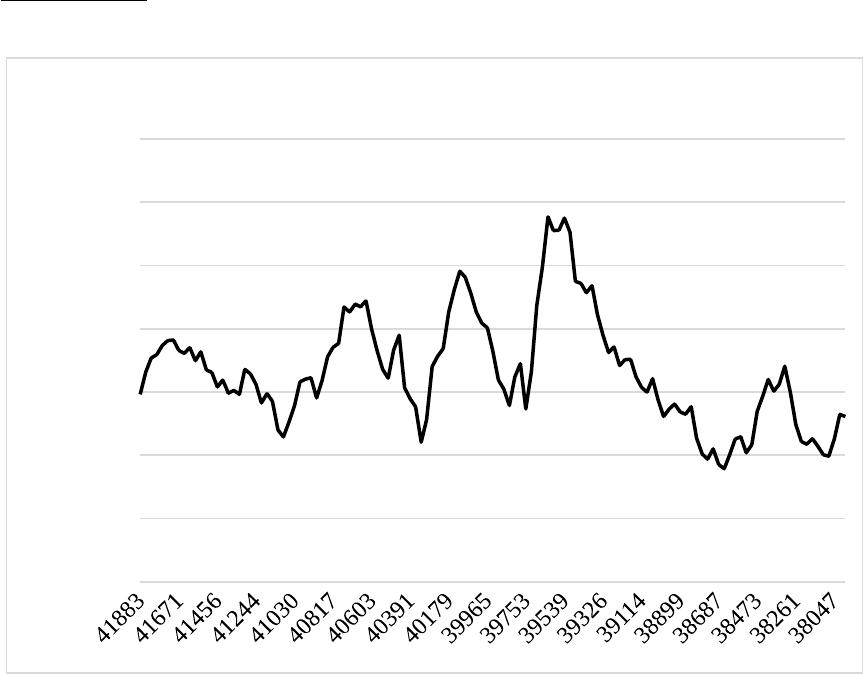
Monthly average EUR/USD
EUR/ USD
Source: Data drawn from the European central bank, ecb.europa.eu, monthly average
Over the period of 10 years, the common trend is the appreciation of EUR against the USD with the
increase from 1.2613 in January 2004 to 1.2962 in September 2014. However, the EUR/USD exchange
rate experienced considerable fluctuations, especially from July 2007 to the end of 2012 due to the
subprime mortgage crisis in the United States of America (The U.S) and the sovereign debt crisis in the
Eurozone.
3.2 STAGE AND EXPLANATION
3.2.1 2004 – July 2007
1.1
1.15
1.2
1.25
1.3
1.35
1.4
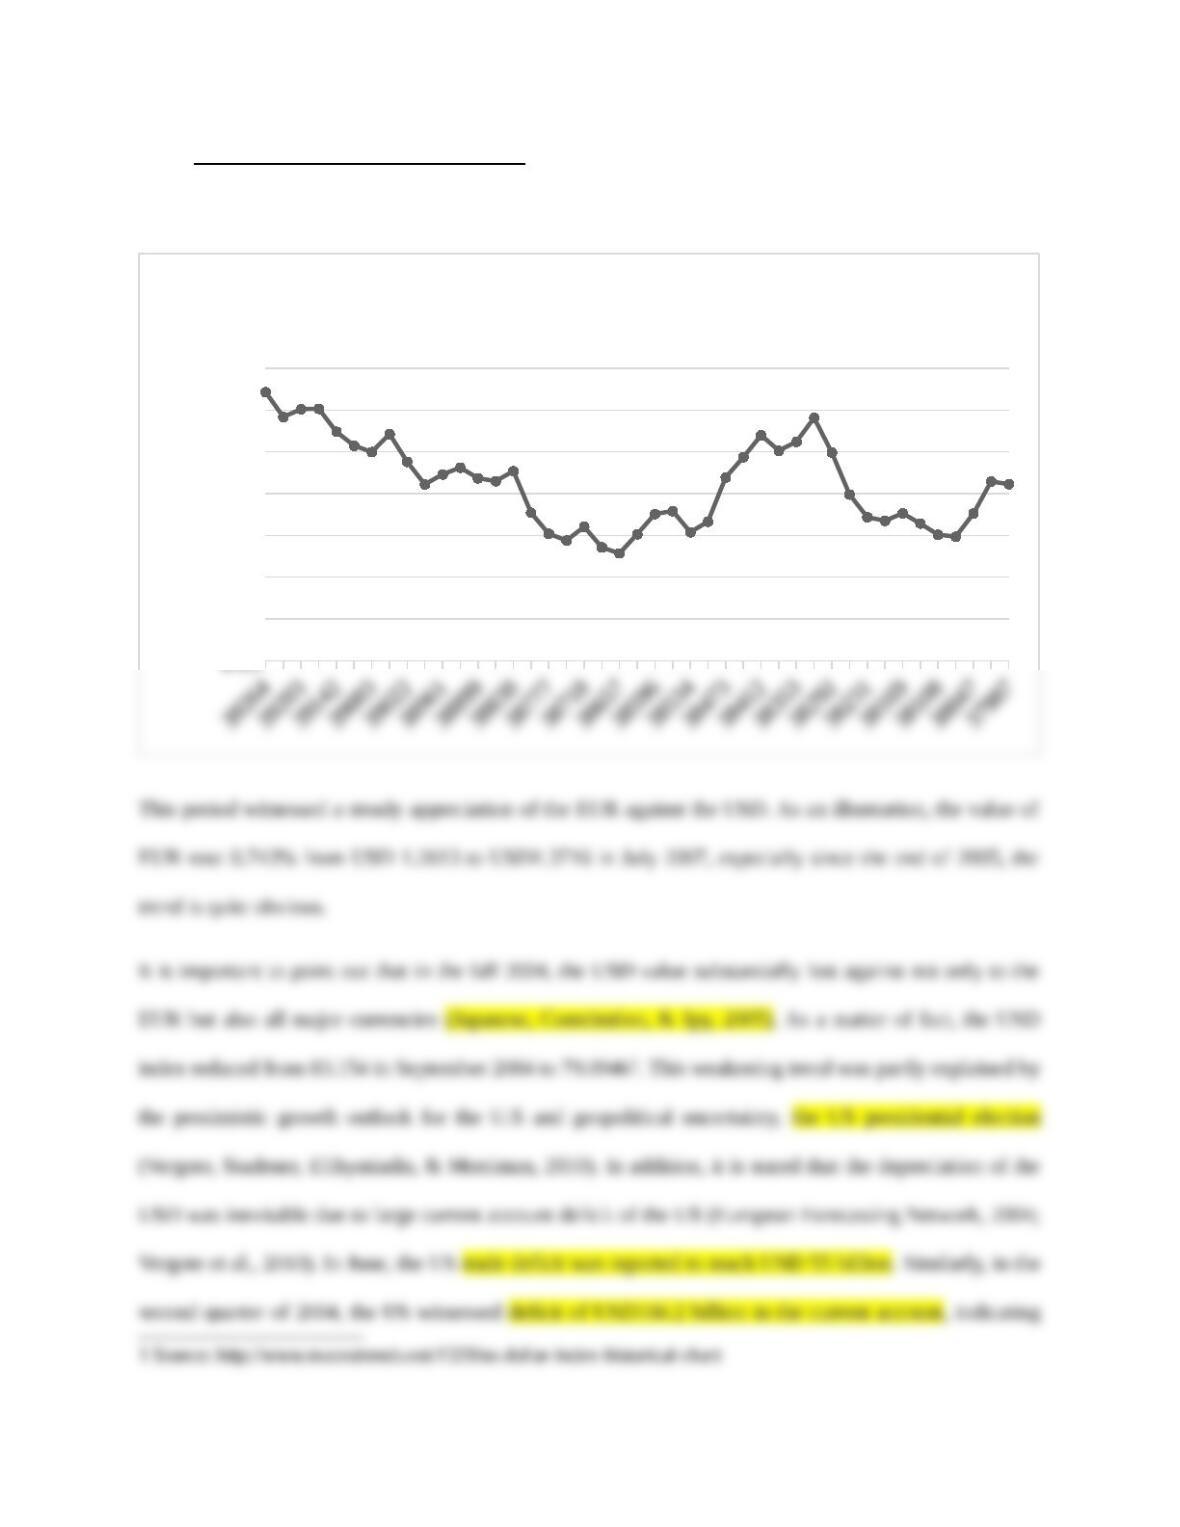
MONTHLY AVERAGE EXCHANGE RATE
from January 2004 to July 2007
USD/EUR